2518
Diffusion Time Dependence of Apparent Diffusion Coefficient and Intravoxel Incoherent Motion Diffusion Parameters in the Human Kidney1Department of Diagnostic and Interventional Radiology, Heinrich Heine University Dusseldorf, Dusseldorf, Germany
Synopsis
Due to non-Gaussian nature of water diffusion in tissues, the measured diffusion-related parameters depend on b-values and diffusion time. In fact, our study shows that the apparent diffusion coefficient (ADC) and IVIM-related diffusion coefficient D obtained in the human kidney slightly increase with the diffusion time in the range between 20 ms and 45 ms, as opposed to ADC and D of skeletal muscle. Among all investigated diffusion parameters, the IVIM-based pseudodiffusion coefficient D* exhibits the strongest dependence on diffusion time and could potentially provide valuable information regarding the blood vessels and urine flow in the kidney.
Introduction
Over the past years, diffusion-weighted imaging with the mono-exponential apparent diffusion coefficient (ADC) has emerged as a valuable quantitative biomarker for various renal disorders1. Since the diffusion in tissues is not Gaussian, the measured ADC depends on the selected b-values and diffusion time, which is often not displayed on clinical MRI scanners. Several studies have reported an increase in ADC at short diffusion times2,3. Furthermore, ADC values are strongly influenced by both tissue diffusivity and capillary microperfusion4. In fact, recent investigations have revealed that in intrinsically well-perfused organs, the diffusion-attenuated signal is better described by the bi-exponential intravoxel incoherent motion (IVIM) model, which separates the perfusion effects from the true water diffusion5,6.The aim of this study was to investigate the diffusion time dependence of ADC and IVIM-derived diffusion parameters in the renal tissue at 3T. For this purpose, diffusion-weighted data acquired at sixteen b-values and four different diffusion times were analyzed with the mono-exponential model and bi-exponential IVIM-DWI.
Methods
The study protocol was approved by the local ethics committee and written consent was obtained from all participants. Seven healthy volunteers (5 females and 2 males, mean age 30.1±5.4 years) were recruited for this study. All MR experiments were performed on a 3T MR scanner (MAGNETOM Prisma, Siemens Healthcare, Erlangen, Germany). DW-images were acquired using a prototypical single-shot echo-planar imaging (EPI) sequence with following parameters: TE/TR = 71/1900 ms; FOV: 370 x 370 mm2; acquisition matrix: 176 x 176; voxel size: 2.1 x 2.1 x 5.0 mm3; 3 slices; averages: 3; diffusion directions: 3; b-values: (0, 10, 20, 30, 40, 50, 70, 100, 150, 200, 250, 300, 350, 450, 550, 650, 750) s/mm2; diffusion times Δ: (20, 26, 35 and 45) ms; spectral-attenuated inversion-recovery (SPAIR) fat saturation. The DW data acquisition was respiratory-triggered.A single slice of the right kidney with no visible motion was selected for further analysis. The cortical-medullary regions of interest (ROIs) were manually segmented by an experienced radiologist using image segmentation toolbox ITK-SNAP7. The subsequent data post-processing was performed using an in-house developed software in MATLAB. All 16 b-values were used to fit a biexponential model to the ROI-averaged diffusion signal for the calculation of IVIM parameters (D, D* and fp), and a mono-exponential diffusion model for the calculation of ADC. The same analysis was performed in the psoas major muscle in three volunteers to allow for direct comparison between different tissue types.
Results
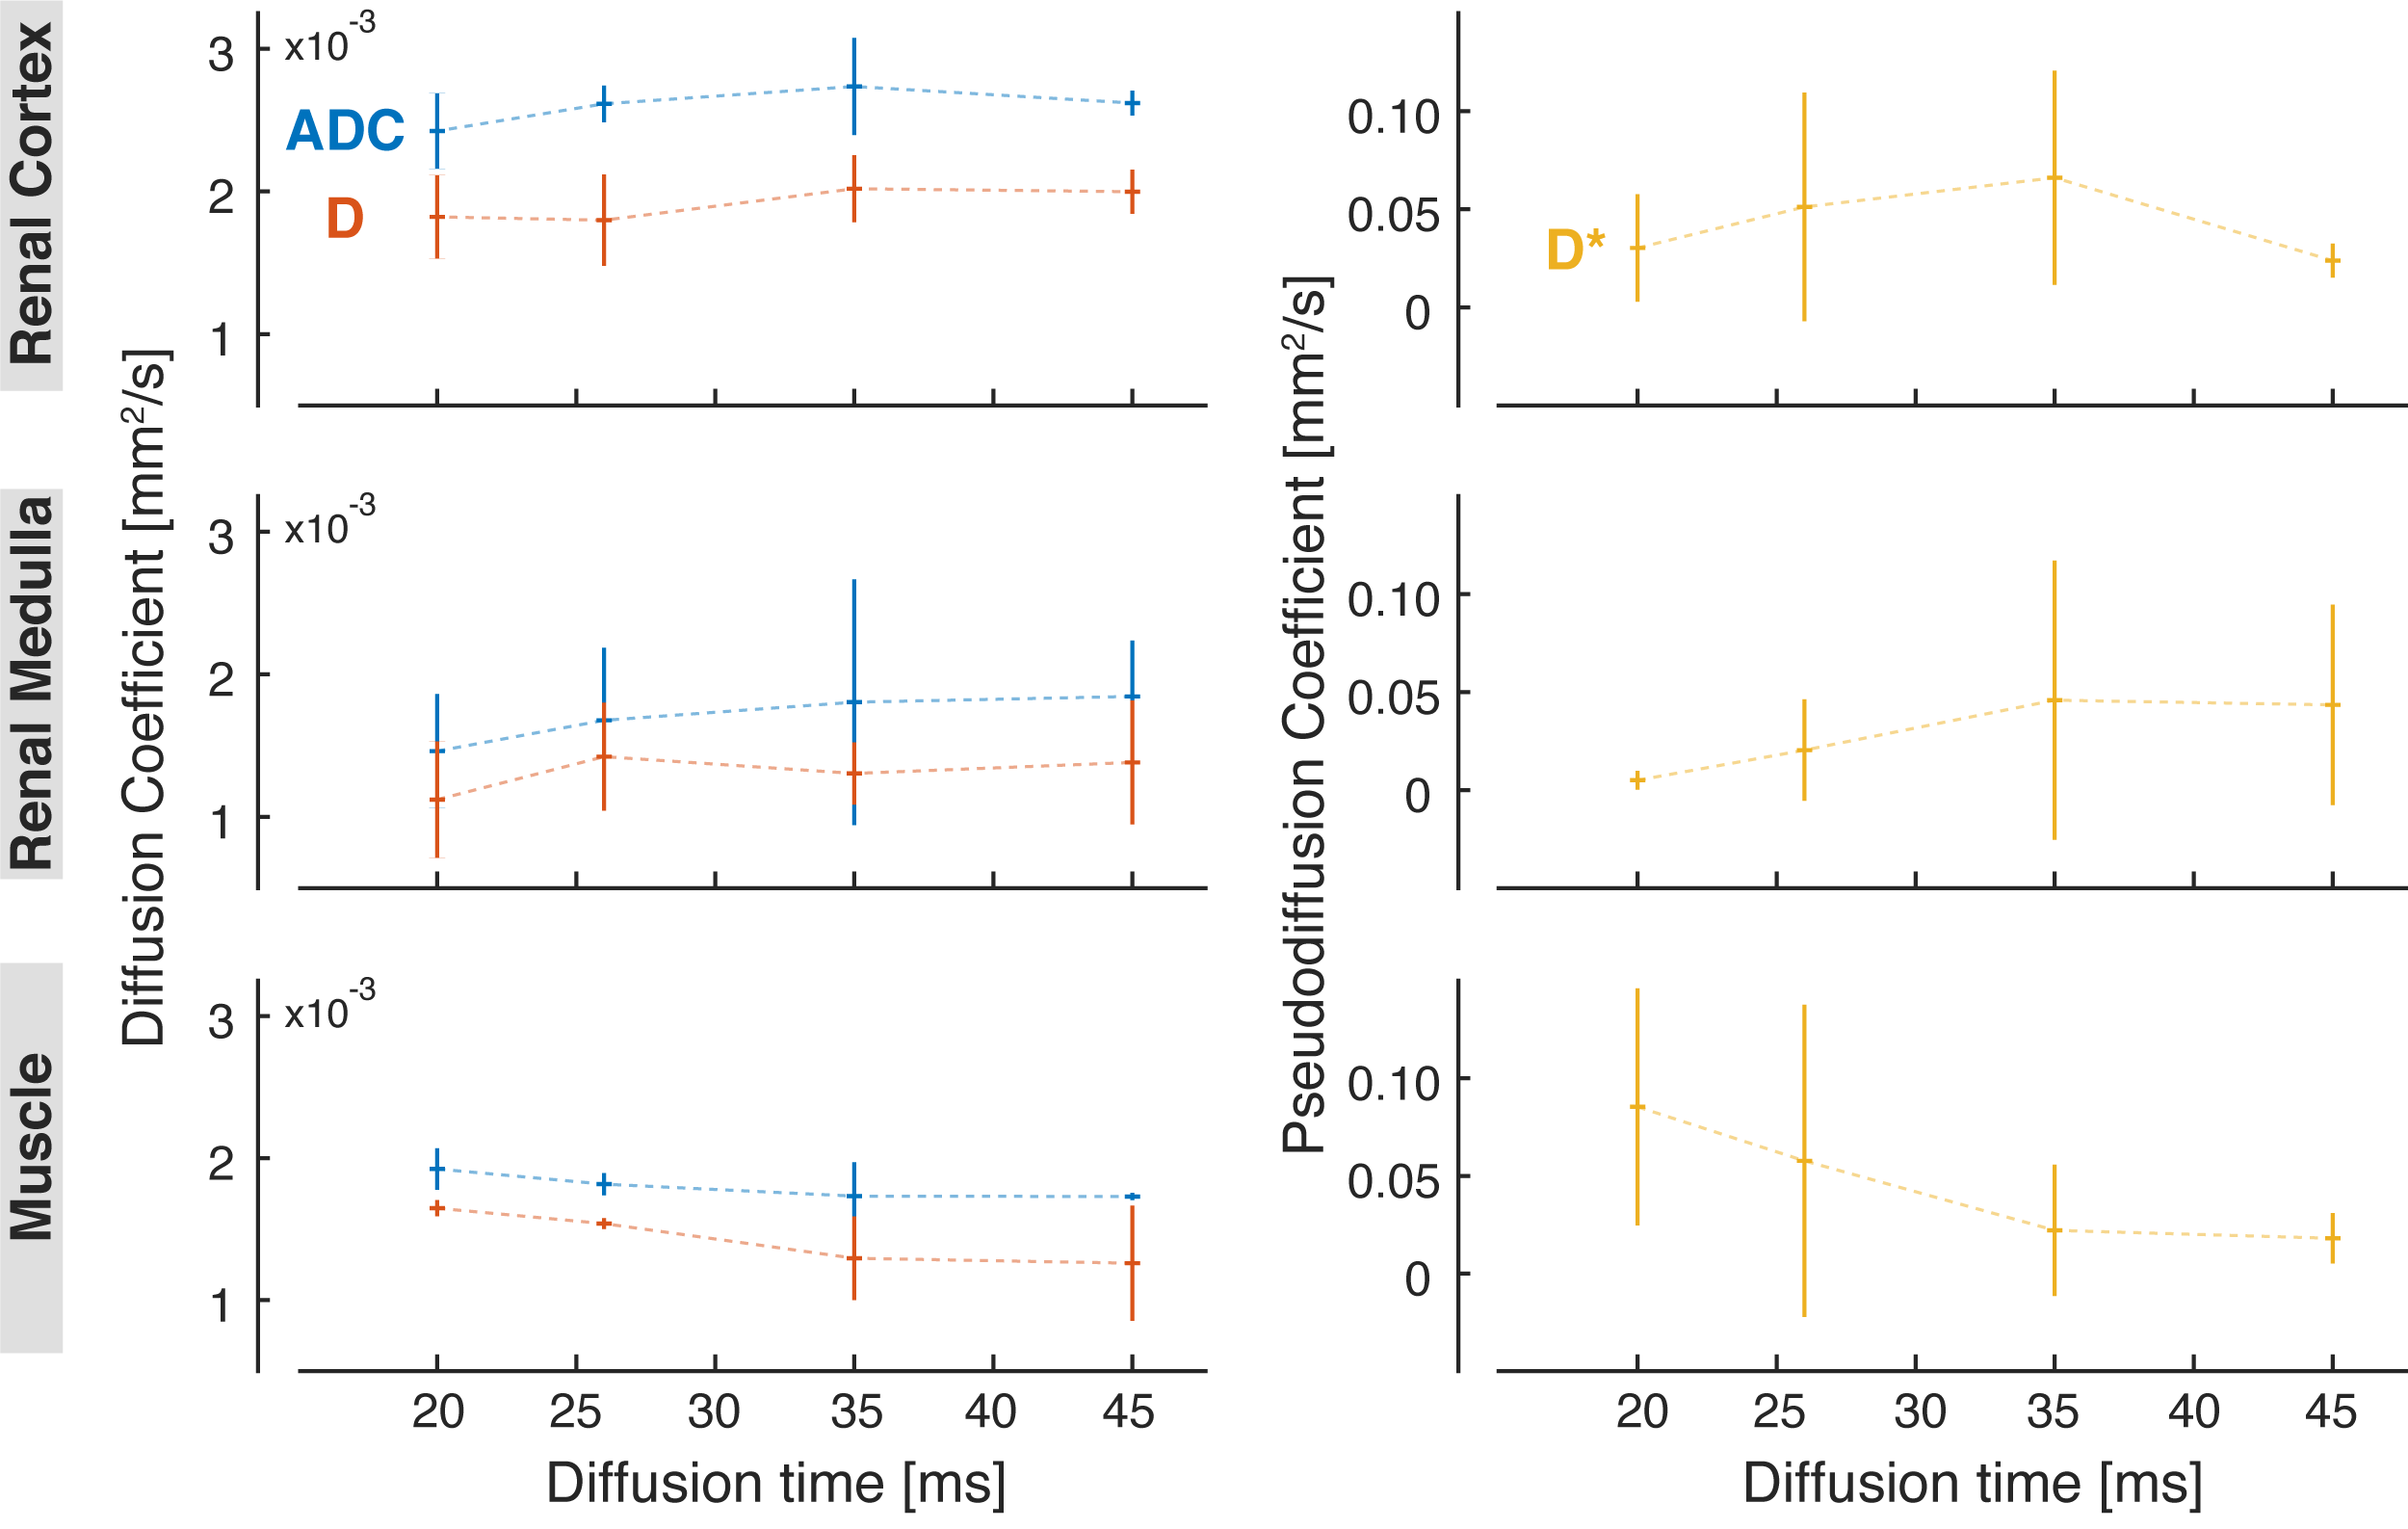
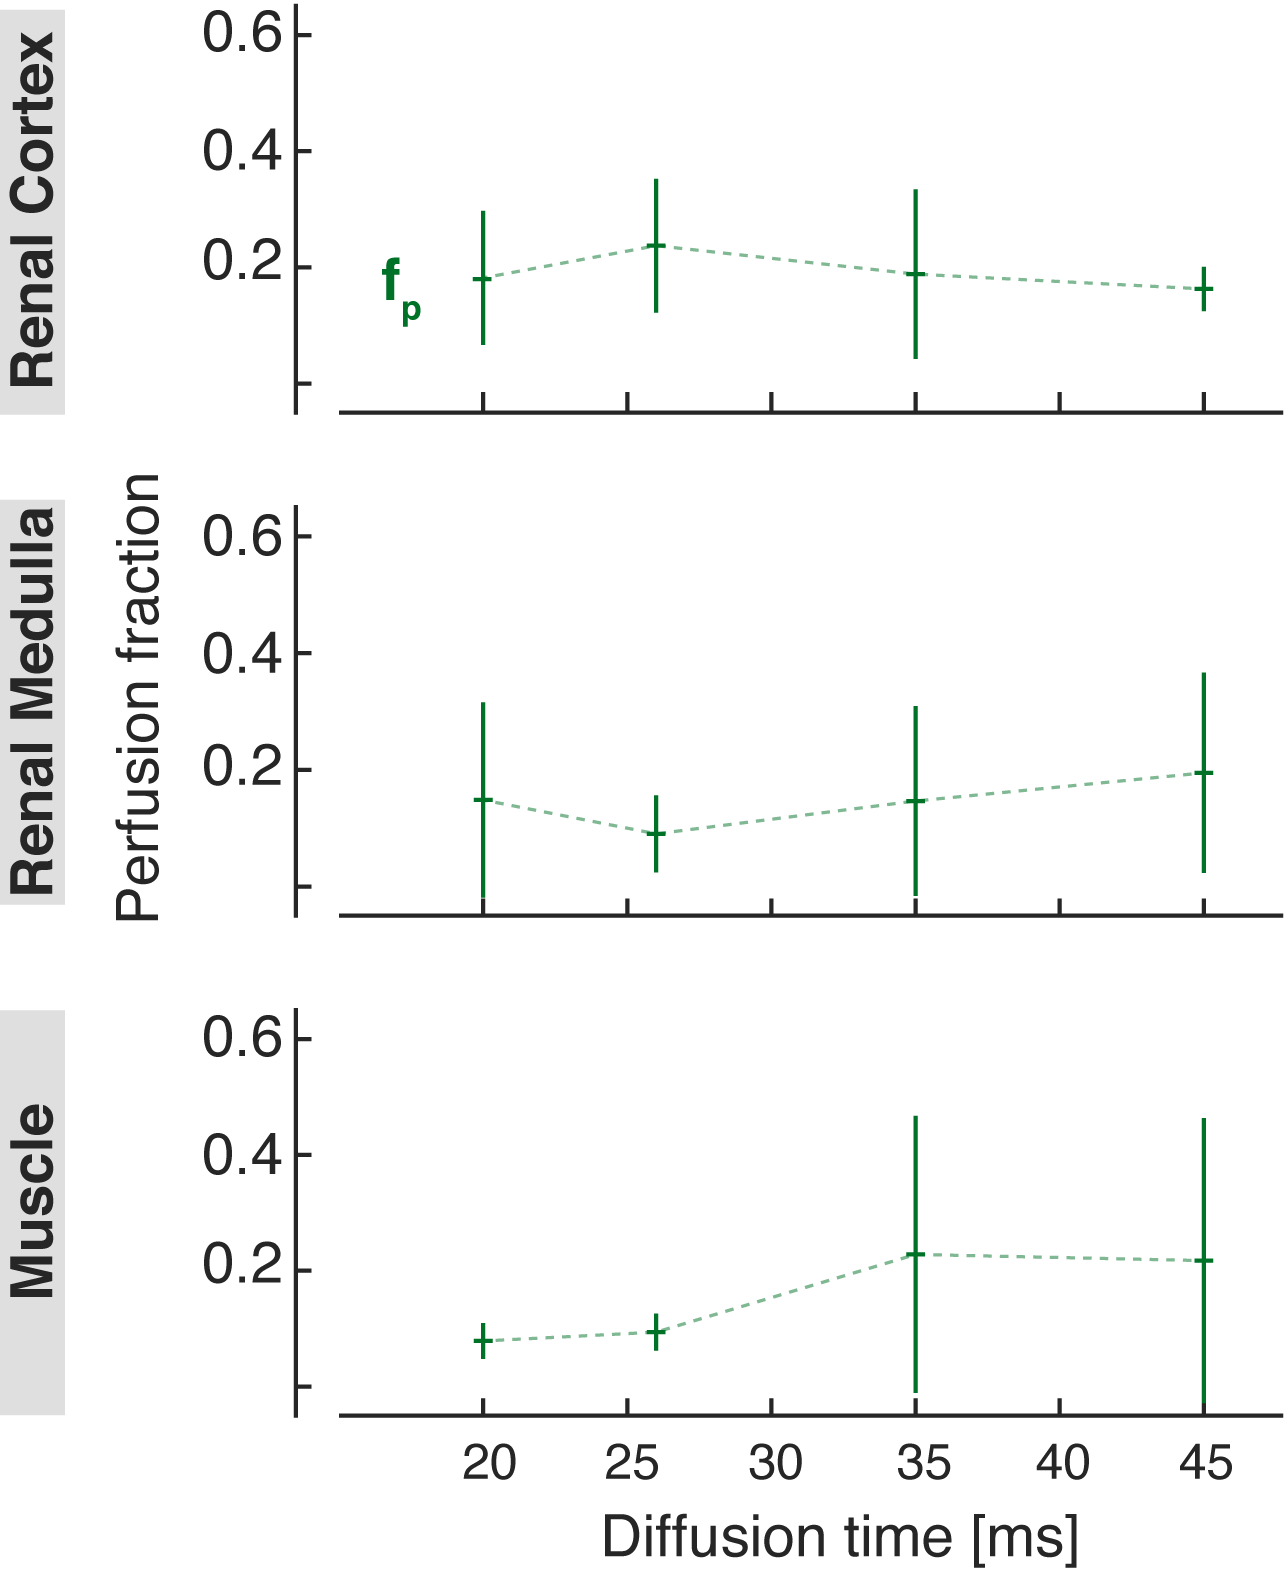
The ADC values measured both in the renal cortex and medulla increased slightly with diffusion time. An opposite trend can be observed in the skeletal muscle (Fig. 1). The diffusion coefficient D obtained from the IVIM analysis was lower than the ADC but showed similar dependence on diffusion time. In general, the IVIM-based pseudodiffusion coefficient D* was stronger influenced by the diffusion time than the ADC and D in the range used in this study. In fact, there was a substantial increase in D* between Δ = 20 ms and 35 ms in the renal cortex and medulla, and a strong decrease in the skeletal muscle. Comparing Δ = 35 ms to Δ = 45, D* decreased in the renal cortex but practically did not change in the kidney medulla and skeletal muscle. The cortical perfusion fraction fp was found to be lower in the diffusion time range above Δ = 26 ms, while the medullary fp was higher in the same range compared to Δ = 20 ms. In the muscle, fp increased with the diffusion time, especially going from Δ = 26 ms to Δ = 35 ms (Fig. 2).Discussion
Our results show that the ADC and IVIM-related diffusion parameters in the kidney are influenced by the diffusion time. In general, both ADC and IVIM-related diffusion coefficient D of renal cortex and medulla tend to slightly increase in the diffusion time range between 20 and 45 ms, as opposed to ADC and D of skeletal muscle. This observation can be explained by the different composition, organization, and vascularization of the two tissues.Furthermore, we found that the IVIM-based pseudodiffusion coefficient D* exhibits the strongest dependence on diffusion time among the investigated diffusion-related parameters. If the fast pool corresponds to the flowing fraction within tubuli (diameters between 20 and 50 µm8-11) and medium-sized blood vessels, the blood/urine flow is expected to be laminar. In this case, an additional phase dispersion DLF might contribute to the measured D* values especially at lower diffusion times. At higher diffusion, DLF is negligible and, therefore, a decrease in D* can be observed12.
These preliminary results should be validated in a larger cohort of healthy volunteers and using a tri-exponential IVIM model to account for a ‘true’ diffusion, an ultrafast and an intermediate component in the DW-MRI signal of the kidney.
Conclusion
The diffusion time dependence of IVIM-related diffusion parameters could potentially provide valuable information regarding the blood vessels and urine flow in the kidney.Acknowledgements
We acknowledge T. Feiweier, PhD, (Siemens Healthcare, Germany) for developing the WIP package for advanced EPI diffusion imaging.
The study was supported by a grant from the German Research Foundation (DFG).
References
- Caroli A, Schneider M, Friedli I, et al. Diffusion-weighted magnetic resonance Imaging to assess diffuse renal pathology: a systematic review and statement paper. Nephrol Dial Transplant. 2018;33:ii29-ii40.
- Harkins KD, Galons JP, Secomb TW, et al. Assessment of the effects of cellular tissue properties on ADC measurements by numerical simulation of water diffusion. Magn Reson Med. 2009;62(6):1414-1422.
- Sigmund EE, Novikov DS, Sui D, et al. Time-dependent diffusion in skeletal muscle with the random permeable barrier model (RPBM): application to normal controls and chronic exertional compartment syndrome patients. NMR Biomed. 2014;27:519–528.
- Li XM, Yang L, Reng, J. et al. Non-invasive evaluation of renal structure and function of healthy individuals with multiparametric MRI: Effects of sex and age. 2019; Sci Rep 9, 1066.
- Le Bihan D, Beton E, Lallemand D, et al. Separation of diffusion and perfusion in intravoxel incoherent motion MR imaging. Radiology. 1988;168:497–505.
- Wittsack HJ, Lanzman RS, Mathys C, et al. Statistical evaluation of diffusion-weighted imaging of the human kidney. Magn Reson Med. 2010;64:616–622.
- Yushkevich PA, Piven J, Hazlett HC, et al. User-guided 3D active contour segmentation of anatomical structures: Significantly improved efficiency and reliability NeuroImage. 2006;31:1116–1128.
- Tisher CC, Bulger RE, Trump BF. Human renal ultrastructure. I. Proximal tubule of healthy individuals. Lab Invest. 1966;15:1357–1394.
- Bulger RE, Tisher CC, Myers CH, et al. Human renal ultrastructure. II. The thin limb of Henle’s loop and the interstitium in healthy individuals. Lab Invest. 1967;16:124–141.
- Tisher CC, Bulger RE, Trump BF. Human renal ultrastructure. III. The distal tubule in healthy individuals. Lab Invest. 1968;18:655.
- Myers CH, Bulger RE, Tisher CC, et al. Human ultrastructure. IV. Collecting duct of healthy individuals. Lab Invest. 1966;15:1921.2.
- Fournet G, Li JR, Cerjanic AM, et al. A two-pool model to describe the IVIM cerebral perfusion. J Cereb Blood Flow Metab. 2017;37(8):2987-3000.
Figures