2503
Quantitative Comparison of 31P MRS Imaging Performances between 7T and 10.5T Human Scanners Using a Loop-dipole 31P-1H Probe
Xin Li1, Hannes M. Wiesner1, Matt Waks1, Xiao-Hong Zhu1, and Wei Chen1
1Center for magnetic Resonance Research (CMRR), Department of Radiology, University of Minnesota, Minneapolis, MN, United States
1Center for magnetic Resonance Research (CMRR), Department of Radiology, University of Minnesota, Minneapolis, MN, United States
Synopsis
In vivo 31P MRS imaging (MRSI) is important for studying cerebral energy metabolism, intracellular NAD and redox ratio. However, it is challenging to achieve high spatiotemporal resolution owing to limited 31P sensitivity and low phosphorus metabolites concentration. We had demonstrated that ultrahigh field (UHF) could significantly improve the 31P-MRS sensitivity and spectral resolution. In this study, we designed and constructed a loop-dipole 31P-1H probe, which could operate at 7T and 10.5T for quantitative comparison of 31P MRSI signal-to-noise ratio (SNR) between the two fields. We found that the apparent SNR at 10.5T was significantly higher than that of 7T.
Introduction
In vivo 31P MRS/MRSI detects various phosphorous metabolites involving ATP energy and phospholipid metabolisms and NAD redox state in human brain1-3. The abnormality observed in the 31P studies reflects brain diseases4-6. However, it is challenging to achieve high spatiotemporal resolution owing to a lower 31P γ ratio and very low phosphorus metabolites concentration. Previous studies7-8 have shown that increasing magnetic field strength (B0) can largely improve the 31P detection sensitivity and spectral resolution. However, the improvement depends on many factors including B0, RF coil quality factor (Q), the longitudinal relaxation time (T1) and the resonance linewidth (∆V1/2). In this work, we analyzed and compared the 31P-MRSI SNR between 7T and the world’s first 10.5T whole-body human scanner.Method
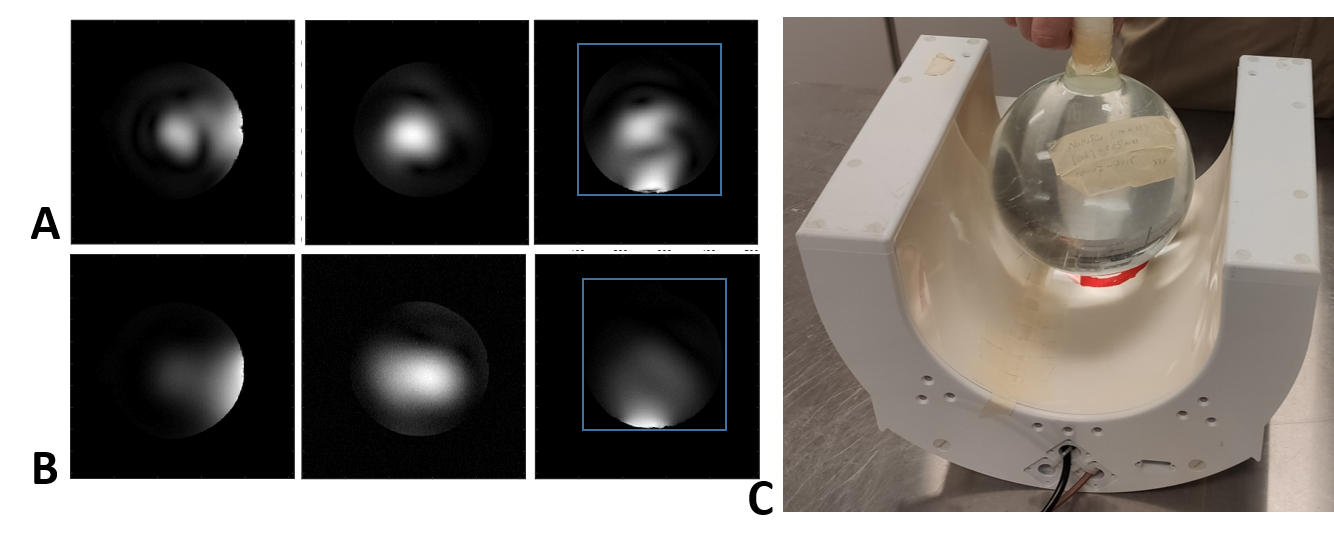
RF coil construction: We designed and constructed a loop-dipole 31P-1H probe with passive decoupling, which could be operated at 7T or 10.5T frequencies. As shown in Fig. 1A-B, the 31P loop coil has a 7.5cm outer diameter. The 1H dipole coil was located 2.5 cm away from the 31P loop coil plane. One matching circuit was used for the 31P loop coil, and two matching circuits for the 1H dipole coil. The coil Q factor was measured using -7dB from the 0dB baseline of the S11 plot as demonstrated in Fig. 1C-D.31P MRSI Experiment: The 31P MRSI experiments were performed on an inorganic phosphate (Pi) phantom (100mM, similar loading effect as human head and T1,Pi was approximately 300ms at 7T) on 7T and 10.5T human scanners (SIEMENS, Germany) using the dual-channel 31P-1H loop-dipole coil. Figure 2C shows the set-up of the loop-dipole coil loaded with the Pi phantom. B0 shimming was performed over an 8cm cube at the bottom of the phantom near the coil. Then, the 3D 31P chemical shift images (CSIs) with an array of voltages were acquired with an FOV of 15cm covering the entire phantom. At both field strengths, we used the same CSI parameters: TR=1500ms (fully relaxed condition), TE=0.5ms, excitation hard pulse length=500us, and spectral width=5000Hz.
SNR quantification: The 31P FID data from each CSI voxel was transformed to a spectrum with a 10Hz line broadening. As show on Fig. 3, for each CSI voxel, the Pi resonance intensities measured with different excitation voltages were fitted to a sine function. The peak intensity determined by the regression of the sine wave function at the flip angle of 90o presented the ultimate (or largest) Pi signal (SL) that could be achieved in a particular voxel. We selected 10 voxels from the similar location near the center of the coil sensitive region for both field strengths to calculate the mean SL values at 7T and 10.5T, respectively; and 8 voxels outside of the phantom acquired using zero excitation voltage (thus no Pi signal) to calculate the standard deviation of the noise. To obtain the ultimate SNR for a selected voxel, the SL value of each voxel was divided by the mean noise standard deviation.
Result
RF coil performance: As shown in Fig. 1 C-D, the 31P loop coil and 1H dipole coil were able to be tuned and matched to a S11 value of -15dB and -20dB, respectively, at both 7T and 10.5T. For both field strengths, the S12 between the loop and dipole coil was less than -20dB at the 31P resonant frequencies, showing an excellent decoupling between the 31P and 1H coils.SNR comparison between 7T and 10.5T: Figure 3 illustrates one example of sine function fitting to determine the SL value for a representative CSI voxel at 7T. Figure 4 shows the 31P SNR maps of three transversal slices at both field strengths. These SNR maps are overlaid with the 3D-CSI 31P spectra acquired using the excitation voltage approximately corresponding to the nominal 90° flip angle for the global FID signal. For the selected 10 voxels, the ratio of the SNRs measured at 10.5 T to 7 T was 1.5 ± 0.2 (see Table 1).
Discussion
This study reports quantitative sensitivity comparison result showing the SNR ratio (=1.5) of 31P MRSI imaged at 10.5T versus 7T (with a B0 ratio of 1.5), thus, an approximate linear relation to B0 consistent with previous reports7,8. The linewidth effect at both 7T and 10.5T were similar in this study, and the 1.5s TR allowed fully relaxed condition at least for 7T measurement. Therefore, we can have a 31P SNR ratio equation: SNR10.5T / SNR7T = (10.5/7)β Q0.5, resulting β =1.7 using the parameters listed in Table 1. This power dependence is slightly higher than previously reported work4 where β =1.4-1.5 were found in human brain at 4T and 7T.Conclusion
We report the first 10.5T study that investigated the B0 dependence of 31P MRSI sensitivity by quantitative comparison between 7T and 10.5T human scanners. The results suggest an approximately 50% SNR gain at 10.5T as compared to 7T. In considering the SNR gain and anticipated improvement of spectral resolution at 10.5T8, we expect significant improvements for in vivo 31P MRSI human brain application at 10.5T.Acknowledgements
This work was supported in part by the National Institutes of Health grant: U01 EB026978, R01CA24095 and P41 EB027061.References
- Lei H, et al. Proc Natl Acad Sci U S A 2003; 100:14409-14414.
- Du F, et al. Proc Natl Acad Sci U S A 2008;105:6409-6414.
- Zhu X, et al. Proc Natl Acad Sci U S A 2015; 112:2876-2881.
- Welch KM, et al. Neurol Clin. 1992; 10: 1–29.
- Hetherington HP, et al. J. Magn Reson Imaging 2002; 16: 477–483.
- Weiner MW, et al. Ann N. Y. Acad Sci 1987; 508: 287–299.
- Qiao H, et al. Magn Reson Imaging. 2006 Dec; 24(10): 1281–1286.
- Lu M, et al. NMR Biomed 2014; 27:1135-1141.
Figures
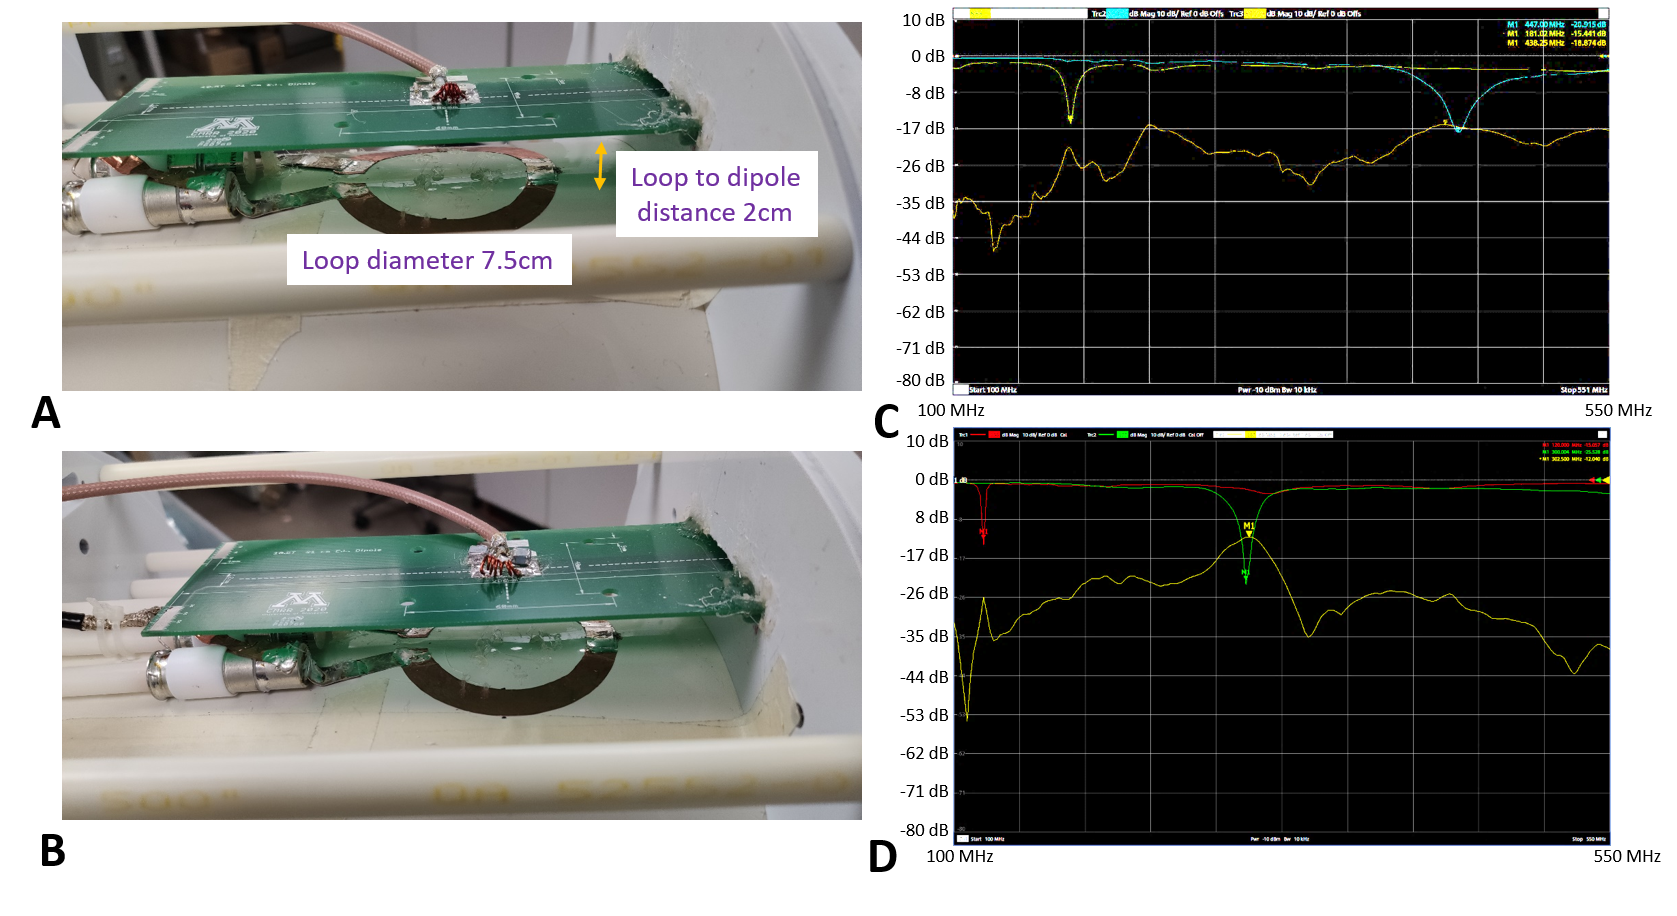
Figure 1. Prototype of (A) 10.5T and (B) 7T 31P-1H
loop-dipole probe featuring a printed 1H dipole coil on the top of a
7.5 cm diameter 31P loop coil with a 2cm gap between them. (C) The measurement results on network
analyzer showing S11 = -15.4dB at 181MHz (for 31P loop),
S22 = -20.9dB at 447MHz (for 1H dipole), and the maximum
coupling between the two coils is S12= -18.8dB at 10.5T.
(D) The measurement results showing S11 = -15.1dB at
120MHz (31P probe), S22 = -25.5dB at 300MHz (for 1H
dipole) and maximum coil coupling S12= -12.0dB at 7T.
Figure
2. The localizer images at (A) 10.5T and (B) 7T, respectively, in the sagittal,
coronal and transversal orientations. The blue box shows the 15cm FOV
selection. (C) The 31P-1H loop-dipole probe was loaded
with an inorganic phosphate (Pi) phantom.
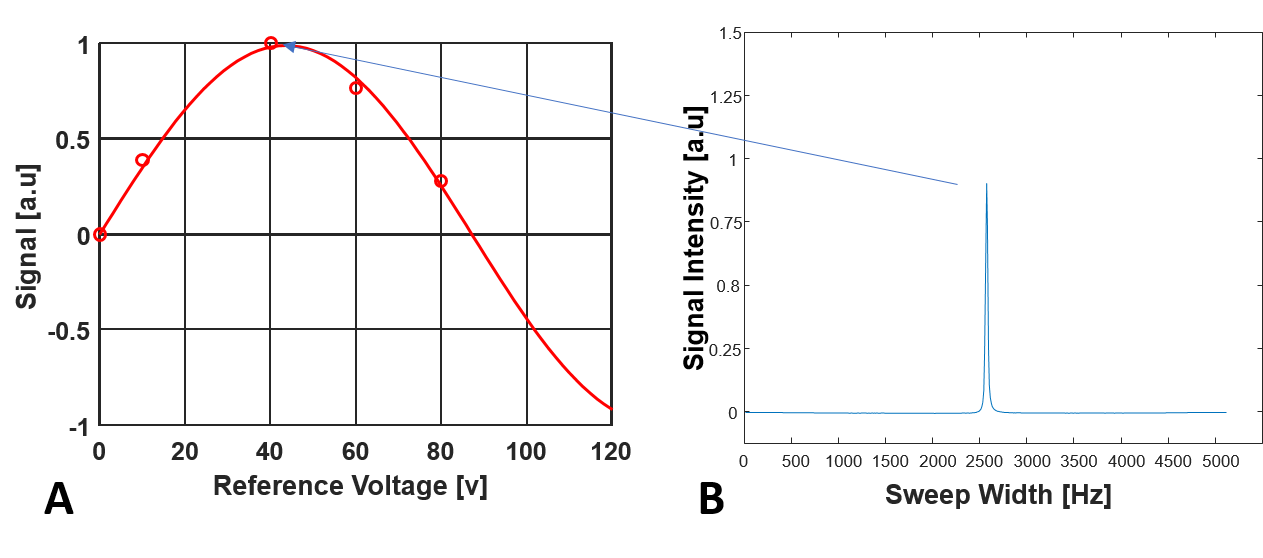
Figure
3. Illustration for determining the maximum Pi signal (SL) value for a selected CSI voxel. (A) For each
voxel, the Pi resonance intensities of multiple 31P spectra acquired
with varied RF pulse voltages were fitted with a sine function to determine the
SL at the 90o nominal flip angle (FA). (B) A
representative voxel 31P spectrum near the 90o nominal
FA, thus, with largest intensity.
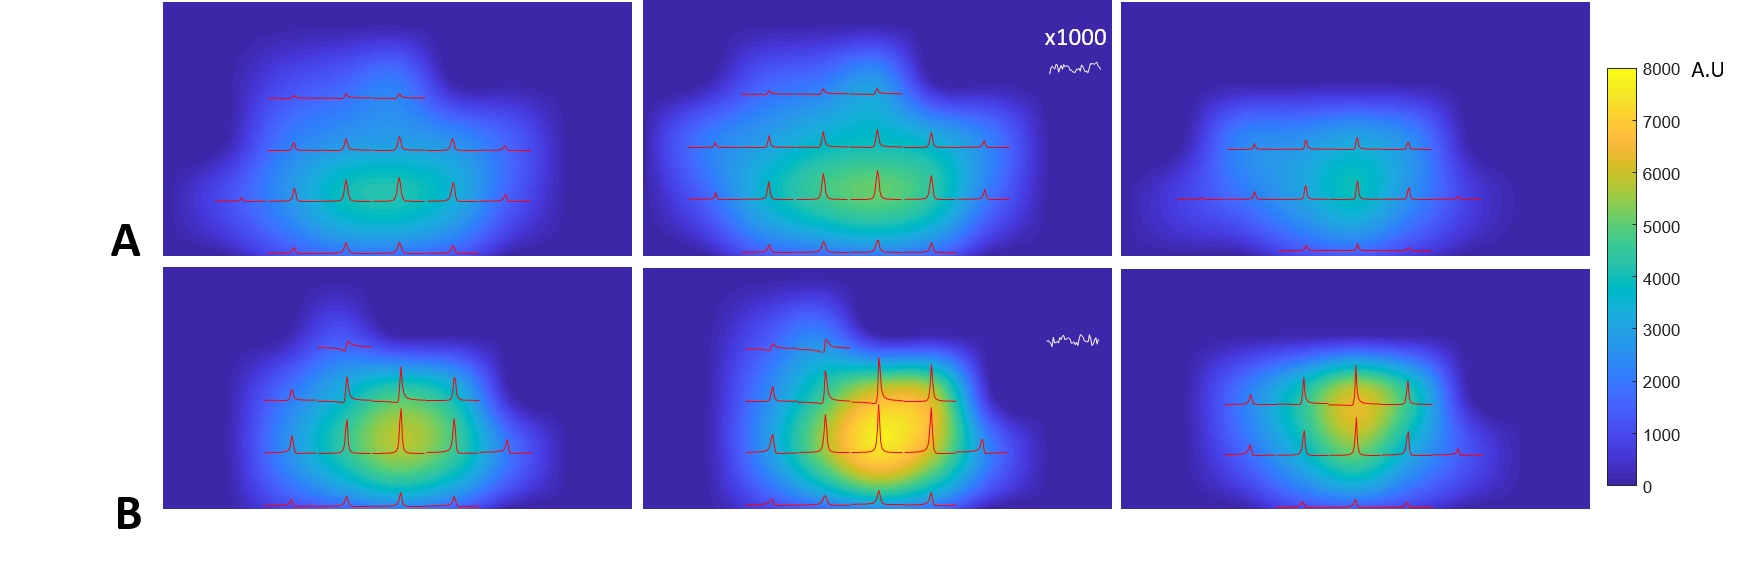
Figure 4. Three representative transversal slices of 31P
SNR maps of Pi acquired at (A) 7T and (B) 10.5T, overlaid with 2D CSI slice (extracted
from 3D data) acquired at the 90o nominal flip angle of the global Pi
signal. The noise level was zoomed in ×1000
times along the vertical scale. This figure clearly shows significant
improvement in spectral quality and SNR at 10.5T.
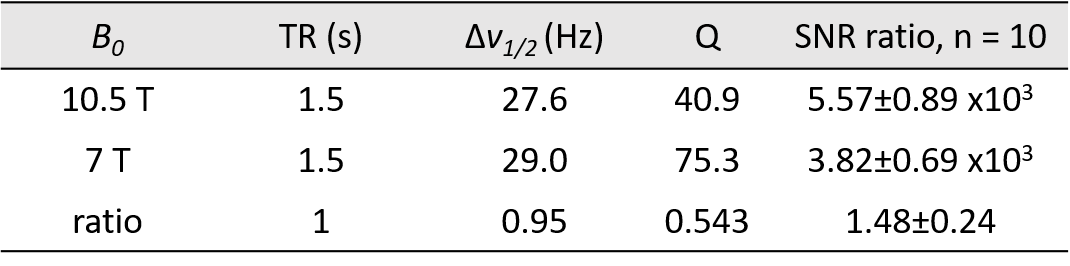
Table1. The parameters and their ratios measured at 7T and 10.5T and
used for quantification.