2501
SNR and B1+ Field Homogeneity of a Koch Fractal Geometry RF Surface Coil for 23Na-MRI1School of Biomedical Engineering, McMaster University, Hamilton, ON, Canada, 2Imaging Research Centre, St. Joseph's Healthcare, Hamilton, ON, Canada, 3Electrical and Computer Engineering, McMaster University, Hamilton, ON, Canada
Synopsis
There is an intrinsic lack of SNR in 23Na-MRI images compared to that of proton-based MRI. It is possible that RF coil geometry can affect the acquired images' SNR. This abstract is an investigation into the B1+ field characteristics of a Koch snowflake fractal RF surface coil to see if the produced field is more homogeneous than that of a standard circular surface coil which could lead to higher SNR in the resultant 23Na images. It was found that the circular geometry produced a more homogeneous field, along with higher SNR than the fractal coil.
Introduction
The biggest obstacle with 23Na-MRI is the inherent low signal-to-noise ratio (SNR) that is due to low in vivo concentrations, a low gyromagnetic ratio, and very short T2 relaxation times.1 These intrinsic characteristics necessitate prolonged scans with low resolutions compared to the proton MRI clinical standard. Improvements in pulse sequences and switching to higher magnetic field strengths are routes typically used to deal with these problems; however, there has been limited assessment of the radiofrequency (RF) coil designs being used at 3T. To maximize image quality the B1+ field needs to be as homogeneous as possible. Fractal antennas are used in telecommunication systems, generally exploited for their compact nature,2,3 but there may also be some benefit in implementing a fractal geometry in MRI RF coils to produce a more homogeneous B1+ field.2-6 Thus, we explored the 23Na-MRI B1+ field characteristics of a Koch snowflake fractal geometry RF surface coil and compared the fractal design to that of a standard circular geometry 23Na surface coil of the same diameter.Methods
Two surface coils of different geometries (circular and Koch fractal) were fabricated as copper etching on an FR4 substrate (Fig. 1). Both coils were tuned and matched on a 0.9% w/v saline phantom, to 33.8MHz/50Ω, the Larmor frequency of sodium at 3T. MRI experiments were run for each coil using a GE 3T MR750 MRI and the saline phantom. The following sequences were acquired: (i) 2D B1+ mapping sequence through 4 slices (1 sagittal, 3 coronal); and (ii) 3D radial sequence to assess SNR and image uniformity. The B1+ maps were analyzed by calculating the mean field strength and standard deviation over the region-of-interest (ROI) acquired, where the standard deviation was a representation of homogeneity. SNR was calculated (µsignal/σnoise) over 3 spherical and 2 cylindrical ROIs (Fig. 2). The 3D radial data was also used to produce a plot of how the signal behaves as the distance from the coil increases, as another metric to determine image (and therefore signal) homogeneity.Results
The resultant mean field strength and standard deviation from the B1+ maps of the circular coil (in µT) are (from Fig. 3A, 3C, 3E, 3G respectively): 26.91±10.99, 33.37±7.15, 25.96±9.30, and 29.73±12.19. The fractal coil values (from Fig. 3B, 3B, 3F, 3H respectively) are: 31.37±11.80, 31.82±7.61, 25.64±9.72, 30.00±13.18. It should be noted that the B1+ map of the final coronal slice (Fig. 3G & 3H) was mostly noise. The circular coil consistently had a lower standard deviation which correlates to a more homogeneous B1+ field over the respective maps. Table 1 shows the calculated SNR values for the five signal ROIs selected from the 3D radial data. The circular coil consistently had a higher SNR than that of the fractal coil. The final analysis was a plot of how the signal from each coil behaved with depth into the phantom (Fig. 4). The fractal coil signal decayed more rapidly (in space) than the circular coil as can be seen by the steeper sloped curve. The circular coil also had smaller signal variation at each depth than the fractal coil.Disscussion and Conclusion
All results indicate that the circular surface coil produces a more homogeneous B1+ field than the fractal surface coil, over the regions analyzed. The higher SNR of the circular coil aligns with expectations that the coil with a more homogeneous B1+ field would produce higher SNR images. While this result is opposite to our hypothesis, there are still potential benefits to a fractal coil that need to be explored such as spectral homogeneity over a wider bandwidth, which would be beneficial for imaging other nuclei with wide spectral bandwidths such as 13C.Acknowledgements
No acknowledgement found.References
1. Madelin G, Regatte RR. Biomedical applications of sodium MRI in vivo: Biomedical Applications of Sodium MRI. J Magn Reson Imaging. 2013;38(3):511-529. doi:10.1002/jmri.24168
2. Gianvittorio JP, Rahmat-Samii Y. Fractal Antennas: A Novel Antenna Miniaturization Technique, and Applications. IEEE Antenna’s and Propagation Magazine. 2002;44(1):20-36. doi:10.1109/74.997888
3. Cohen N. Fractal antenna applications in wireless telecommunications. In: Professional Program Proceedings. Electronic Industries Forum of New England. IEEE; 1997:43-49.
4. Ha S, Nalcioglu O, Roeck WW, inventors; Fractal RF Coils for Magnetic Resonance Imaging. US Patent US 2015/0048828 A1. February 19, 2015.
5. Dona Lemus OM, Konyer NB, Noseworthy MD. Micro-strip Surface Coils Using Fractal Geometry for 129Xe Lung Imaging Applications. In: Proceedings of the Joint Annual Meeting of ISMRM-ESMRMB, Paris, FR, 2018. Abstract No. 1713.
6. Nowikow CE, Konyer NB, Yazdanbakhsh P, Noseworthy MD. Koch Snowflake Fractal RF Surface Coils to Improve 23Na-Magnetic Resonance Imaging at 3T. In: Proceedings of the 36th Annual Scientific Meeting of ESMRMB, Rotterdam, NL, 2019. Abstract No. A-1449.
Figures
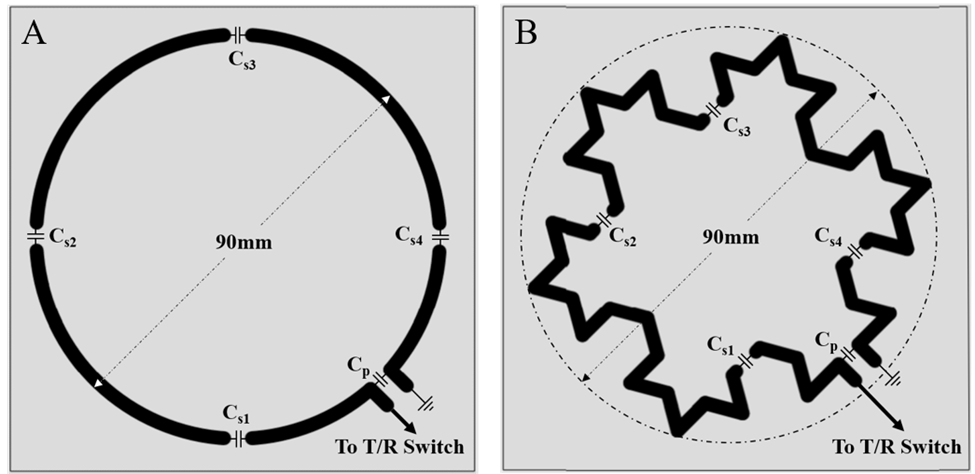
Figure 1: Surface coil geometry.
The geometry of the (A) circular, and (B) fractal coil. Each were copper etched on a 100x100mm FR4 substrate with breaks in loop for the tuning capacitors (Cs1-4) and the matching capacitor (Cp). One end of the loop for both coils was connected to the T/R switch via a coaxial cable while the other end of the loop was grounded using the same coaxial cable to form a one port network.
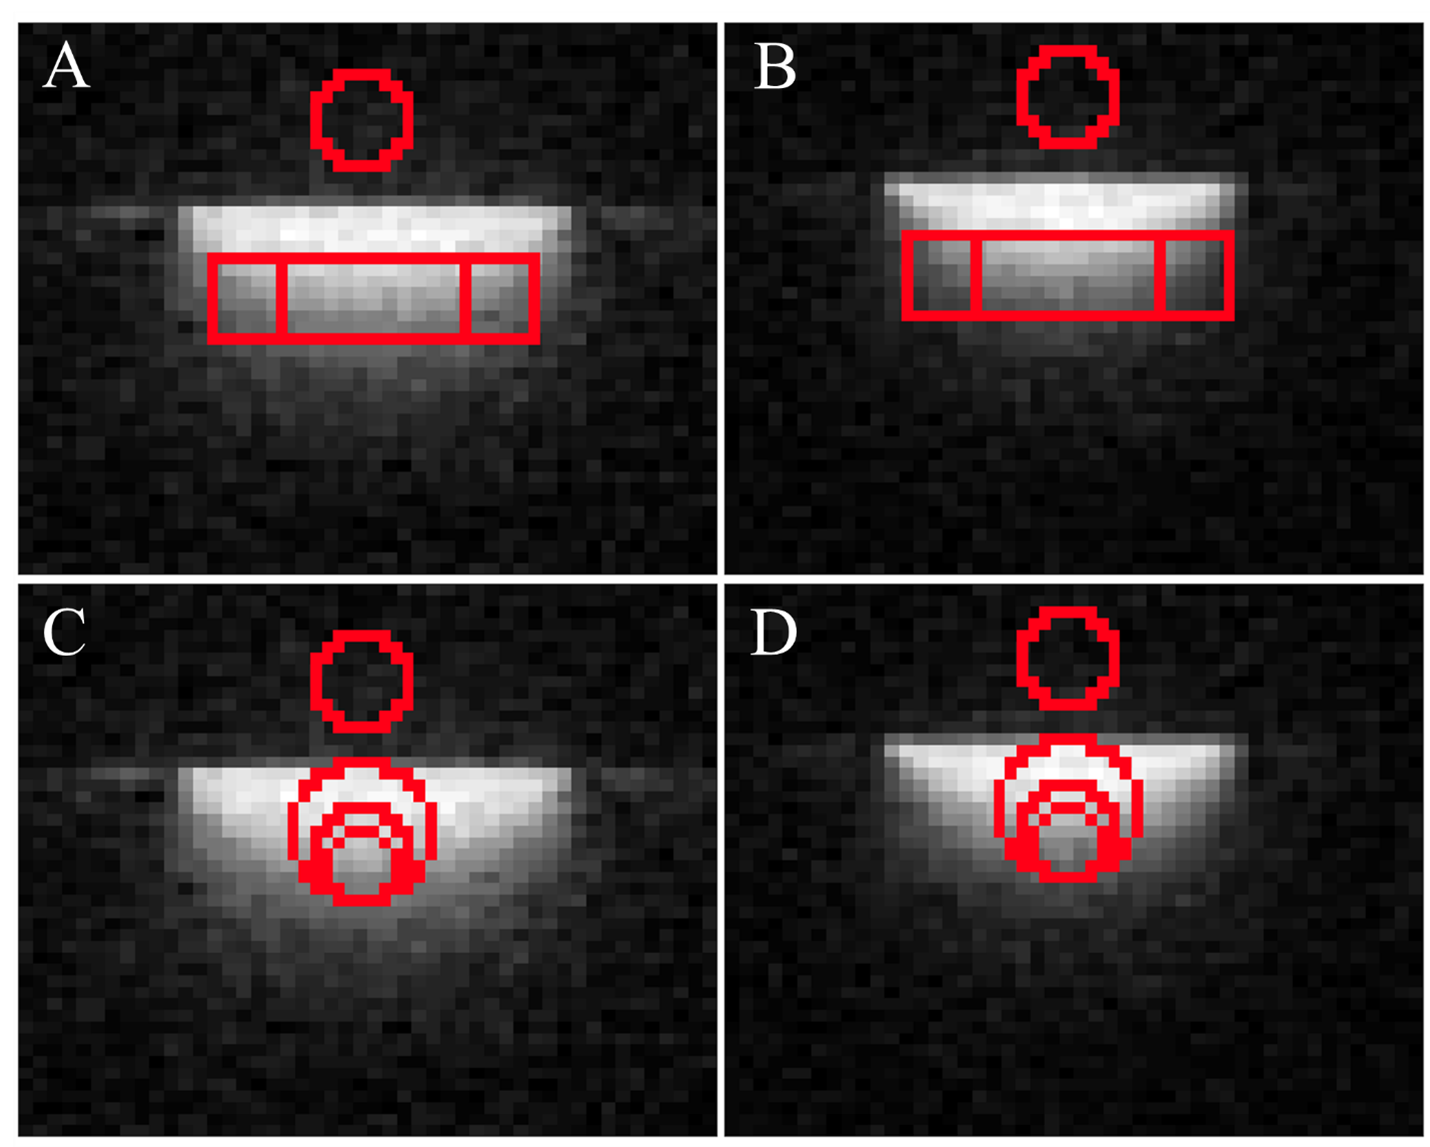
Figure 2: SNR ROIs.
The ROIs used for the homogeneity and SNR measurements using the 3D radial volume data of the (A,C) circular, and (B,D) fractal coil. A and B show the two cylindrical ROIs for each coil (25mm and 44mm in radius), and C and D show the three spherical ROIs for each coil (9mm, 12.5mm, and 18.75mm in radius). The spherical ROI above the coil shown in A-D is the noise region used in the SNR calculations.
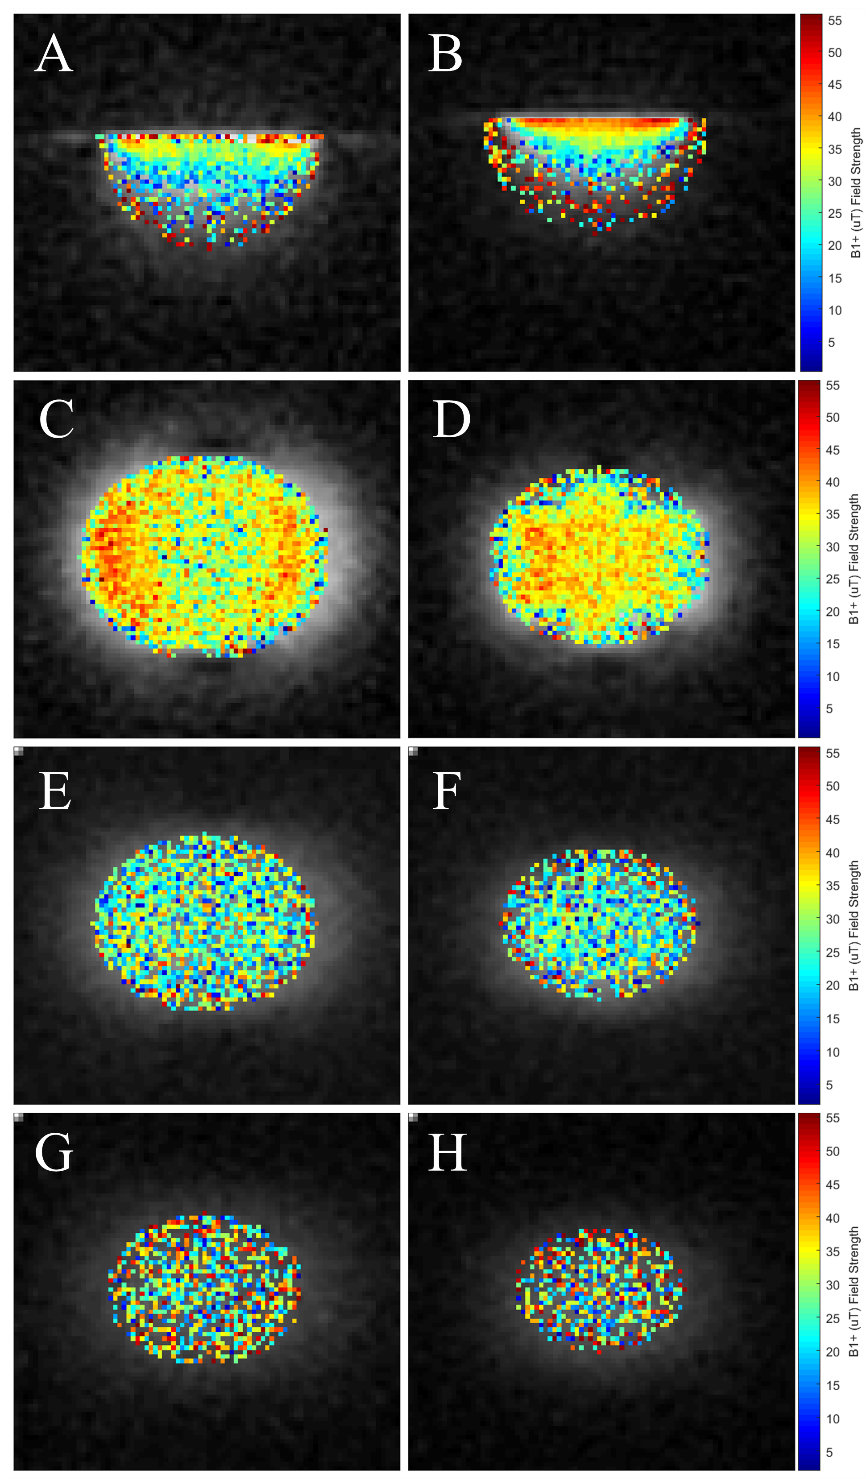
Figure 3: B1+ Field Maps.
The B1+ field maps for the (A,C,E,G) circular coil, and (B,D,F,H) fractal coil. A and B show the sagittal field map and C-H show the three coronal maps which are slice centered at depths of (C,D) 15mm, (E,F) 25mm, and (G,H) 35mm.
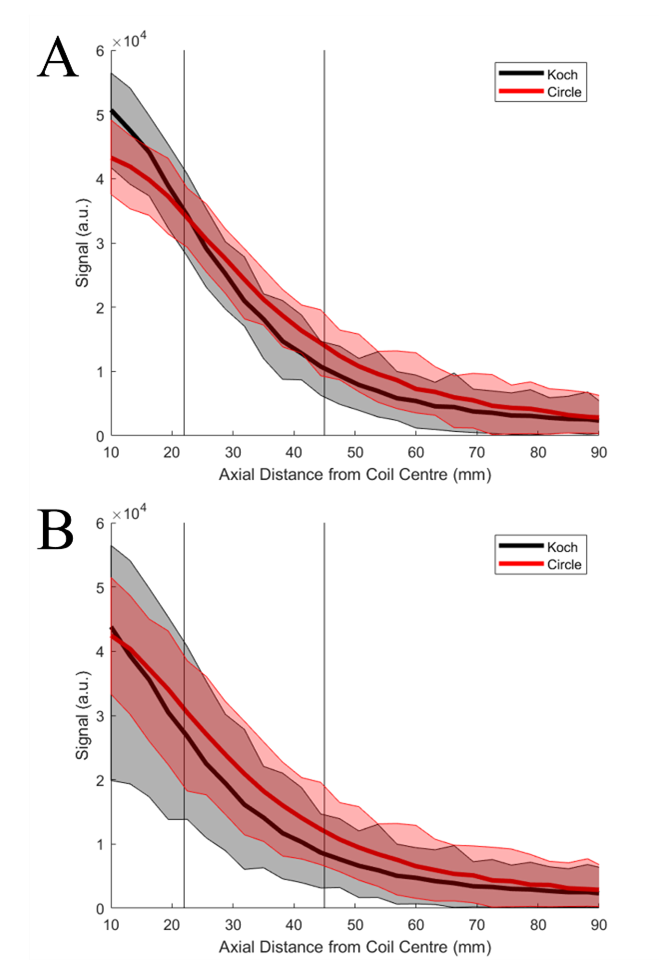
Figure 4: Signal Strength as a Function of Distance from the Coil.
The two plots show the mean field strength over a circular ROI of (A) radius 25mm, and (B) radius 45mm, as the ROI moves away from the coil plane, deeper into the phantom. The mean is represented by the bold curves in red and black, and the lighter bands in pink and grey that encompass the curves represent the range of signal values over the ROI at each distance from the coil.
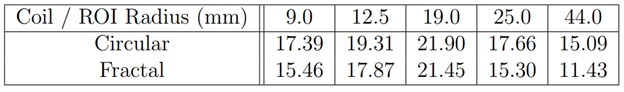
Table 1: SNR Calculations.
The SNR values for each ROI shown in Figure 2. The first three ROIs in the table are the spherical ROIs, the last two are the cylindrical ROIs.