2497
Signal-to-noise-ratio gain and in vivo application of a 13C cryo-coil for hyperpolarized MRSI
Luca Nagel1, Geoffrey J. Topping1, and Franz Schilling1
1Department of Nuclear Medicine, Technical University of Munich, School of Medicine, Klinikum rechts der Isar, Munich, Germany
1Department of Nuclear Medicine, Technical University of Munich, School of Medicine, Klinikum rechts der Isar, Munich, Germany
Synopsis
Cryogenically cooled transmit/receive
radiofrequency coils (cryocoils) improve the signal-to-noise ratio (SNR) compared
to conventional RF coils by minimizing thermal coil noise. The SNR of a cryoprobe, a surface coil at
room temperature and a volume coil was assessed using chemical shift imaging of
a 13C-urea phantom. Using the
cryocoil an SNR improvement up to a factor of 10 compared to
conventional coils was observed. In addition, a proof-of-concept in vivo
experiment using the 13C-cryocoil for detection of the metabolic
turnover of hyperpolarized 13C-pyruvate was successfully performed.
Introduction
Hyperpolarized 13C magnetic resonace spectroscopic imaging (MRSI) is a powerful tool to study the metabolism of tumors1, hearts2 and other organs3. By hyperpolarization, the intrinsically low sensitivity of 13C-detection can be temporarily increased by a factor4 of 104 up to 105. Cryocoils minimize the intrinsic coil noise and promise an additional SNR gain of up to 10 compared to conventional room temperature coils5 which can be exploited to improve spectral quality and allows the usage of lower flipangles to preserve hyperpolarized magnetization.Methods
The SNR of different coils was assessed using free induction decay (FID) chemical shift imaging (CSI) of a 13C-urea phantom.Phantom: In vitro experiments were carried out with a 50ml Falcon Tube, containing 1.8M 13C-urea and 50mM DOTAREMTM.
Animal: The in vivo experiment was carried out in a healthy mouse. Hyperpolarization was performed in a HyperSense DNP polarizer (Oxford Instruments). 300ml of 80mM hyperpolarized [1-13C]pyruvate were injected.
Imaging System
The experiment was carried out on a 7T small animal MRI Scanner (Agilent/GE/Bruker).
The RF coils used were:
- A 13C transmit-receive quadrature 20mm CryoProbeTM (Bruker) with cryogenically cooled preamplifier, cooled with gaseous helium to approximately 30K/77K (coil/preamplifier) in combination with a 1H 86mm volume resonator (Bruker).
- A 1H/13C double-resonant transmit-receive 20mm surface coil (Bruker) at room temperature.
- A 1H/13C dual-tuned dual-quadrature 31mm volume coil (Rapid Biomedical) at room temperature.
Phantom: Imaging Parameters for the 2D CSI were FOV 32x32mm2, imaging matrix 16x16, slice thickness 2mm, voxel size 2mm3, TR 200ms, TE 1.258ms, spectral bandwidth 6009.6Hz, 1024 acquisition points which yields a spectral resolution of 5.87Hz and repetitions 25.
For excitation, a Shinnar-Le Roux (SLR) pulse with 90° flipangle, 0.84ms duration and 5kHz bandwidth was used.
Animal: Time resolved 2D CSI was performed. A 3mm slice with 28x16mm2 FOV (14x8 imaging matrix, 80 spectral points) was placed on the kidneys and a a spectroscopic image was acquired every 4.71s (TR 42.8ms). The excitation power was set to give a flipangle of 5˚ in the center of the right kidney.
B1 Mapping
B1 mapping was performed for each coil by repeatedly acquiring FLASH images with 30 different RF powers. In each voxel, the RF-dependent complex signal S was fit
$$S(RF_{power}) = A \cdot sin(\frac{\pi}{p} \cdot RF_{power}) $$
with A $$$\in \mathbb{C}$$$. A 90° flipangle is then reached with $$$RF_{power} = \frac{p^2}{4} $$$.
SNR Calculations
The SNR in each voxel was calculated by averaging the peak height in the magnitude spectrum over the 25 repetitions and dividing by the standard deviation (std) of a Rician distribution fit to 400 points in the noise region.
$$ SNR = \frac{mean(signal)}{std(noise)}$$
Cryocoil vs. standard surface coil: The SNR ratio map was calculated by dividing coil SNR maps. To fairly compare the SNR between coils, images with RF powers that gave similar excitation profiles were chosen.
Cryocoil vs. volume coil: The SNR ratio map was calculated by dividing the SNRs separately for each voxel. To compensate for the inhomogenous excitation B1-profile of the cryocoil, in each voxel the acquisition with RF power that yielded the highest signal was chosen.
Results
Cryocoil vs. standard surface coil:The normalized signal profiles for both coils are similar (Fig. 2abc). The cryocoil provides an SNR gain (SNR ratio >1) in the whole phantom (Fig. 2i), around 5-8 up to 16mm away from the surface of the coils (Fig. 2i) and 6-7 around 2-4mm away from the coil (a suitable distance for mouse subcutaneous tumor studies, Fig. 2f).Cryocoil vs. volume coil: The cryocoil provides an SNR gain (SNR ratio >1) up to 14.5mm (Fig. 3e), peaking at 10 close to the surface, and 6-8 around 2-4mm away from the coil (Fig. 3e). Within the RF power limits of the cryocoil, a 90° tipangle excitation can be reached up to 8mm into the phantom when using a SLR pulse of 0.84ms and 5kHz bandwith (Fig. 3e).
In vivo experiment: 13C-pyruvate and 13C-lactate signal are detected after injection, increased conversion of 13C-pyruvate to 13C-lactate can be observed in the kidneys. Signal can be observed above the noise for around 70s (pyruvate) and 100s (lactate).
Discussion
A fair comparison of sensitiy gain between volume and surface coils is difficult due to the difference in their excitation profile. The use of B1-inhomogeneity insensitive adiabatic half passage RF pulses could help to overcome this problem. The hyperpolarized in vivo study shows high signal in the regions of interest close to the coil.Conclusion
The use of a cryogenically cooled coil improves the SNR compared to both standard surface coils and volume coils up to a factor of 8 and 10, respectively. A proof-of-concept hyperpolarized in vivo MRSI study was performed that shows that localized determination of metabolism at relatively high signal is achieved with a cryocoil. The gain in SNR of a cryocoil could be used to increase spatial resolution, shorten acquisition time or acquire higher SNR spectra in SNR-limited and signal-constrained hyperpolarized 13C MRSI.Acknowledgements
This project has received funding from the European Union’s Horizon 2020 research and innovation programme under grant agreement No 820374. The authors thank Sandra Sühnel for the help with the animal study.References
- Day S, Kettunen M, Gallagher, F, et al. Detecting tumor response to treatment using hyperpolarized 13 C magnetic resonance imaging and spectroscopy. Nature medicine. 2007;13(11):1382-1387.
- Golman K, Petersson J, Magnusson P, et al. Cardiac metabolism measured noninvasively by hyperpolarized 13C MRI. Magnetic Resonance in Medicine. 2008;59(5):1005-1013.
- Düwel S, Hundshammer C, Gersch M, et al. Imaging of pH in vivo using hyperpolarized 13 C-labelled zymonic acid. Nature communications. 2017;8(1):1-9.
- Ardenkjær-Larsen J, Fridlund B, Gram A, et al. Increase in signal-to-noise ratio of> 10,000 times in liquid-state NMR. Proceedings of the National Academy of Sciences. 2003;100(18):10158-10163.
- Sack M, Wetterling F, Sartorius A, et al. Signal‐to‐noise ratio of a mouse brain 13C CryoProbe™ system in comparison with room temperature coils: spectroscopic phantom and in vivo results. NMR in Biomedicine. 2014;27(6):709-715.
Figures
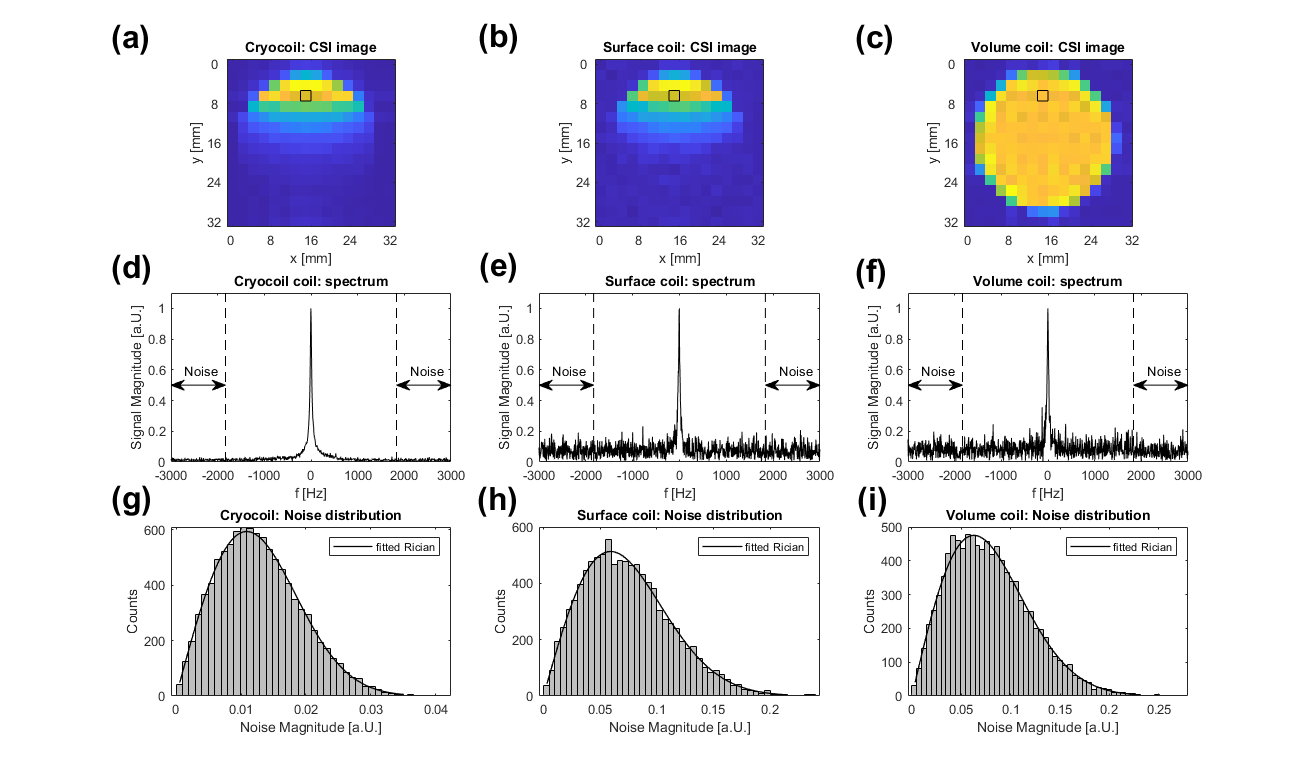
Figure 1: CSI images of the
thermal 13C Urea phantom (a, cryocoil), (b, surface coil) and (c,
volume coil). It can be seen that both surface coils suffer from an inhomogeneous
transmit and receive profile. (d), (e) and (f) show spectra from the voxel
indicated by the black box in the above images. The spectral range indicated
by the arrows was used for the calculation of noise distribution. (g), (h) and
(i) show the the Rician noise distribution from the range indicated in the
above spectra.
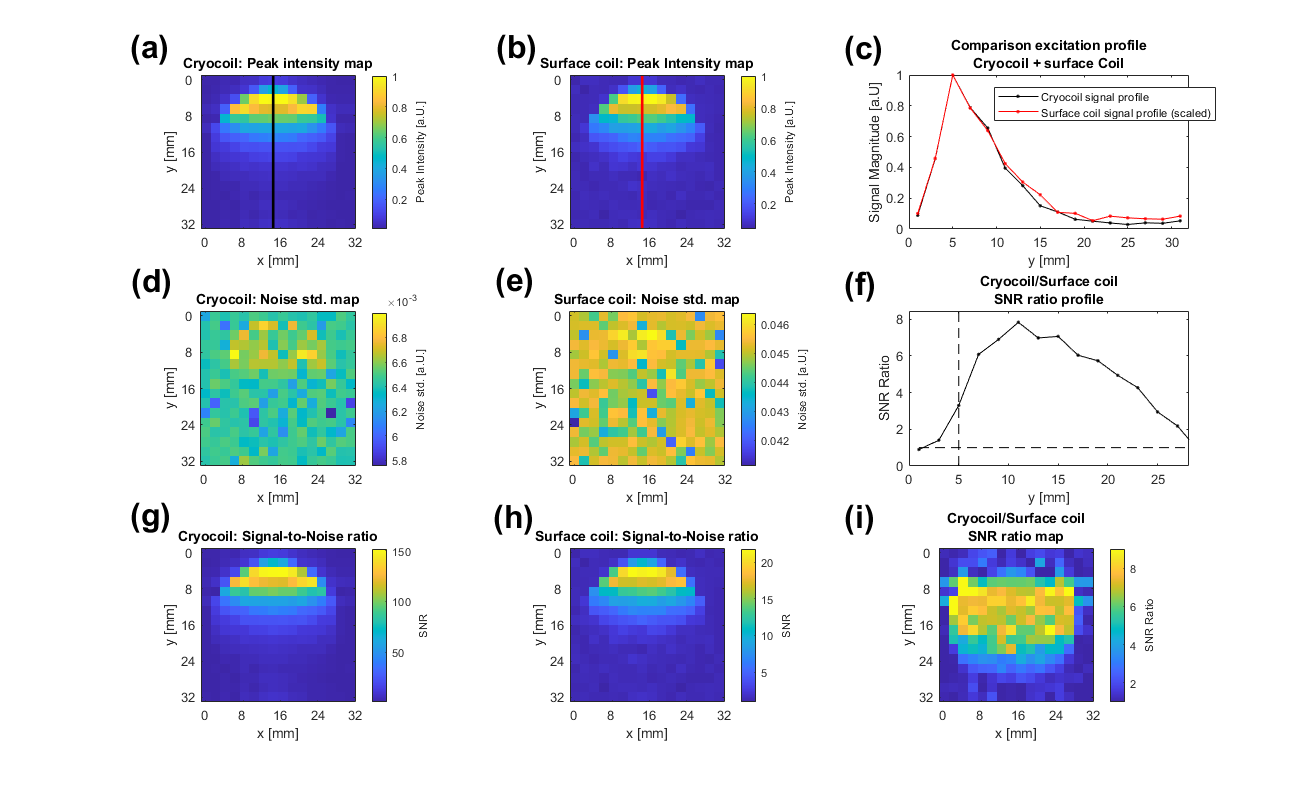
Figure 2: The peak intensity
maps for the cryocoil (a) and surface coil (b) at RF powers that yield similar
excitation profiles for both coils(c). (d) and (e) show an example of the noise
maps, which were determined by fitting a Rician distribution to the noise
region shown in Fig.1. The SNR ratio along the lines in (a) and (b) is shown in
(f). (g) and (h) show the calculated SNR maps of the cryocoil and the surface coil. In (i), the ratio of the two SNR maps is shown.
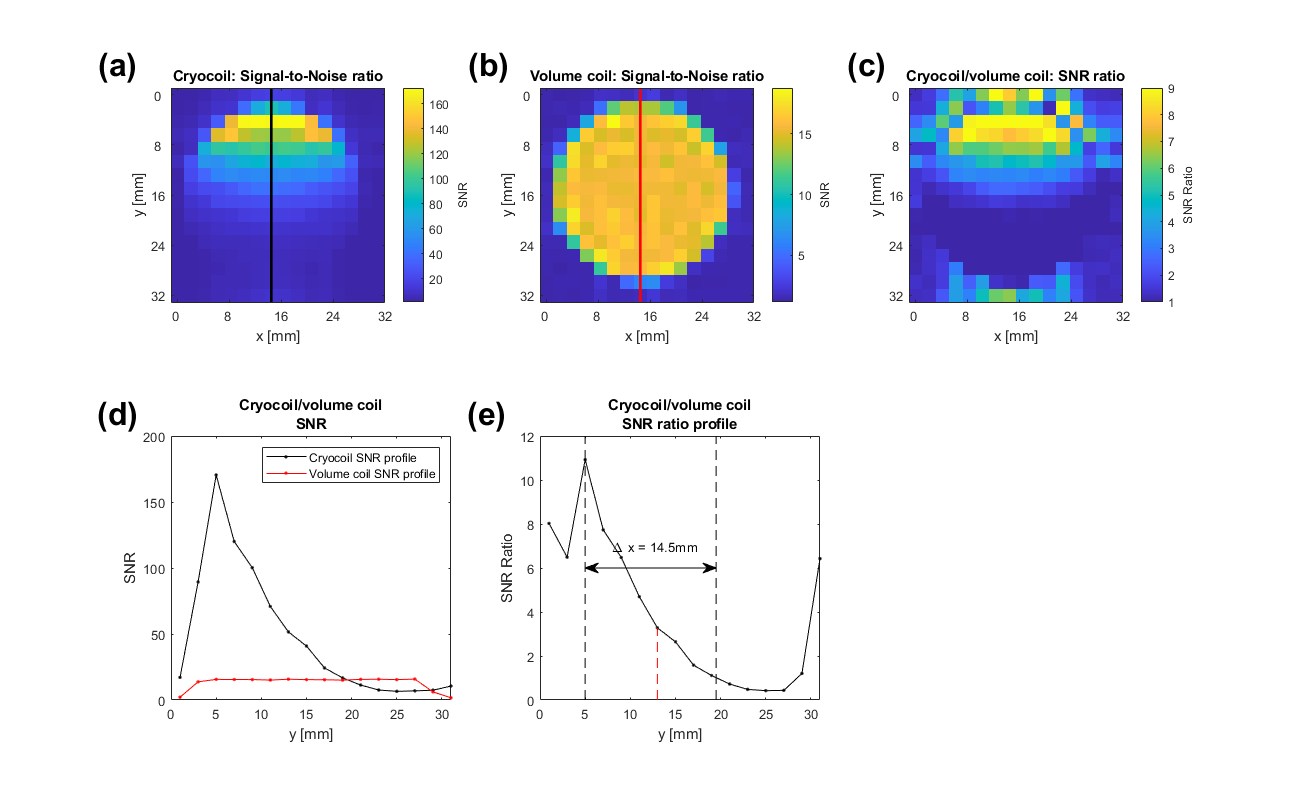
Figure 3: (a) cryocoil SNR map
where in each voxel the RF power was chosen that gives the highest signal in
that voxel. (b) SNR map of the volume coil. (c) shows the ratio of the
cryocoil SNR and the volume coil SNR. The SNR of the cryocoil (black) and the surface coil (red) along the black/red lines (a), (b) is shown in (d). An SNR
gain (SNR Ratio >1) is achieved up to 14.5mm away from the coil (e). The
dashed red line indicates up to where a 90°
excitation was possible with the cryocoil.
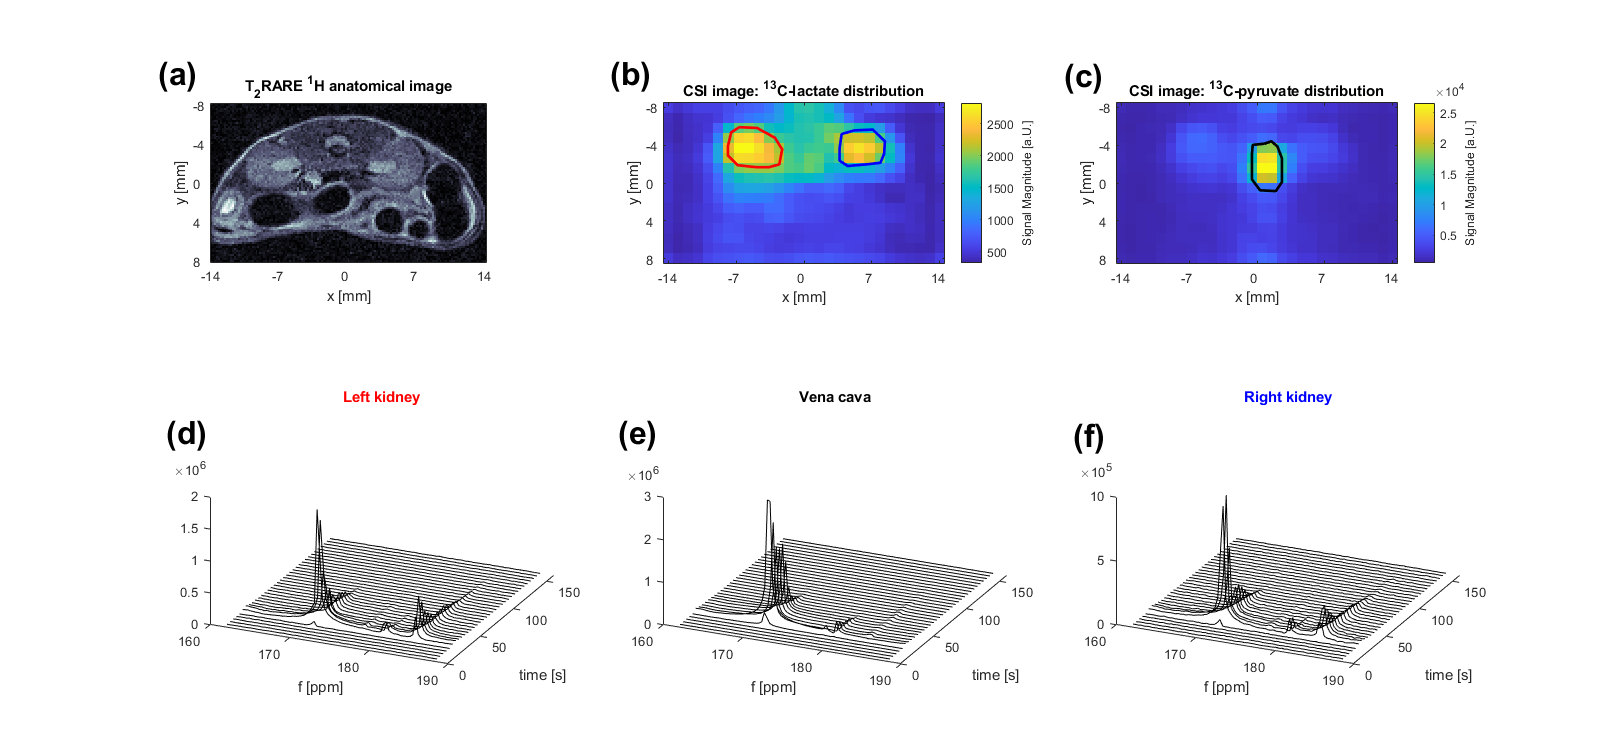
Figure 4: First in vivo study with the 13C cryocoil. (a) shows an axial 1H anatomical image of the mouse. (b) and (c)
show the time-averaged [1-13C] (183ppm) lactate and [1-13C]
pyruvate (171ppm) distributions in the mouse. (d) shows the time-resolved
spectra from the ROIs drawn in (c, n = 8) and (b, left kidney n = 16, right
kidney n = 12 ). Elevated
pyruvate-to-lactate exchange in the kidneys can be see in the intensity
distributions (b) and (c) and in the time resolved spectra (d), (f).