2494
RF Safety Assessment of High Permittivity Dielectric Pads - Impact of Material Insulation1Leiden University Medical Center, Leiden, Netherlands, 2Circuits and Systems, dept. of Microelectronics, Delft University of Technology, Delft, Netherlands, 3C.J. Gorter Center, dept. of Radiology, Leiden University Medical Center, Leiden, Netherlands
Synopsis
High permittivity dielectric pads are known to be effective for tailoring the RF field and improving image quality in high field MRI systems. Despite the number of studies reporting benign SAR effects, their safety remains a concern and should be evaluated on an application-specific basis using RF simulations. In this work we demonstrate the impact of insulation material on the RF safety of high permittivity pads, using both RF simulations as well as phantom experiments.
Introduction
High permittivity dielectric pads have been demonstrated to be safe and effective in addressing RF nonuniformity at high fields.1-4 The use of dielectric pads allows to manipulate the underlying interferences and improve corresponding artefacts.5 This approach continuous to gain interest with the FDA approval for clinical use of 7T in single transmit mode, where image shading in the temporal lobes can be substantially improved using high permittivity pads.3 High permittivity materials have further been shown to improve B1+ homogeneity and reduce local SAR in body imaging applications at 3T.6–9As with the development of custom RF coils, each application of high permittivity pads warrants a dedicated RF safety analysis using RF simulations. Despite the number of publications reporting benign SAR effects, the ‘universal’ safety of high permittivity pads remains an open point of concern. In particular, the stark contrast in permittivity with respect to body tissues, and corresponding jumps in the normal electric field component, have previously been raised as a concern with potential increases in local SAR close to the pad.10 It is not yet clear however, what mechanism causes these effects and under what conditions, nor whether these concerns are valid in the context of MRI.
In this work we evaluate the effects of material insulation on the RF safety of high permittivity dielectric pads, and extend the simulated analyses with an experimental characterization including MR thermometry in a phantom at 3T.
Methods
Configuration: The study was guided by a 3T body imaging scenario where a high permittivity pad was positioned at the anterior side of the body model ‘Duke’.11 The effects of the high permittivity pad were evaluated when either electrically insulated or in direct contact with the human body model.Electromagnetic simulations: The B1+ efficiency with respect to input power and 10g-averaged SAR distribution (SAR10g) in a high pass quadrature birdcage body coil (diameter: 61-cm, length: 50 cm) were simulated using Remcom XFdtd. The simulation grid was set to a spatial resolution of 2 mm within the RF coil. The SAR averaging procedure excluded the high permittivity pad in order not to bias potential local field enhancements close to the material.
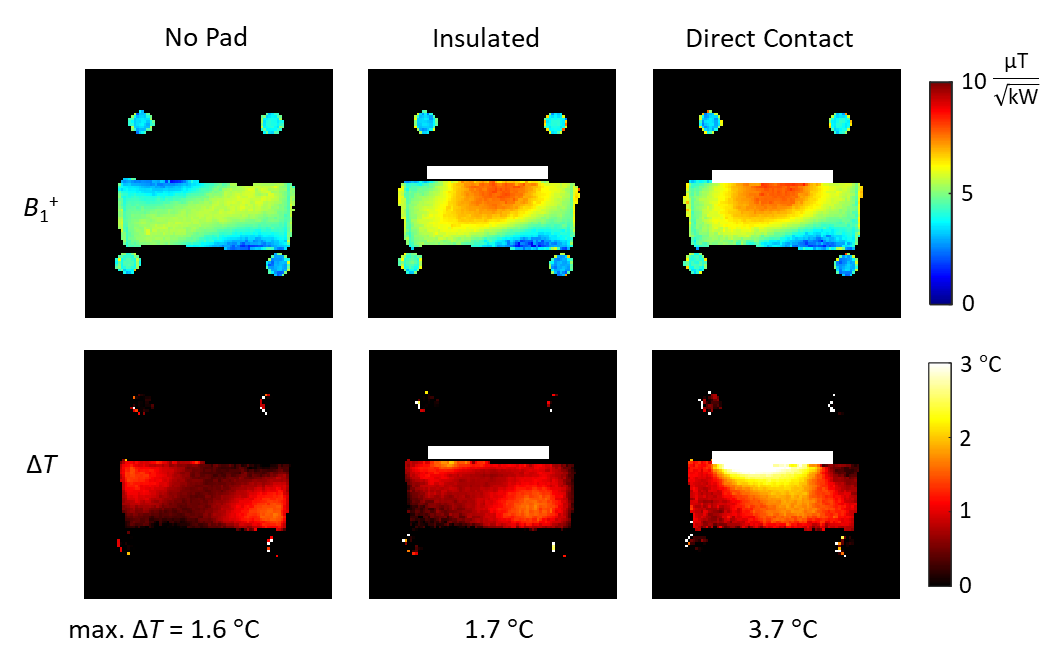
Phantom experiment: Experimental RF characterization was performed in a rectangular phantom filled with an aqueous solution of polyvinylpyrrolidone (PVP-10) to establish dielectric properties similar to the human body (εr = 48 and σ = 0.50 S/m).12 The material was gelled using 1% agarose to reduce thermal convection. A dielectric pad of size 18×18×1.5 cm was constructed using a 5:1 (weight ratio) suspension of BaTiO3 powder in demineralized water, which resulted in dielectric properties of εr = 307 and σ = 0.16 S/m.6 The material was heat-sealed in polypropylene (εr ≈ 2.5, ρ ≈ 108 Ω∙cm) of approximately 300 µm thickness.
MR Protocol: The phantom experiment involved B1+ mapping using DREAM13 and MR thermometry via the PRF method14 using a 20 min. dynamic series of 3D gradient echo acquisitions. A preparation module consisting of a 100 kHz off-resonance block RF pulse was added to increase the average RF power of the sequence to 200W without interfering with image acquisition. Mineral oil phantoms were added to the setup to perform bias field correction.14 The experiments were first performed without and with the pad positioned on top of the phantom. The polypropylene insulation was then removed from the pad and the protocol repeated.
Results
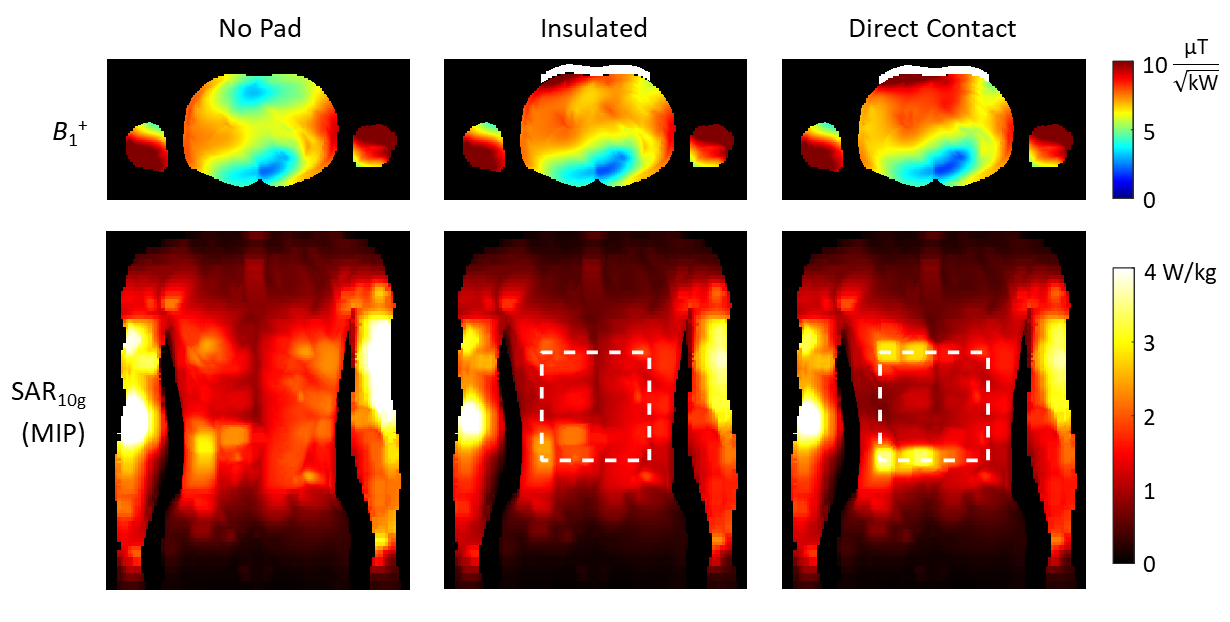
Figure 1 shows simulated transverse B1+ fields and SAR10g maximum intensity projections simulated in the Duke body model with the high permittivity pad positioned on the anterior side of the body model, either with a 2-mm insulation layer or in direct contact.Figure 2 shows transverse B1+ and MR thermometry measurements in the phantom, with the high permittivity pad positioned first with insulation present and then in direct contact with the phantom material.
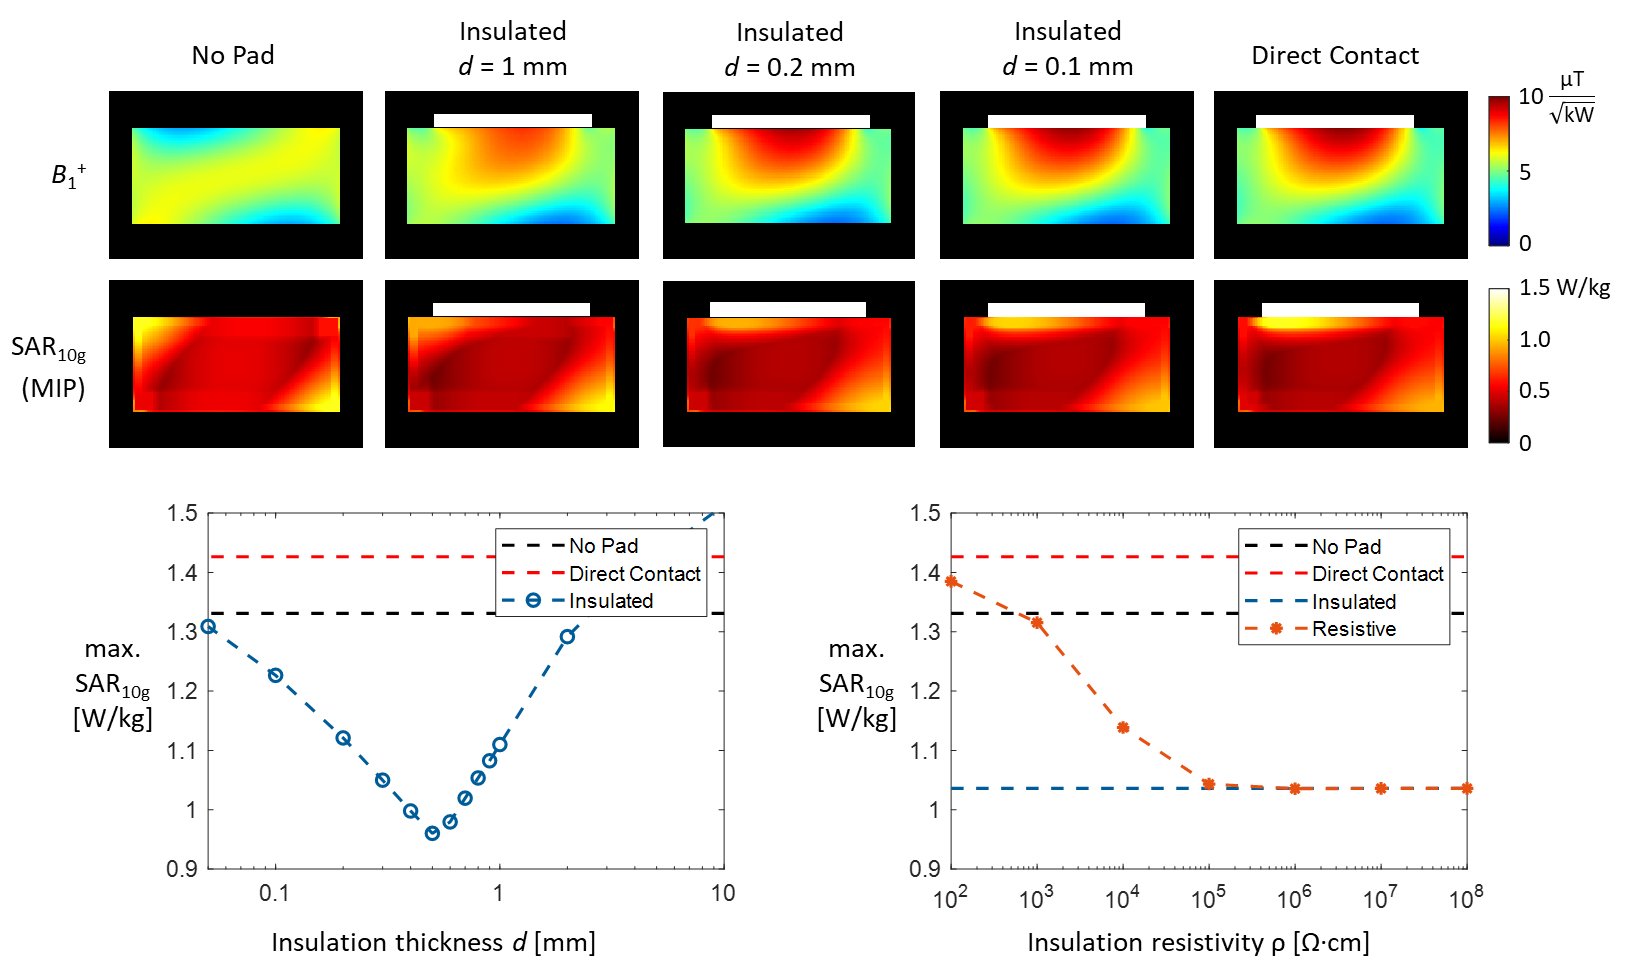
Figure 3 shows simulated effects of different insulation properties such as the polypropylene thickness and resistivity on the RF field. The local mesh around the interface was refined up to 50 µm to ensure accurate modelling of the insulation layer in all configurations.
Discussion and Conclusion
This study demonstrates that a realistic RF safety assessment of high permittivity pads requires accounting for the insulating materials present in between the high permittivity material and the body. The results also suggest that the use of high permittivity materials without any insulation may results in substantial increases in local SAR, and should therefore be carefully evaluated prior to application in vivo. Conversely, the effect of the insulation on the B1+ field is negligible, which suggests that the insulation does not need to be accounted for during the design of the pad geometry.Correct modelling of the thin insulation layer can be challenging, especially when involving voxelized body models or when using material averaging in the discretization procedure, which is the case for example in the finite integration technique used in CST.15 In most EM simulation tools, importing a voxelized model of the pad in a fixed discretization grid may be a suitable approach to ensure that the pad follows the contours of the body model, while maintaining realistic electrical insulation properties.
Acknowledgements
No acknowledgement found.References
1. Yang QX, Mao W, Wang J, et al. Manipulation of image intensity distribution at 7.0 T: passive RF shimming and focusing with dielectric materials. J. Magn. Reson. Imaging 2006;24:197–202.
2. Haines K, Smith NB, Webb AG. New high dielectric constant materials for tailoring the B1+ distribution at high magnetic fields. J. Magn. Reson. 2010;203:323–327.
3. Teeuwisse WM, Brink WM, Webb AG. Quantitative assessment of the effects of high-permittivity pads in 7 Tesla MRI of the brain. Magn. Reson. Med. 2012;67:1285–1293.
4. Brink WM, van der Jagt MA, Versluis MJ, Verbist BM, Webb AG. High permittivity dielectric pads improve high spatial resolution magnetic resonance imaging of the inner ear at 7 T. Invest. Radiol. 2014;49:271–277.
5. Brink WM, Remis RF, Webb AG. A theoretical approach based on electromagnetic scattering for analysing dielectric shimming in high-field MRI. Magn. Reson. Med. 2016;75:2185–2194.
6. de Heer P, Brink WM, Kooij BJ, Webb AG. Increasing signal homogeneity and image quality in abdominal imaging at 3 T with very high permittivity materials. Magn. Reson. Med. 2012;68:1317–1324.
7. Brink WM, van den Brink JS, Webb AG. The effect of high-permittivity pads on specific absorption rate in radiofrequency-shimmed dual-transmit cardiac imaging at 3 Tesla. submitted 2015.
8. Koolstra K, Börnert P, Brink W, Webb A. Improved image quality and reduced power deposition in the spine at 3 T using extremely high permittivity materials. Magn. Reson. Med. 2017.
9. van Gemert J, Brink W, Remis R, Webb A. A simulation study on the effect of optimized high permittivity materials on fetal imaging at 3T. Magn. Reson. Med. 2019.
10. Bitz AK, Kraff O, Orzada S, et al. RF safety evaluation of different configurations of high-permittivity pads used to improve imaging of the cerebellum at 7 Tesla. In: Proceedings of the 23rd Annual Meeting of ISMRM, Milan, Italy. ; 2014. p. 4892.
11. Christ A, Kainz W, Hahn EG, et al. The Virtual Family—development of surface-based anatomical models of two adults and two children for dosimetric simulations. Phys. Med. Biol. 2010;55:N23-38.
12. Ianniello C, de Zwart JA, Duan Q, et al. Synthesized tissue-equivalent dielectric phantoms using salt and polyvinylpyrrolidone solutions. Magn. Reson. Med. 2017.
13. Nehrke K, Börnert P. DREAM—A Novel Approach for Robust, Ultrafast, Multislice B1 Mapping. Magn. Reson. Med. 2012;68:1517–1526.
14. Poorter J De, Wagter C De, Deene Y De, Thomsen C, Ståhlberg F, Achten E. Noninvasive MRI Thermometry with the Proton Resonance Frequency (PRF) Method: In Vivo Results in Human Muscle. Magn. Reson. Med. 1995;33:74–81.
15. Weiland T. Time domain electromagnetic field computation with finite difference methods. Int. J. Numer. Model. Electron. Networks, Devices Fields 1996;9:295–319.
Figures