2491
A Novel Specific Absorption Rate Prediction Framework Using Multi-Task Feedback Generative Adversarial Learning: Application to 10.5 T Head MRI1Center for Magnetic Resonance Research, Department of Radiology, University of Minnesota, Minneapolis, MN, United States, 2Athinoula A. Martinos Center for Biomedical Imaging, Department of Radiology, Massachusetts General Hospital and Harvard Medical School, Boston, MA, United States, 3Medical Image Analysis and Biometry Laboratory, Universidad Rey Juan Carlos, Madrid, Spain
Synopsis
In this study, we propose a novel local SAR prediction framework based on deep learning. To this end, we introduce multi-task feedback adversarial learning to simultaneously predict local SAR distribution and its peak SAR value. The proposed model learns a mapping between simulated B1+ magnitude/tissue property maps and local SAR provided by EM simulations. Given query inputs with the properly trained model, the generator produces the local SAR distribution slice by slice, and the local SAR peak estimator predicts the upper bound of local SAR values. Validation results show that the proposed model may allow online subject-specific local SAR prediction.
Introduction
Ultrahigh-field MR imaging allows us to explore anatomical details in the human brain due to its superior signal-to-noise ratio and contrast. However, its practical use is limited by signal inhomogeneity and tissue heating due to the specific absorption rate (SAR). Although multi-channel transmit MRI systems have been developed to handle such issues1, subject-specific SAR assessment is still challenging.2 The local SAR is usually calculated by offline numerical simulations and depends on the phase and amplitude of the coil array.3 Moreover, the simulations use generic body models accounting for the inter-subject variability to a certain extent, however, subject-specific SAR estimation remains to be an unmet need.2 Subject-specific SAR estimation requires information regarding the electric field distribution and the tissue properties, which are not available during an MRI examination. Local SAR can also be estimated using MRI-based complex B1+ mapping.4 However this approach usually requires the transverse component of the electric field to be negligible, therefore its accuracy is significantly reduced when such condition is not met. Recent advances in deep learning have enabled us to effectively solve the non-linear mapping problem for image to image translation.5 In this study, we propose an online subject-specific local SAR prediction framework based on deep learning and we apply it to 10.5 T MRI. To this end, we introduce multi-task feedback adversarial learning, which allows us to simultaneously predict local SAR distribution and peak SAR value.Methods
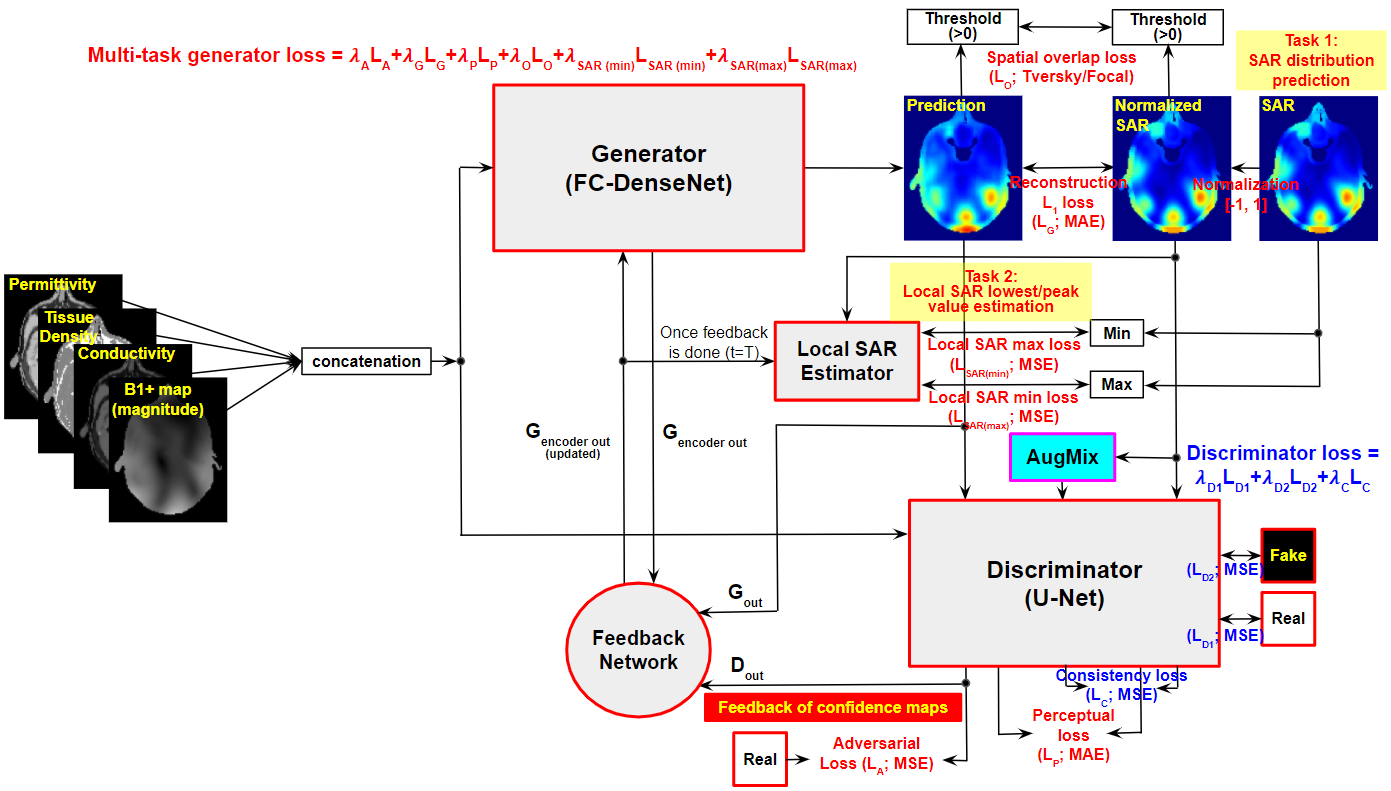
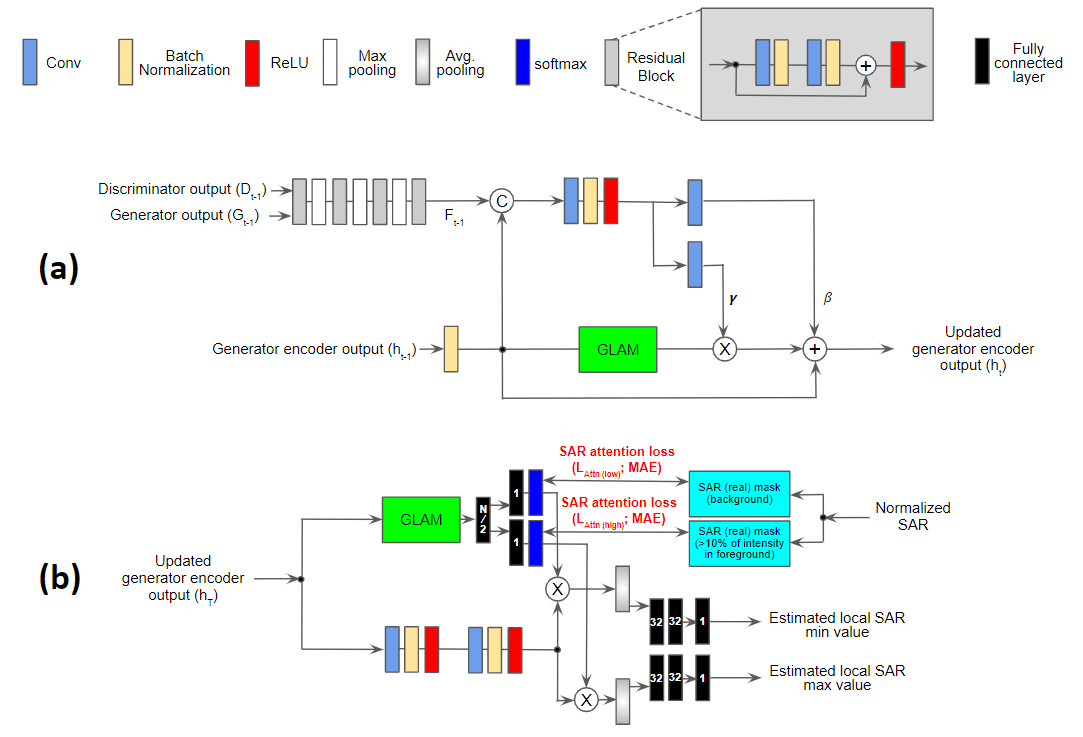
Predicting local SAR values in a different intensity range is ill-posed. To deal with the problem, we split the SAR prediction into two tasks - SAR distribution prediction in a normalized space and peak SAR estimation. The proposed multi-task model simultaneously learns two tasks in an end-to-end manner (Fig. 1). We use FC-DenseNet6 and U-Net7, respectively, for the generator and discriminator. The generator learns a mapping between multi-modality inputs (B1+ map magnitude, permittivity, tissue density, and conductivity) and normalized ground truth 10g-averaged SAR (obtained from numerical EM simulations). The discriminator learns to differentiate the generated image from the original one. Feedback learning is motivated by state-of-the-art work8 and is used to iteratively refine the generated SAR by using confidence maps from the discriminator (Fig. 2-(a)). The Local SAR peak estimator learns to minimize the error between the estimated peak values and real ones obtained from the original SAR (Fig. 2-(b)). Given query inputs with the trained model, local SAR distribution and peak values are predicted slice by slice in each axis and then estimated peak SAR values are applied to the SAR distribution prediction as presented in Fig. 3. B1+ maps and tissue properties data from Duke, Ella, and Louis (120x96x88 with the voxel size 2x2x2mm3) of the virtual population are used in this study. Each head model includes 40 random RF excitation patterns excited by an eight-channel 10.5T head coil9. The total input power for each RF excitation scenario is normalized to 1 W. We perform leave-one-out validation. Therefore we train the proposed model on 80 training set from two head models (i.e., training samples are 80 × the number of slices) slice by slice in each axis and validate on 40 test set from one head model. Normalized root mean square errors (NRMSE) and peak signal-to-noise ratio (PSNR; $$$10\log_{10}((peak\ value)^{2}/MSE)$$$) between predicted and ground truth SAR maps are measured for evaluation, and peak SAR values are calculated separately. Further, to compare peak regions, the center distance between 5x5x5 image patches with the maximal mean intensity in predicted and ground truth SAR is computed. Average predicted SAR is also compared with average ground truth SAR.Results and Discussion
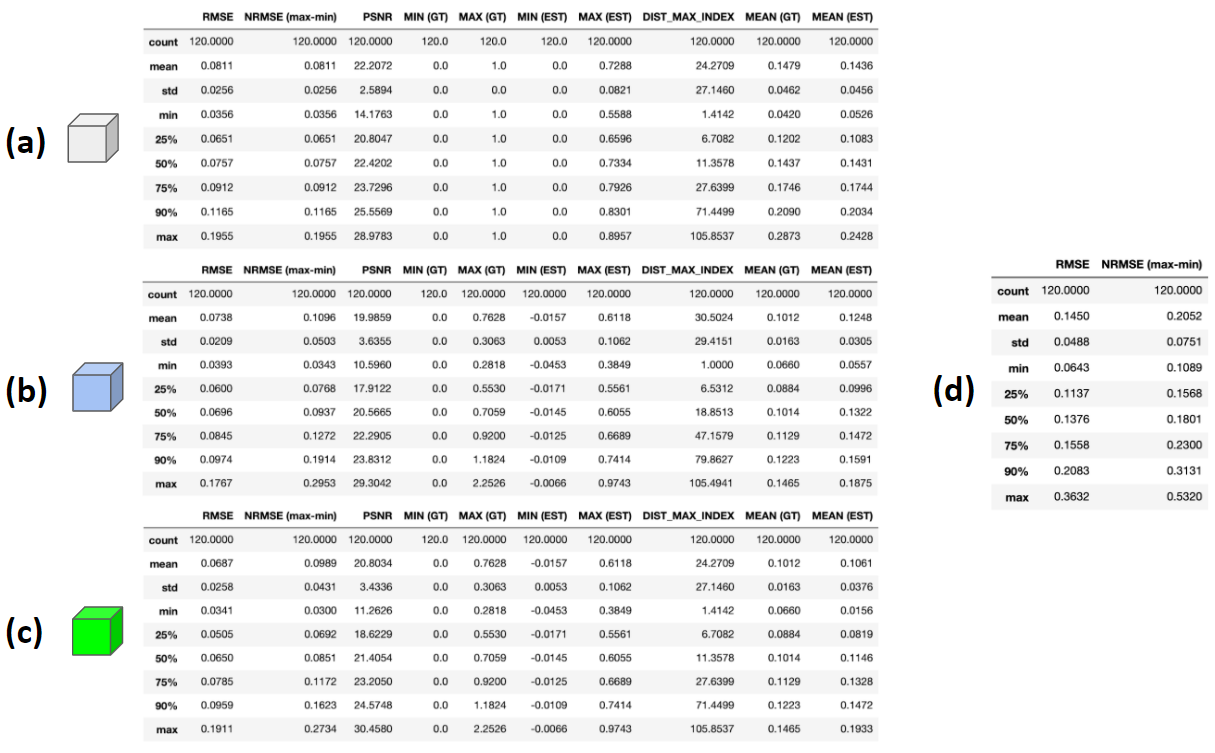
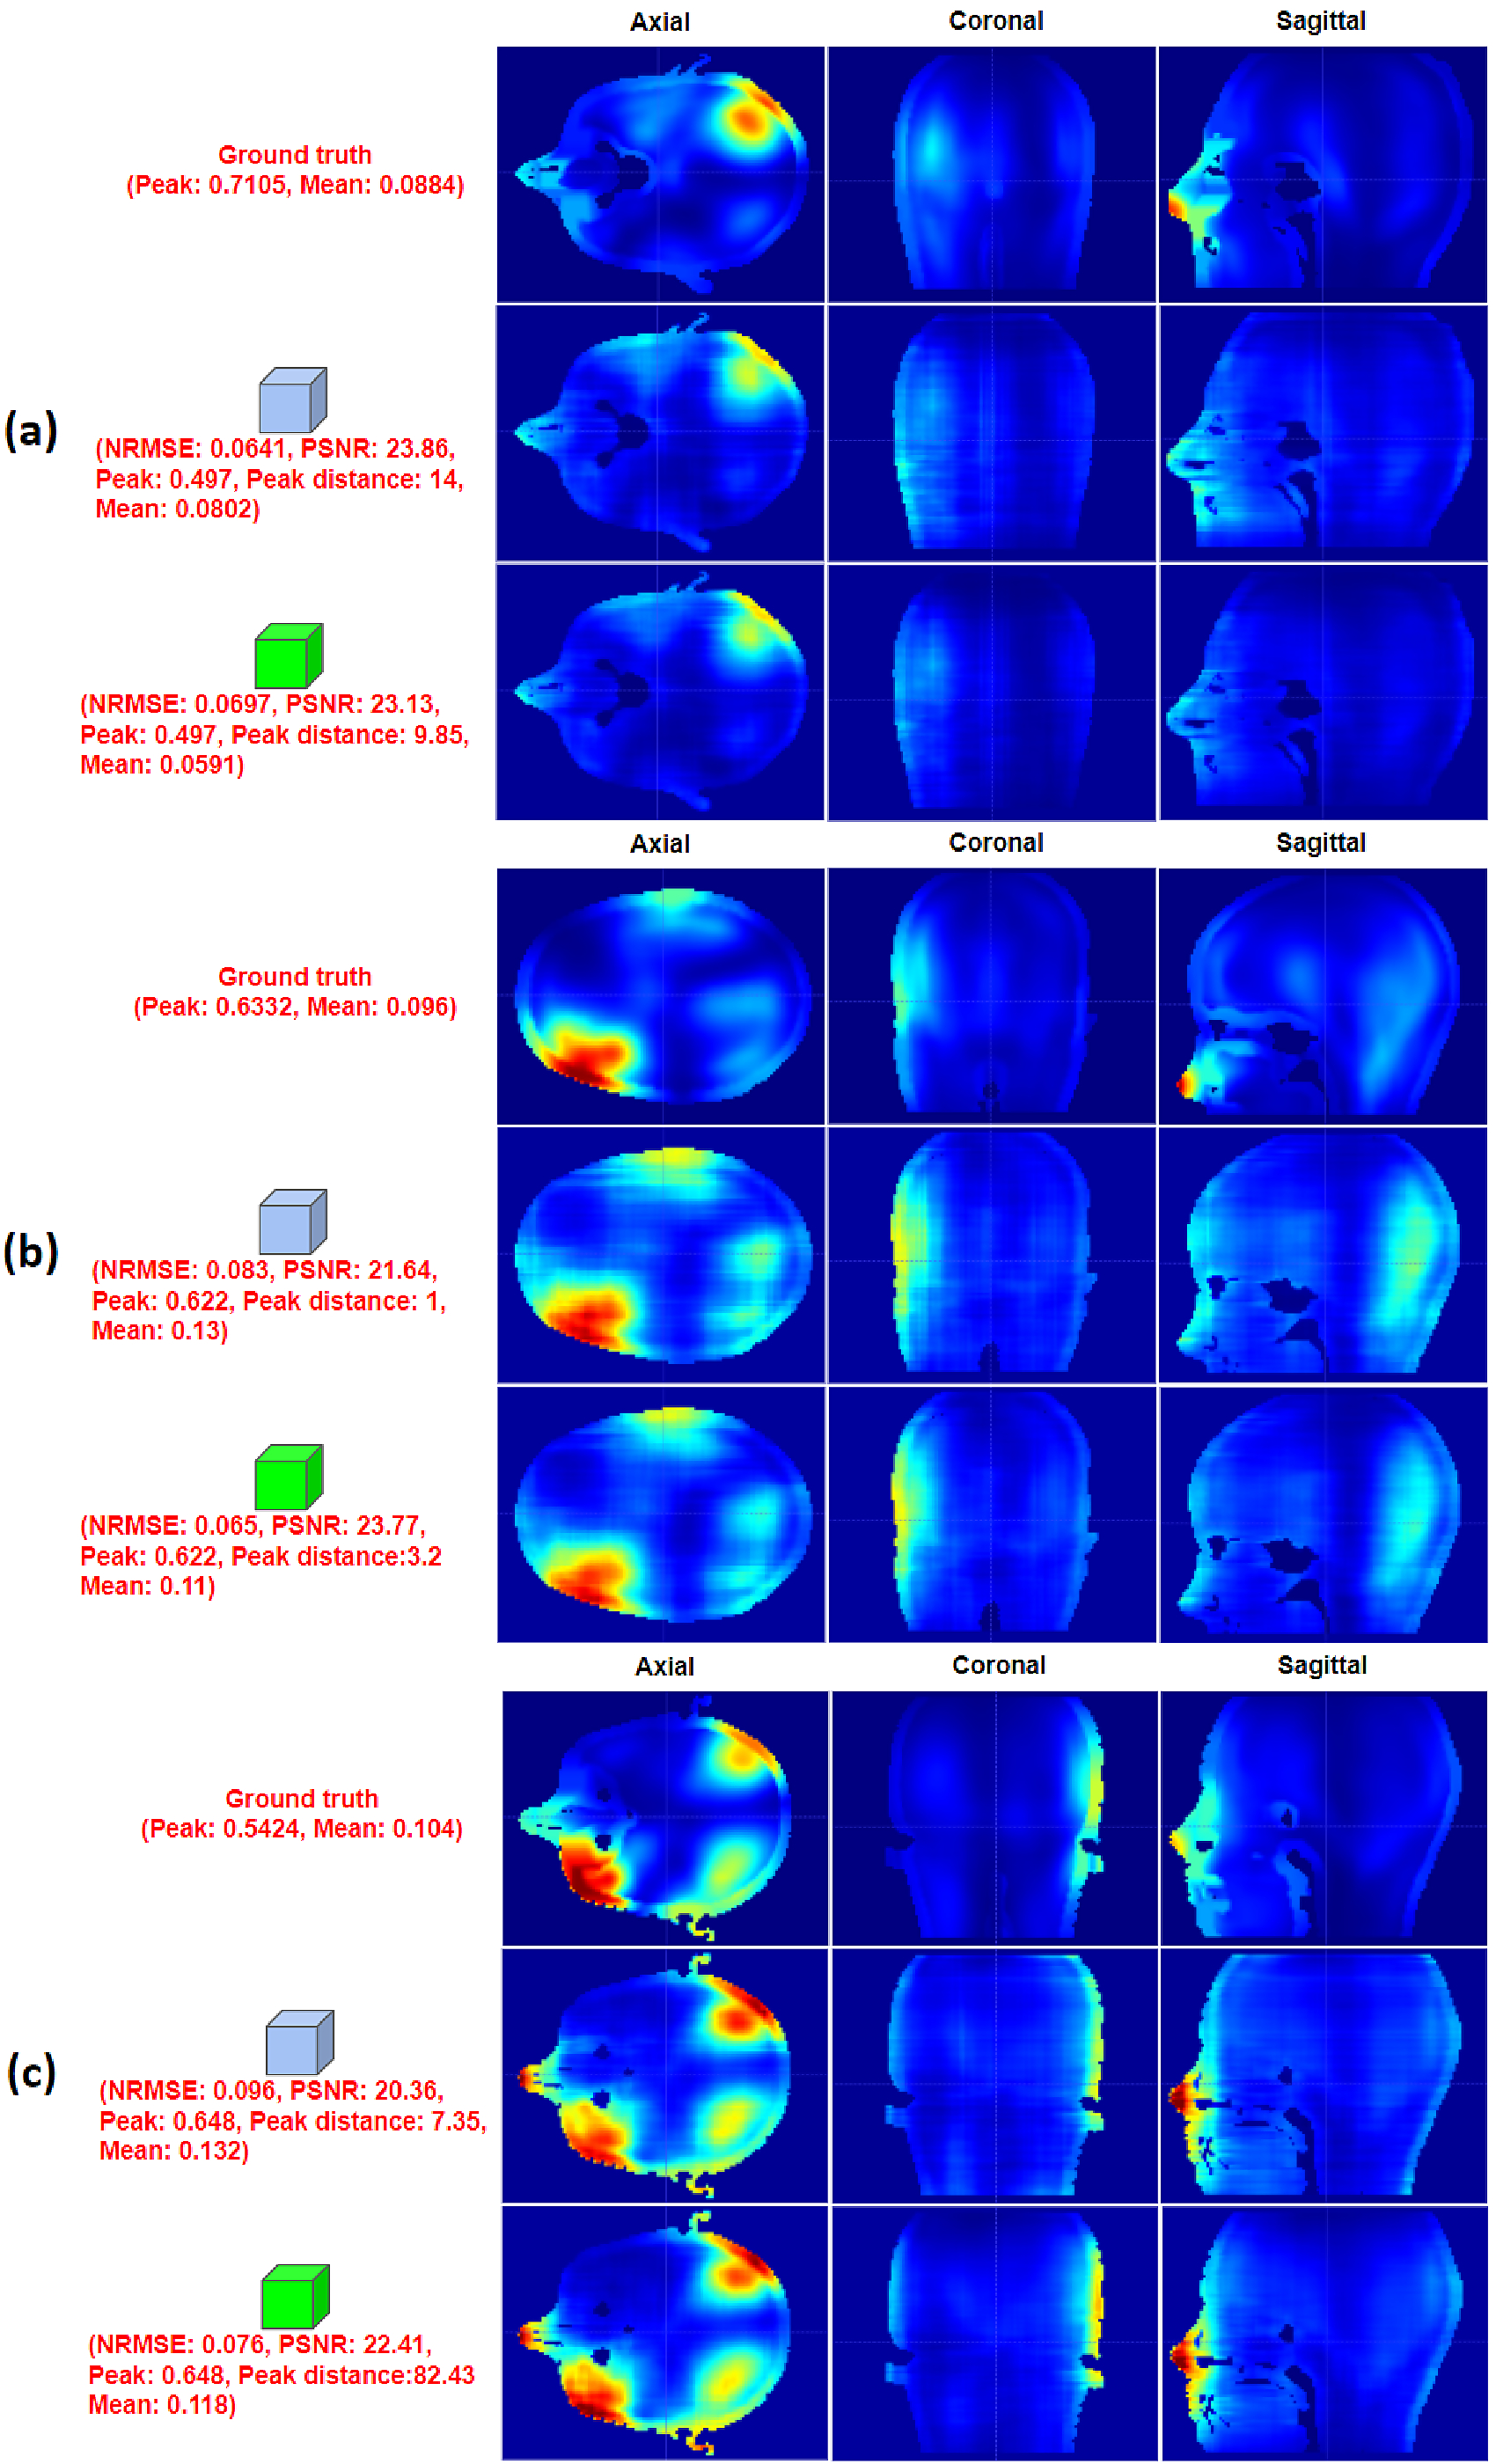
The proposed model yields comparable local SAR distribution prediction to ground truth SAR in a normalized space (NRMSE: 0.08±0.03, PSNR: 22.21 in Fig. 4-(a)). The errors between the local SAR prediction with peak values estimated slice by slice and ground truth SAR (Fig. 4-(b)) are worse than the errors in the normalized space. This might be attributed to the estimation error of local SAR peak values. Indeed, NRMSE between the estimated and ground truth SAR peak values is 0.21 ± 0.08 (Fig. 4-(d)). Interestingly, the errors between the local SAR prediction with global estimated peak values and ground truth SAR (NRMSE: 0.099±0.043, PSNR: 20.8 in Fig. 4-(c)) are slightly better. The center distance between peak regions in SAR prediction and ground truth is 54mm on average. Also, the mean intensities of SAR predictions are very close to those of the SAR ground truth. Fig. 5 exemplifies that local SAR predictions are visually comparable to the ground truth in each head model.Conclusion
Online subject-specific local SAR assessment is an important asset for ultrahigh-field MRI. In this study, we proposed a novel multi-task feedback adversarial network for simultaneous local SAR distribution and peak SAR value estimation. The proposed multi-task model learns a mapping between B1+ map/tissue properties and ground truth SAR. Given query images with the properly trained model, the proposed network estimates the SAR distribution and upper bound of local SAR slice by slice. Validation results show that the proposed framework may allow subject-specific local SAR prediction in automatic and efficient ways.Acknowledgements
National Institute of Biomedical Imaging and Bioengineering. Grant Number: P41 EB027061References
1. Padormo, F., Beqiri, A., Hajnal, J. V. & Malik, S. J. Parallel transmission for ultrahigh-field imaging. NMR Biomed. 29, 1145–1161 (2016).
2. Meliadò, E. F. et al. A deep learning method for image-based subject-specific local SAR assessment. Magn. Reson. Med. 83, 695–711 (2020).
3. Raaijmakers, A. J. E. & Steensma, B. R. Local SAR Assessment for Multitransmit Systems: A Study on the Peak Local SAR Value as a Function of Magnetic Field Strength. eMagRes 8, 1–10 (2019).
4. Katscher, U. et al. Determination of Electric Conductivity and Local SAR Via B1 Mapping. IEEE Trans. Med. Imaging 28, 1365–1374 (2009).
5. Litjens, G. et al. A Survey on Deep Learning in Medical Image Analysis. Med. Image Anal. 42, 60–88 (2017).
6. Jegou, S., Drozdzal, M., Vazquez, D., Romero, A. & Bengio, Y. The One Hundred Layers Tiramisu: Fully Convolutional DenseNets for Semantic Segmentation. in Proc. CVPR Workshop (2017).
7. Ronneberger, O., Fischer, P. & Brox, T. U-Net: Convolutional Networks for Biomedical Image Segmentation. in Proc. MICCAI (2015).
8. Huh, M., Sun, S.-H. & Zhang, N. Feedback Adversarial Learning: Spatial Feedback for Improving Generative Adversarial Networks Image Generation. in Proc. CVPR (2019).
9. Sadeghi-Tarakameh, A. et al. In vivo human head MRI at 10.5T: A radiofrequency safety study and preliminary imaging results. Magn. Reson. Med. 84, 484–496 (2020).
10. Kim, J., Patriat, R., Kaplan, J., Solomon, O. & Harel, N. Deep Cerebellar Nuclei Segmentation via Semi-Supervised Deep Context-Aware Learning from 7T Diffusion MRI. IEEE Access 8, 101550–101568 (2020).
11. Dan, H. et al. AugMix: A Simple Data Processing Method to Improve Robustness and Uncertainty. in Proc. ICLR (2020).
12. He, K., Zhang, X., Ren, S. & Sun, J. Delving Deep into Rectifiers : Surpassing Human-Level Performance on ImageNet Classification. in Proc. ICCV (2015).
13. Kingma, D. P. & Ba, J. L. ADAM: a method for stochastic optimization. in Proc. ICLR (2015).
14. Park, T., Liu, M.-Y., Wang, T.-C. & Zhu, J.-Y. Semantic Image Synthesis With Spatially-Adaptive Normalization. in Proc. CVPR (2019).
15. Kim, J., Patriat, R., Oren, R. & Harel, N. A Context-Aware Deep Attention Network for Thalamus Segmentation using 7T Multi-Modal MRI. in ISMRM Annual Meeting (2020).
Figures