2490
Electromagnetic simulation analysis of an RF burn injury case occurred at the elbow-bore wall contact point1Faculty of Health Sciences, Hokkaido University, Sapporo, Japan, 2Graduate School of Health Sciences, Hokkaido University, Sapporo, Japan
Synopsis
RF burn injuries occasionally occur at the contact points of skin and the bore wall, albeit out of common belief of hazardous loop forming. To investigate the mechanism of the RF burn injury occurred by the bore wall contact, we modeled an elbow-bore wall contact case on an electromagnetic analysis software by using the computable human phantom. The simulated SAR at the contact point varied up to 480% depending on the patient position in a scanner. This tendency was in accordance with the simulated electric field distribution in the scanner which is dominantly determined by the RF transmission coil.
Purpose
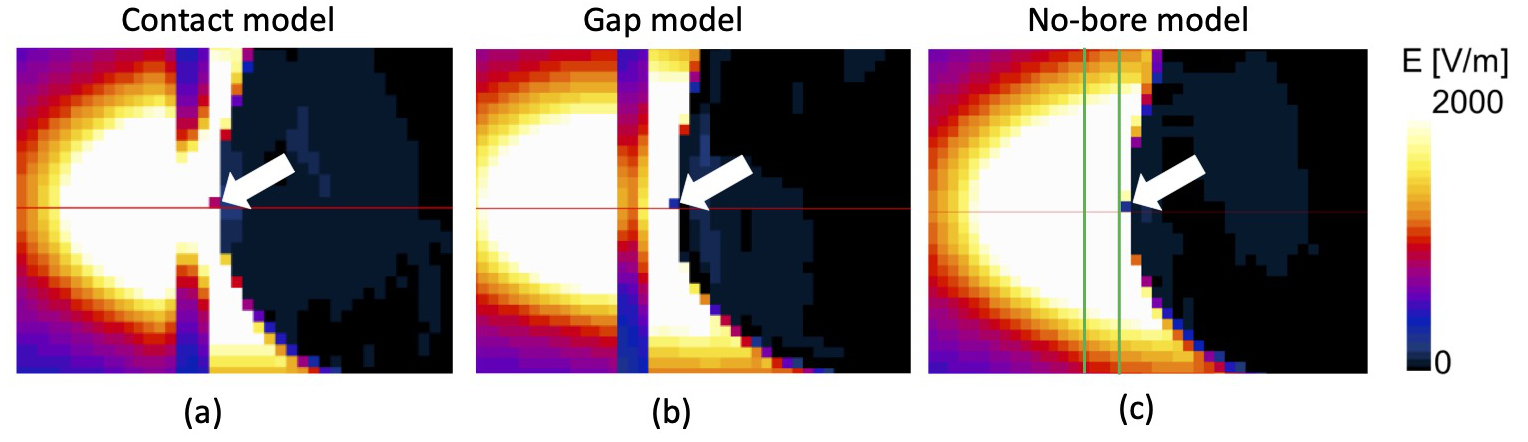
RF burn injuries are the most frequent incident during MRI examinations.1 It has been commonly believed that loop formation made by skin-skin contact or skin-cable contact is dangerous to cause RF burn injuries, because RF magnetic fields induce electric currents in a conductive loop circuit. However, it was reported that an RF burn injury case occurred at the elbow-bore wall contact point without forming any loop circuit.2 To investigate the mechanism of this type of RF burn injury, we modeled this reported case on the computable human phantom and simulated the specific absorption rate (SAR), the electric strength (E) and temperature rise under the maximum permissible whole-body SAR. The simulation with a small gap between bore and elbow was also performed. To confirm the influence of the bore, another simulation was performed by keeping the computable human phantom without the bore.Materials and Methods
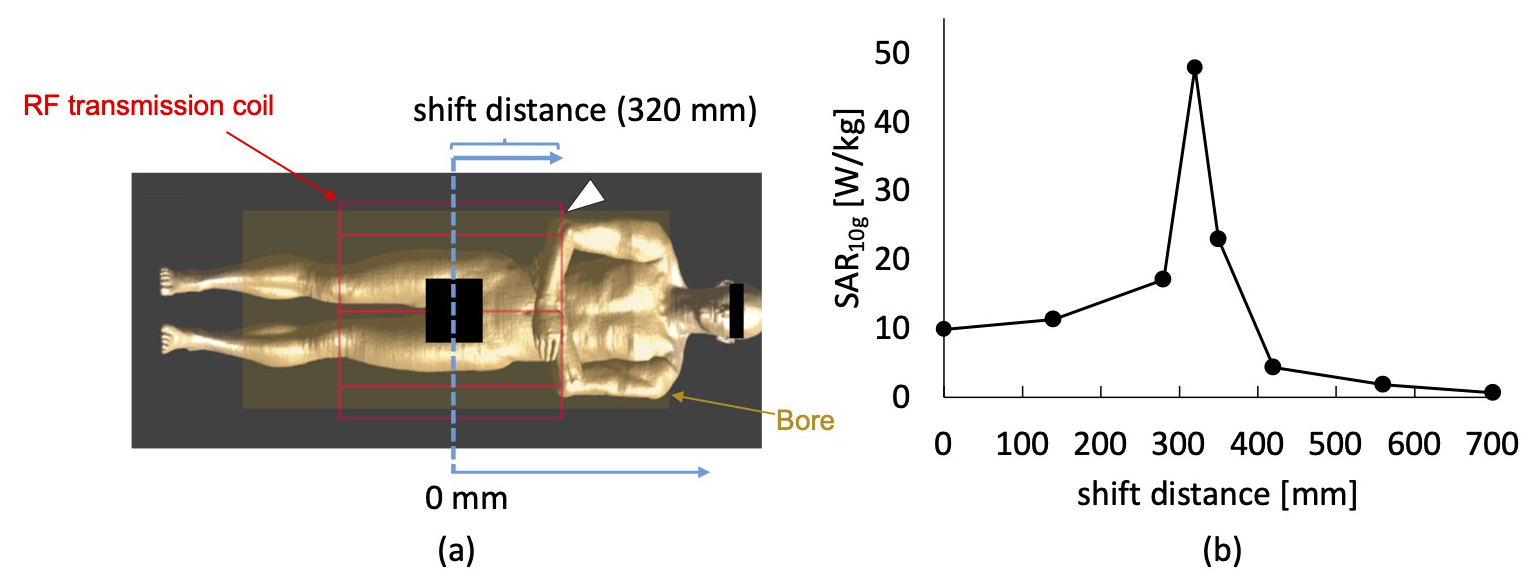
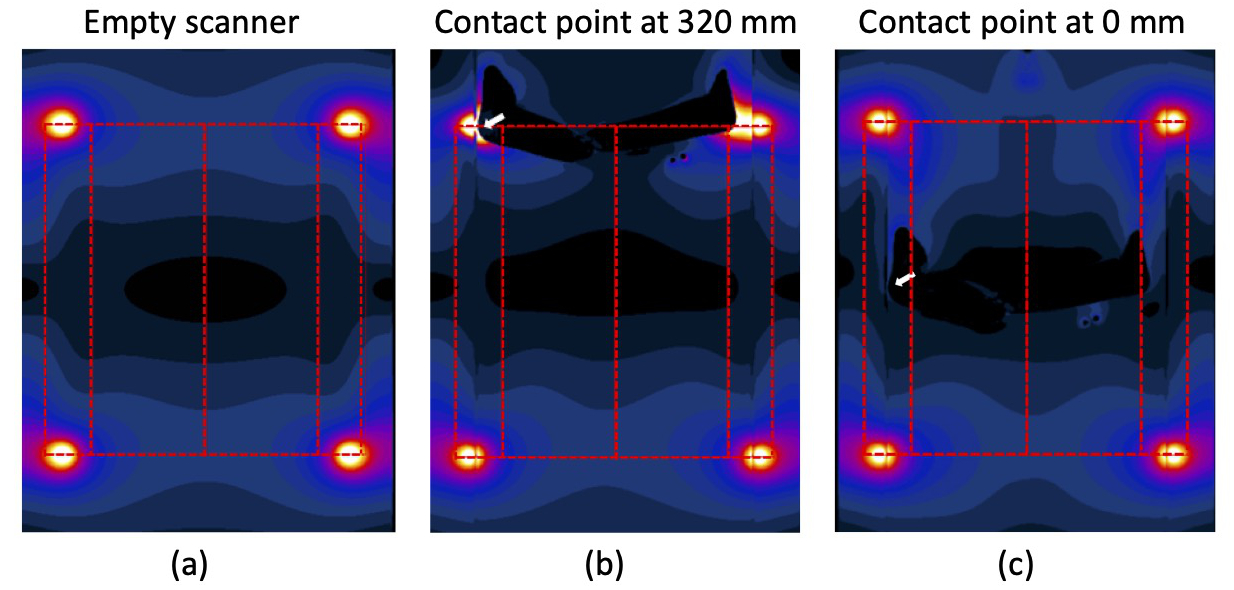
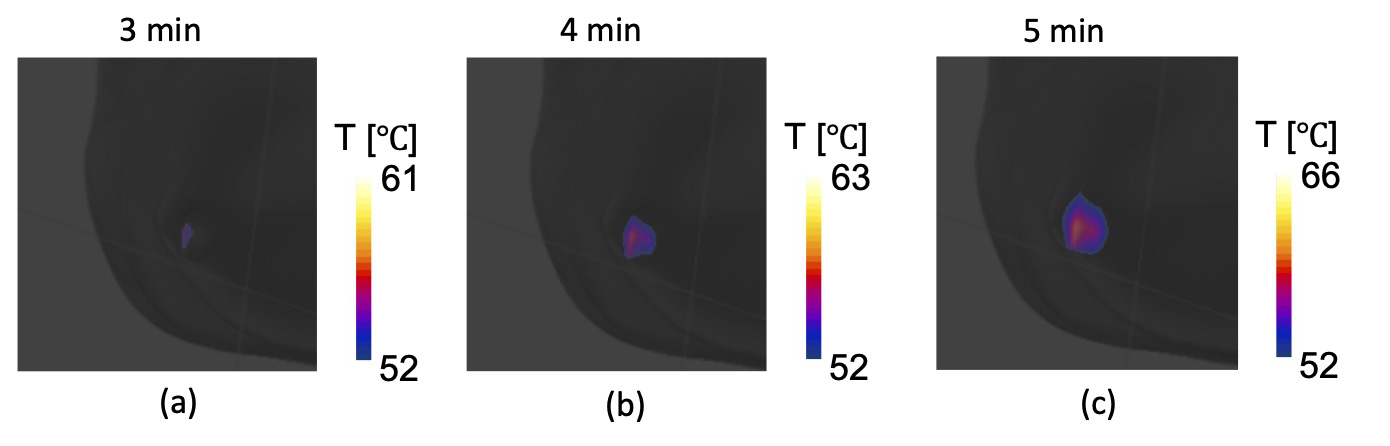
Using the finite-difference time-domain software Sim4Life (ZMT, Zurich, Switzerland), we modeled the reported case of RF burn injury due to elbow-bore wall contact2 with the mesh size of 2 × 2 × 2 mm3. By moving both arms and hands of the computable human phantom Duke, a contact point of the right elbow and the bore was formed with a contact area of 4 mm2 (1 voxel). The generic high-pass MRI birdcage model operating at 64 MHz was employed as a RF transmission coil. A B1 (100% duty cycle for SAR simulation) of 1 μT was applied to yield the distribution of SAR for 10 g of tissue (SAR10g). The distribution of E inside the scanner was also mapped including for the empty scanner as a reference. To simulate the worst-case clinical scenario, the worst-case peak local SAR10g value of the contact point was obtained by converting the simulated SAR10g to a condition of the maximum permissible whole-body SAR (SARw) that is 2 W/kg. To investigate how the position of a patient in an MRI scanner affects the worst-case peak local SAR10g, Duke was shifted 0, 140, 280, 320, 350, 420, and 700 mm in the direction of B0 from the center of the RF transmission coil (0 mm) (Fig.1a). At the position where the highest SAR10g obtained (contact model), the temperature rise during the 5-minutes RF exposure was also simulated for each model under the maximum permissible SARw. The temperatures of skin surface around the contact point were mapped every 1 min. By placing a small gap (2 mm) between the bore and the elbow (gap model) and removing the bore (no-bore model), the same simulation was performed.Results and Discussion
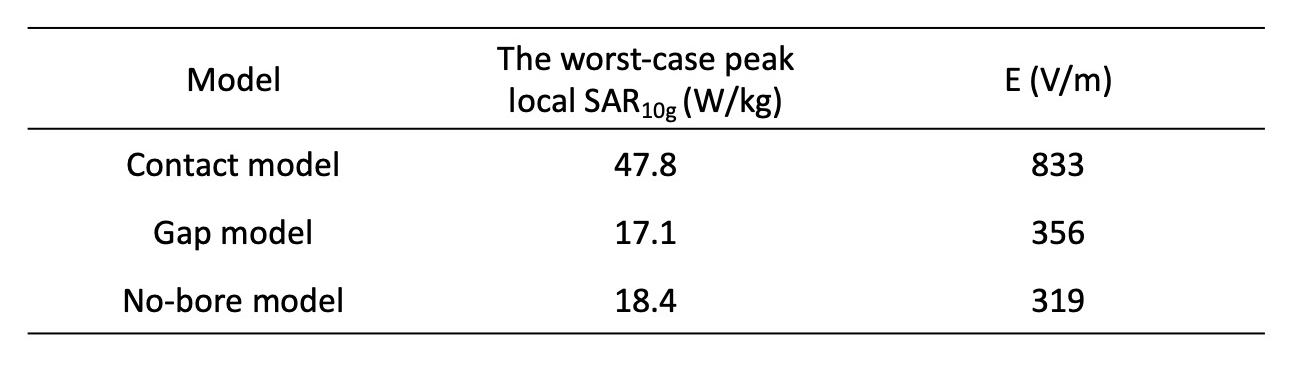
The worst-case peak local SAR10g of the contact point varied with Duke position along the B0 and the highest SAR10g peaked at 47.8 W/kg when the shifted distance was 320 mm where the contact point located at the edge of the transmit coil (Fig.1). When the scanner was empty, a significantly stronger E was shown around the edges of the birdcage transmission coil (Fig. 2a) due to the existence of the lumped capacitors3. Even though the human model was placed inside the MRI scanner (Fig. 2b and c), the E still remained strong around the edges. Since SAR is proportional to the square of E, it is reasonable that the worst-case peak local SAR10g increased strongly with an increase in E from the center to the edge. The position where the highest SAR10g obtained agreed with the reported RF burn injury case in that a pelvis imaging was performed2. At the position where the worst-case peak local SAR10g maximized, the temperatures of the skin surface areas around the contact point increased with increasing RF exposure duration and reached over 52℃ within 3 mins (Fig.3); 1-min duration of this temperature leads to the first-degree burn4. Our results clearly showed the RF burn injury cases in silico. The worst-case peak local SAR10g values for gap and no-bore models decrease dramatically from that of contact model as well as the values of E (Table 1, Fig.4). For the gap model, the distance from elbow to the corner increased and E hence SAR10g decreased. For the no-bore model, both E and SAR10g also decreased indicating the E augmentation by the existence of the bore material. The E field in an MRI scanner is theoretically separated into the magnetically-induced and conservative contributions.5 The former contribution is an elemental concept that explains a danger of loop formation, and the latter contribution originates from the electric charges appear on materials including human body. The major contribution of the latter has been demonstrated in the simulation study.6 Because the E map of the empty scanner dominantly shows the conservative contribution, RF burn injuries occurred at the contact point of the skin and the bore wall would be caused by this contribution rather than the magnetically-induced one.Conclusions
The substantial amount of heat generation of an RF burn injury case occurred at the elbow-bore wall contact point was demonstrated by the electromagnetic simulation. This RF heating is dependent on the electric field distribution inside the MRI scanner, which is dominantly determined by the RF transmission coil.Acknowledgements
No acknowledgement found.References
1. Grainger D. MHRA MRI safety guidance: review of key changes and emerging issues. Imaging and Oncology. 2015;42-47.
2. Yamazaki M, Yamada E, Kudou S, Higashida M. Study of a temperature rise in RF irradiation during MR imaging : measurements of local temperature using a loop phantom. Japanese J Radiol Technol 2005;61:1125–32.
3. Liu Y, Shen J, Kainz W, Qian S, Wu W, Chen J. Numerical investigations of MRI RF field induced heating for external fixation devices. Biomed Eng Online 2013;12:12.
4. Willamson C, Scholtz JR. Time-temperature relationships in thermal blister formation. J Invest Dermatol 1949;12:41–7.
5. Park B, Webb A, Collins C. A method to separate conservative and magnetically-induced electric fields in calculations for MRI and MRS in electrically-small smples. J Magn Reson 2009;199:233-37.
6. Park B, Rajan S, Collins C, Angelone L. Analysis of conservative and magnetically induced electric fields in a low-frequency birdcage coil. J Electromagn Anal Appl 2013;5:271-80.
Figures