2488
Robustness of pTx safety concepts to varying subjects and subject positions
Johannes Petzold1, Bernd Ittermann1, and Frank Seifert1
1Physikalisch-Technische Bundesanstalt (PTB), Braunschweig and Berlin, Germany
1Physikalisch-Technische Bundesanstalt (PTB), Braunschweig and Berlin, Germany
Synopsis
This simulation study compares two concepts ensuring IEC-compliant SAR values for parallel transmission (pTx) in respect to their robustness against subject- and position-changes: 1) direct SAR assessment (SL) and 2) an amplitude limit for all pTx channels (AL). For the example case of a 3T pTx body coil, SL resulted in ten-fold the allowed SAR in one model for the same excitation vector that obeys IEC limits in another model. For AL, less than twice the SAR was found in this case. AL allows for a lower safety factor, therefore, resulting in a higher mean(B1+) compared to SL.
Introduction
Implant safety revitalized the interest in parallel transmission (pTx) at lower field strengths.1 Simulation studies at 7T show that a slight shift in position or rotation of the head can lead to a tripled local specific absorption rate (SAR) compared to the position used for radio frequency (RF) optimization.2 In this simulation study, two safety concepts for a 3T pTx body coil are compared with respect to the robustness of their results, if the patient’s position, posture, or body mass index (BMI) deviate (slightly) from the simulated scenario during the safety assessment.Methods
Electric fields were extracted from electromagnetic FDTD simulations of an 8-channel 3T (128 MHz) body coil with voxel models Duke (three y-positions) and Ella (five BMI/posture variants)3 in Sim4Life4. Ten-gram averaged $$$Q$$$-matrices5 were calculated from the point SAR matrixes of the 2mm isotropic voxel grid. Additionally, one whole-head and one whole-body $$$Q$$$-matrix were generated. Normalized matrices were created by dividing each averaged $$$Q$$$-matrix by its corresponding IEC normal-mode SAR limit6.Safety Concepts
Two pTx safety concepts were compared with respect to their ability to interpolate between positions, extrapolate to new positions, robustness against model changes and conservativeness: direct SAR-Limit (SL) and Amplitude-Limit (AL). SL is the standard approach where all excitation vectors are permitted that satisfy the IEC limits. AL7 permits all excitation vectors $$$u$$$ with components $$$u_k$$$ not exceeding a universal amplitude limit $$$\alpha$$$. AL is more restrictive than SL, therefore, as excitations with uneven element voltages are penalized.
SAR-limiting criteria during the safety assessment (“anchor simulations“) were constructed as follows:
- Amplitude Limit: An upper bound for the normalized $$$\widehat{\text{SAR}}$$$ associated with each $$$\hat{Q}$$$ was derived with Hölder’s inequality8:$$\widehat{\text{SAR}}=u^\dagger\hat{Q}u\leq(\max_k|u_k|)^2\sum_{ij}|\hat{Q}_{ij}|.$$By defining$$\alpha\equiv\min_l\sqrt{\frac{1}{\sum_{ij}|\hat{Q}_{ij}^{(l)}|}},$$where the minimum runs over all $$$\hat{Q}$$$-matrices, $$$\widehat{\text{SAR}}\leq1$$$ becomes equivalent to $$$\max_k|u_k|\leq\alpha$$$.
- Direct SAR Limit: An excitation vector $$$u$$$ is safe, if $$$\max_lu^\dagger\hat{Q}_lu\leq1$$$.
Worst-case analysis
- Direct SAR Limit: Virtual observation points (VOPs)9 with SAR overshoot $$$\varepsilon=1\%$$$ were calculated for each simulation using all $$$\hat{Q}$$$. A Nelder-Mead optimization was carried out with 10000 random initial vectors and these VOPs to find the 10 excitation vectors with the highest target simulation VOP-SAR. In a second step, these 10 vectors $$$u_s$$$ were scaled to satisfy $$$\max_au_s^\dagger\hat{Q}_au_s=1$$$ for all anchor $$$\hat{Q}_a$$$-matrices to eliminate VOP-compression artefacts in $$$\widehat{\widetilde{SAR}}=\max_{u_s,\hat{Q}_t}u_s^\dagger\hat{Q}_tu_s$$$ of all target $$$\hat{Q}_t$$$.
- Amplitude Limit: The target simulation’s (amplitude limit $$$\alpha_t$$$) theoretical maximum normalized SAR for anchor simulation limit $$$\alpha_a$$$ is$$\widehat{\widetilde{SAR}}=(\frac{\alpha_t}{\alpha_a})^2.$$
Sweep analysis
The target simulation’s maximum normalized SAR is calculated for 10000 random excitation vectors scaled to satisfy the anchor simulation’s safety limit.
Results
Unknown patient modelAll simulations were grouped by the z-distance between coil center and model’s heart (Figs. 1A and 2C). For model-family Ella, simulations were only available in the gray interval. The maximum amplitude limit $$$\alpha$$$ of all simulations in a group deviates by less than ~20% (Fig. 2A). Worst case analyses in each group for i) all combinations of one anchor and one target ("$$$i\,\rightarrow\,j$$$") and ii) all combinations of one target and all remaining simulations as anchor ("$$$(\text{all}-j)\,\rightarrow\,j$$$") (Figs. 1B and 2B) show up to 10 times the allowed SAR values for (SL,$$$\,i\,\rightarrow\,j$$$) and up to 2 times for (AL,$$$\,i\,\rightarrow\,j$$$). In both cases, the $$$(\text{all}-j)\,\rightarrow\,j$$$ approach is safer with SAR-factors $$$<3$$$ (SL) and $$$<1.5$$$ (AL).
Mean($$$B_1^+$$$) in the image plane was optimized by a Nelder-Mead algorithm for both concepts and all simulations and compared to the CP-mode value (Fig. 2D). While SL outperforms the CP mode ($$$\text{mean}(B_{1,\text{SL}}^+)/\text{mean}(B_{1,\text{CP}}^+)\approx\,1.1$$$) , AL falls behind ($$$\text{mean}(B_{1,\text{AL}}^+)/\text{mean}(B_{1,\text{CP}}^+)\approx\,0.75$$$). Applying a safety factor $$$\sqrt{\frac{1}{\widehat{\widetilde{\text{SAR}}}}}$$$, however, obtained from the maximum of the respective ($$$\,i\,\rightarrow\,j$$$) cases of both concepts (Fig. 2B) reverses the picture with $$$\sqrt{\frac{1}{\widehat{\widetilde{\text{SAR}}}_{\text{SL}}}}\frac{\text{mean}(B_{1,\text{SL}}^+)}{\text{mean}(B_{1,\text{CP}}^+)}\approx\,0.4$$$, now, while $$$\sqrt{\frac{1}{\widehat{\widetilde{\text{SAR}}}_{\text{AL}}}}\frac{\text{mean}(B_{1,\text{AL}}^+)}{\text{mean}(B_{1,\text{CP}}^+)}\approx\,0.7$$$, see Fig. 2E. Note that no safety factors were applied to CP, here, as it serves as a fixed reference.
Assumption of correct patient model
Three simulations of Duke with steps of $$$\Delta$$$z=50mm were compared (Figs. 3 and 4). Using the outer two as anchors to infer the target in the middle (interpolation) with SL resulted in a local normalized-SAR maximum of 1.1 in the target (Fig. 5A). Extrapolation from one anchor to the neighboring target resulted in a maximum normalized SAR of 1.8 (Fig. 5B), while the theoretical maximum for AL was 1.25 (Fig. 4B).
Discussion
SL with positional interpolation is SAR-wise safe while offering the best performance if the correct patient’s model was used during safety assessment.A possible inter-patient SAR overshoot of up to a factor of 10, however, necessitates a high safety factor for SL as it is not feasible to digitize patients on the fly and only ~40 human voxel models10 are currently available as anchors. While AL’s $$$\text{mean}(B_1^+)$$$ is ~30% lower compared to SL for a single model, the AL’s inter-patient SAR overshoot is much lower (<2) due to its phase-invariance. AL is therefore outperforming SL by ~30% in $$$\text{mean}(B_1^+)$$$ when the safety margin is factored in.
Conclusion
Due to its better robustness against model-variations, AL requires lower safety margins and therefore provides higher $$$\text{mean}(B_1^+)$$$ than SL.Acknowledgements
This project (17IND01 MIMAS) has received funding from the EMPIR programme co-financed by the Participating States and from the European Union's Horizon 2020 research and innovation programme.References
- Winter L, Seifert F, Zilberti L, Murbach M, Ittermann B. MRI‐Related Heating of Implants and Devices: A Review. J. Magn. Reson. Imaging 2020:jmri.27194 doi: 10.1002/jmri.27194.
- Kopanoglu E, Deniz CM, Erturk MA, Wise RG. Specific absorption rate implications of within-scan patient head motion for ultra-high field MRI. Magn. Reson. Med. 2020;84:2724–2738 doi: 10.1002/mrm.28276.
- Gosselin M-C, Neufeld E, Moser H, et al. Development of a new generation of high-resolution anatomical models for medical device evaluation: the Virtual Population 3.0. Phys. Med. Biol. 2014;59:5287–5303 doi: 10.1088/0031-9155/59/18/5287.
- Sim4Life 5.2, ZMT Zurich MedTech, Zürich, Switzerland
- Bardati F, Borrani A, Gerardino A, Lovisolo GA. SAR optimization in a phased array radiofrequency hyperthermia system. IEEE Trans. Biomed. Eng. 1995;42:1201–1207 doi: 10.1109/10.476127.
- IEC 60601-2-33 Ed. 3.2: Particular requirements for the basic safety and essential performance of magnetic resonance equipment for medical diagnosis. International Electrotechnical Commission, 2015.
- Seifert F, Cassara A, Weidemann G, Ittermann B. Reliable and robust RF safety assessment of transmit array coils at ultrahigh fields. In: Proc. Intl. Soc. Mag. Reson. Med. 22. ; 2014. p. 4891.
- Hölder O. Ueber einen Mittelwerthssatz. Nachrichten Von Königl Ges. Wiss. Georg-Augusts-Univ. Zu Gött. 1889:38–47.
- Eichfelder G, Gebhardt M. Local specific absorption rate control for parallel transmission by virtual observation points. Magn. Reson. Med. 2011;66:1468–1476 doi: 10.1002/mrm.22927.
- Makarov SN, Noetscher GM, Yanamadala J, et al. Virtual Human Models for Electromagnetic Studies and Their Applications. IEEE Rev. Biomed. Eng. 2017;10:95–121 doi: 10.1109/RBME.2017.2722420.
Figures
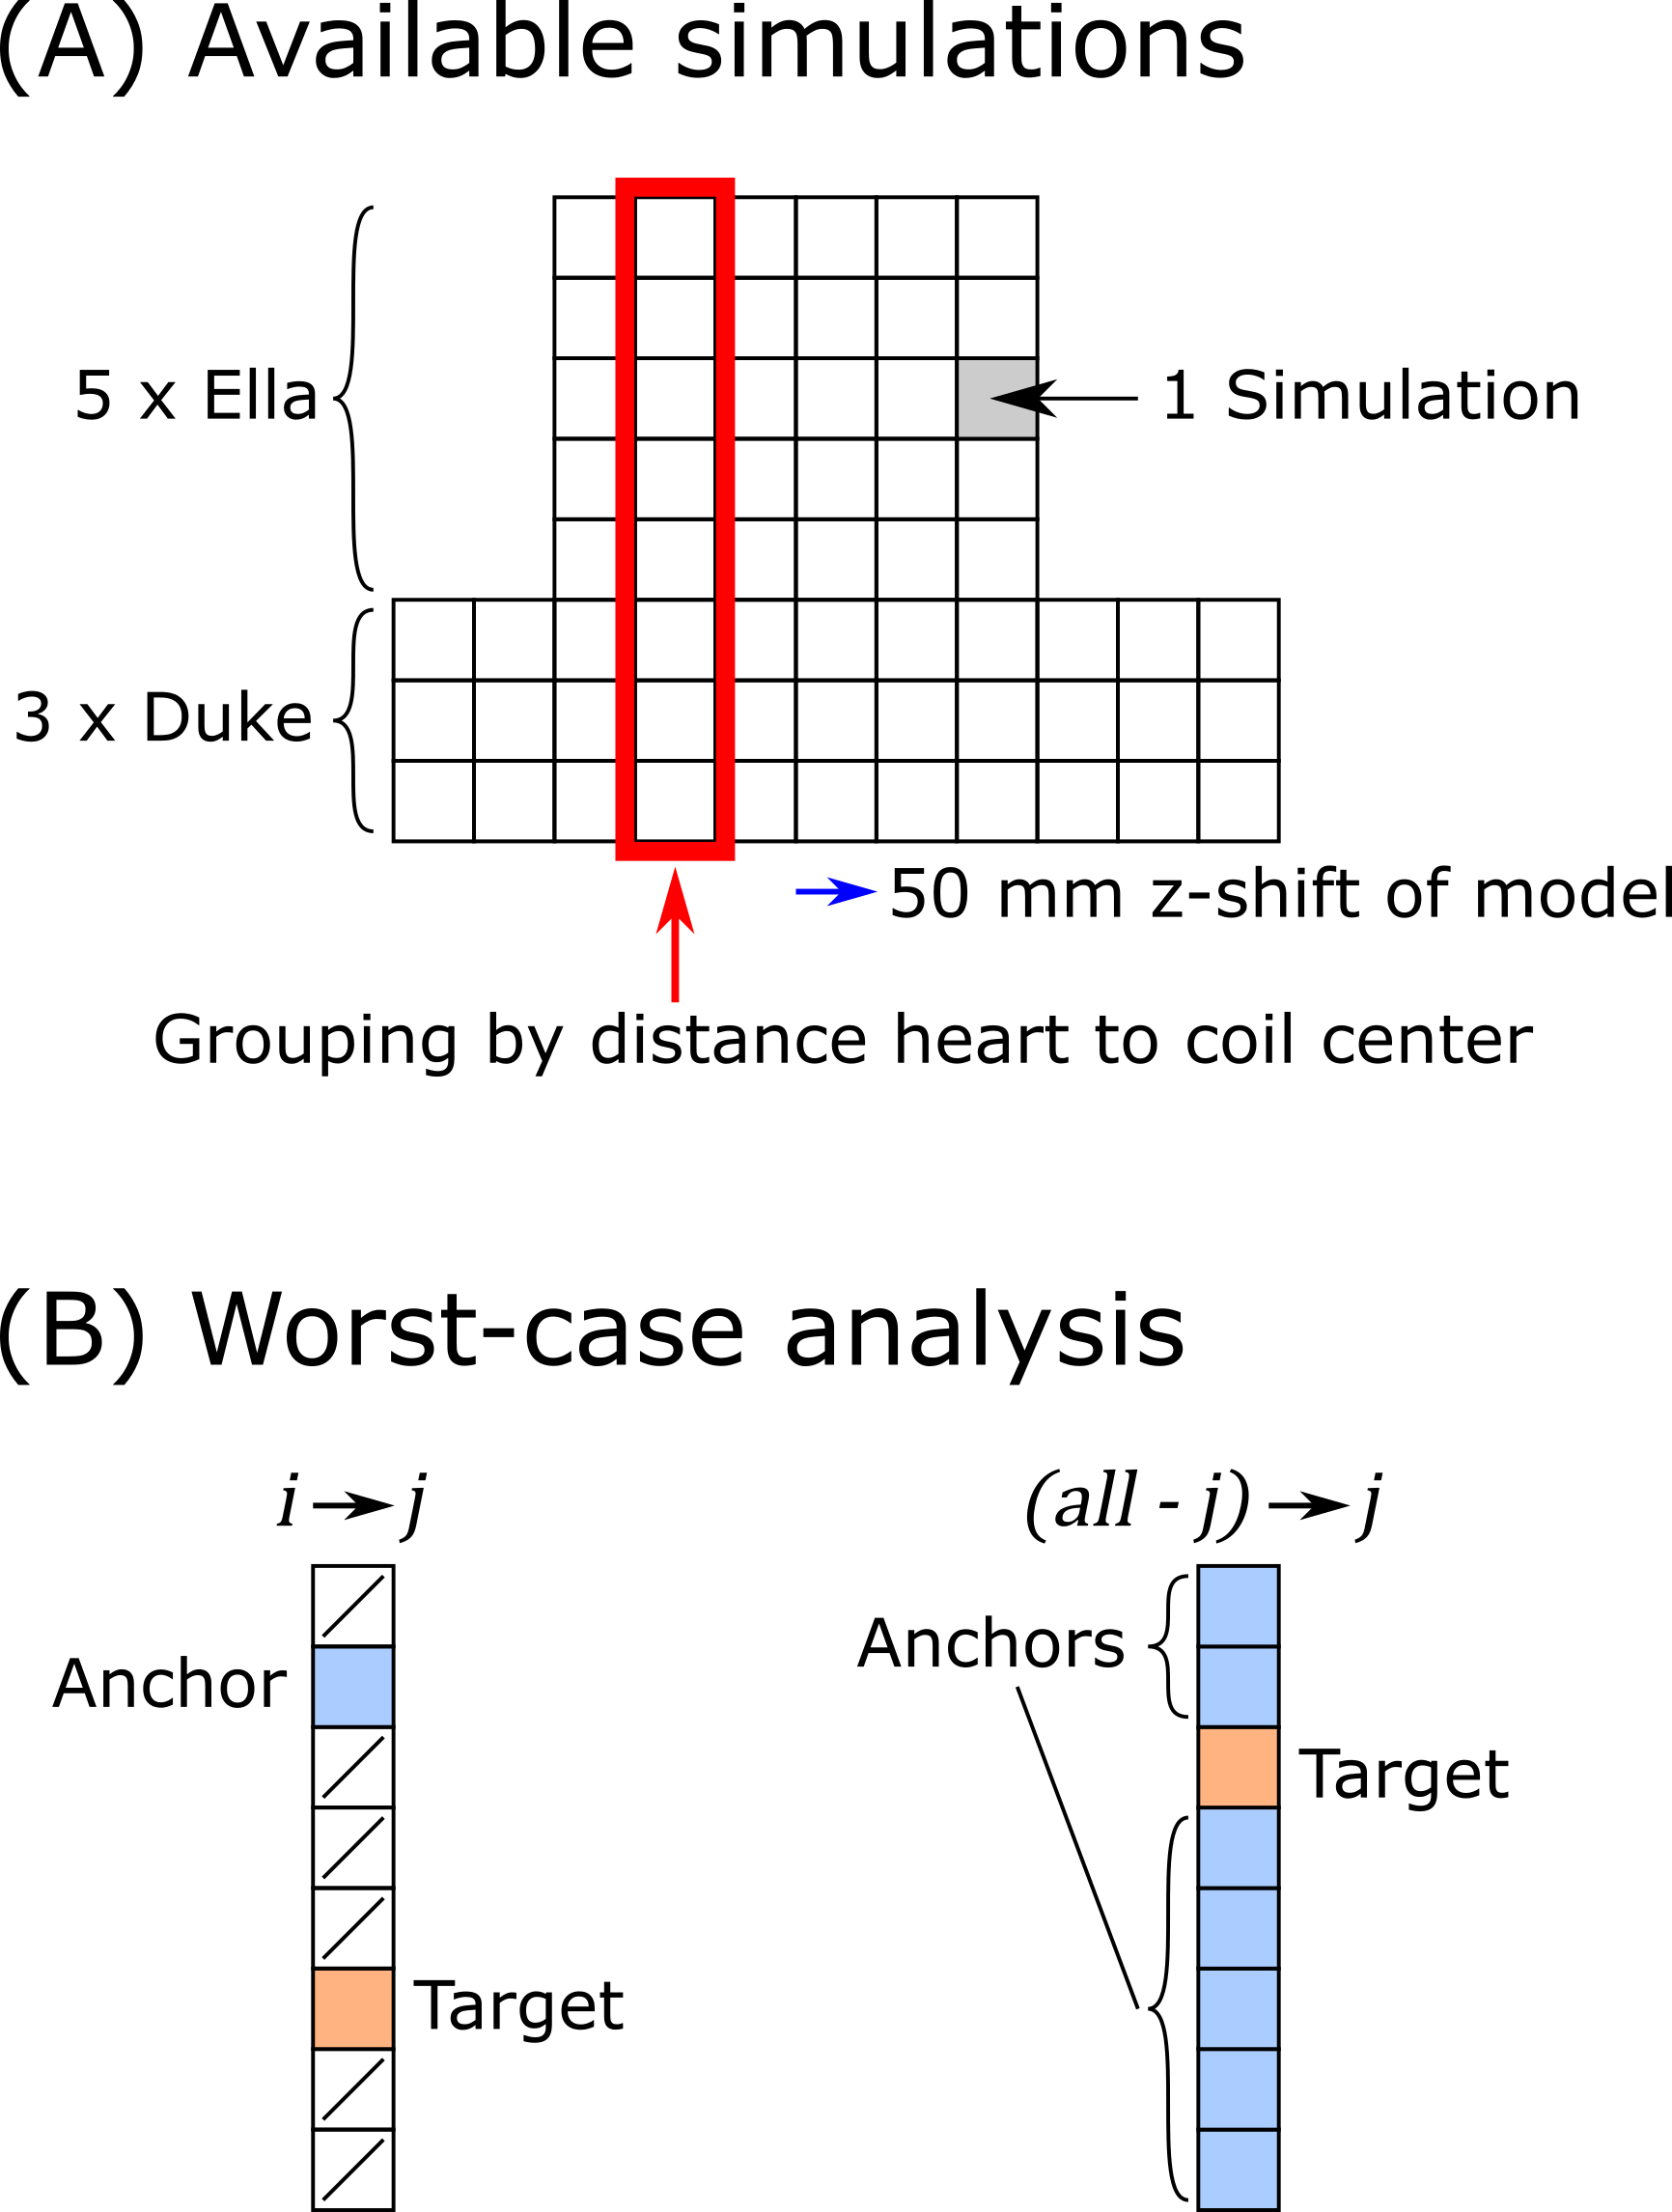
Fig. 1. A) Available simulations in this study.
Each model is simulated for different z-positions with 50mm step size. All simulations
are grouped by the distance between the coil center and the model’s heart. B)
Two optimization cases are analyzed: i→j: One anchor simulation, one
target simulation, all other simulations are disregarded; (all-j)→j: All
simulations except the target simulation are used as anchor.
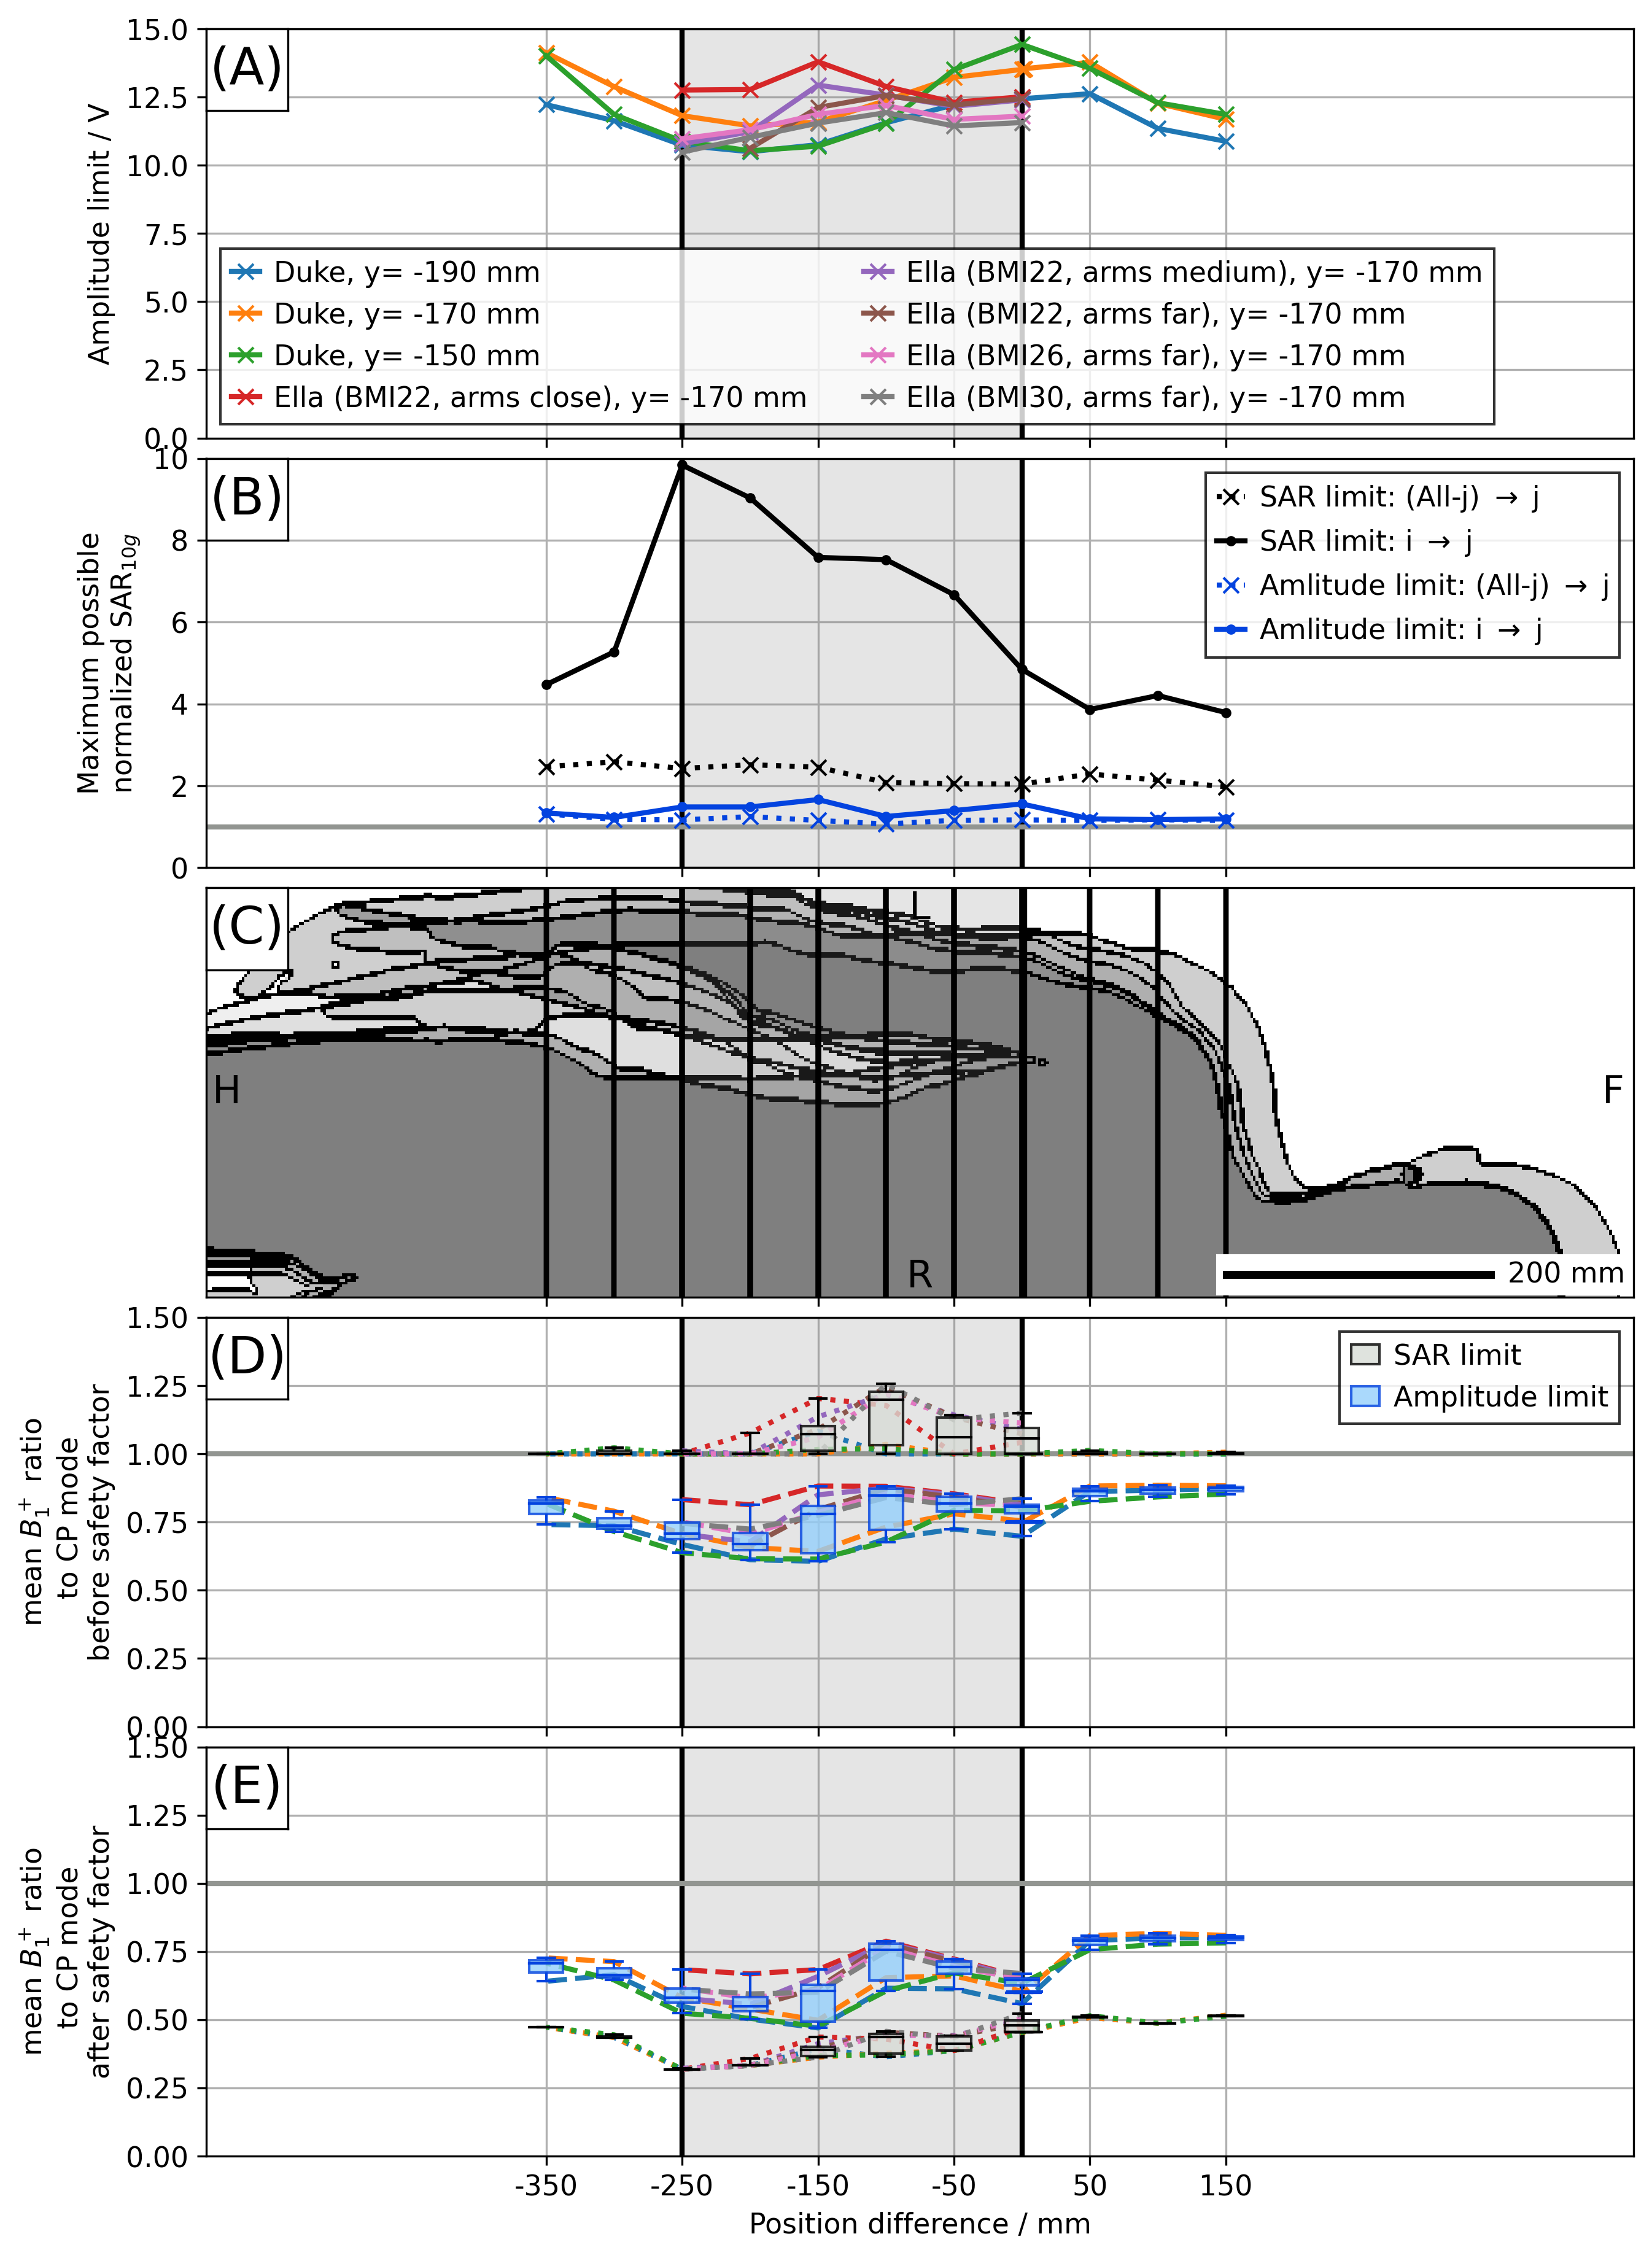
Fig. 2.
Comparison of multiple excitation scenarios. Patient centric coordinate system
with origin at heart. Simulations of Ella are only available in the light gray
area. A) Amplitude limit of all simulations. B) Maximum normalized SAR in each
group for cases of Fig. 1B. C) Overlay of the voxel models. D) Ratio between optimized
mean(B1+) of image slice (i.e. excitations of same or better homogeneity than CP
mode) and mean(B1+) of CP reference mode. E) same as D) but multiplied with safety factor
obtained from the respective (i->j) maximum normalized SAR (CP reference mode unchanged).
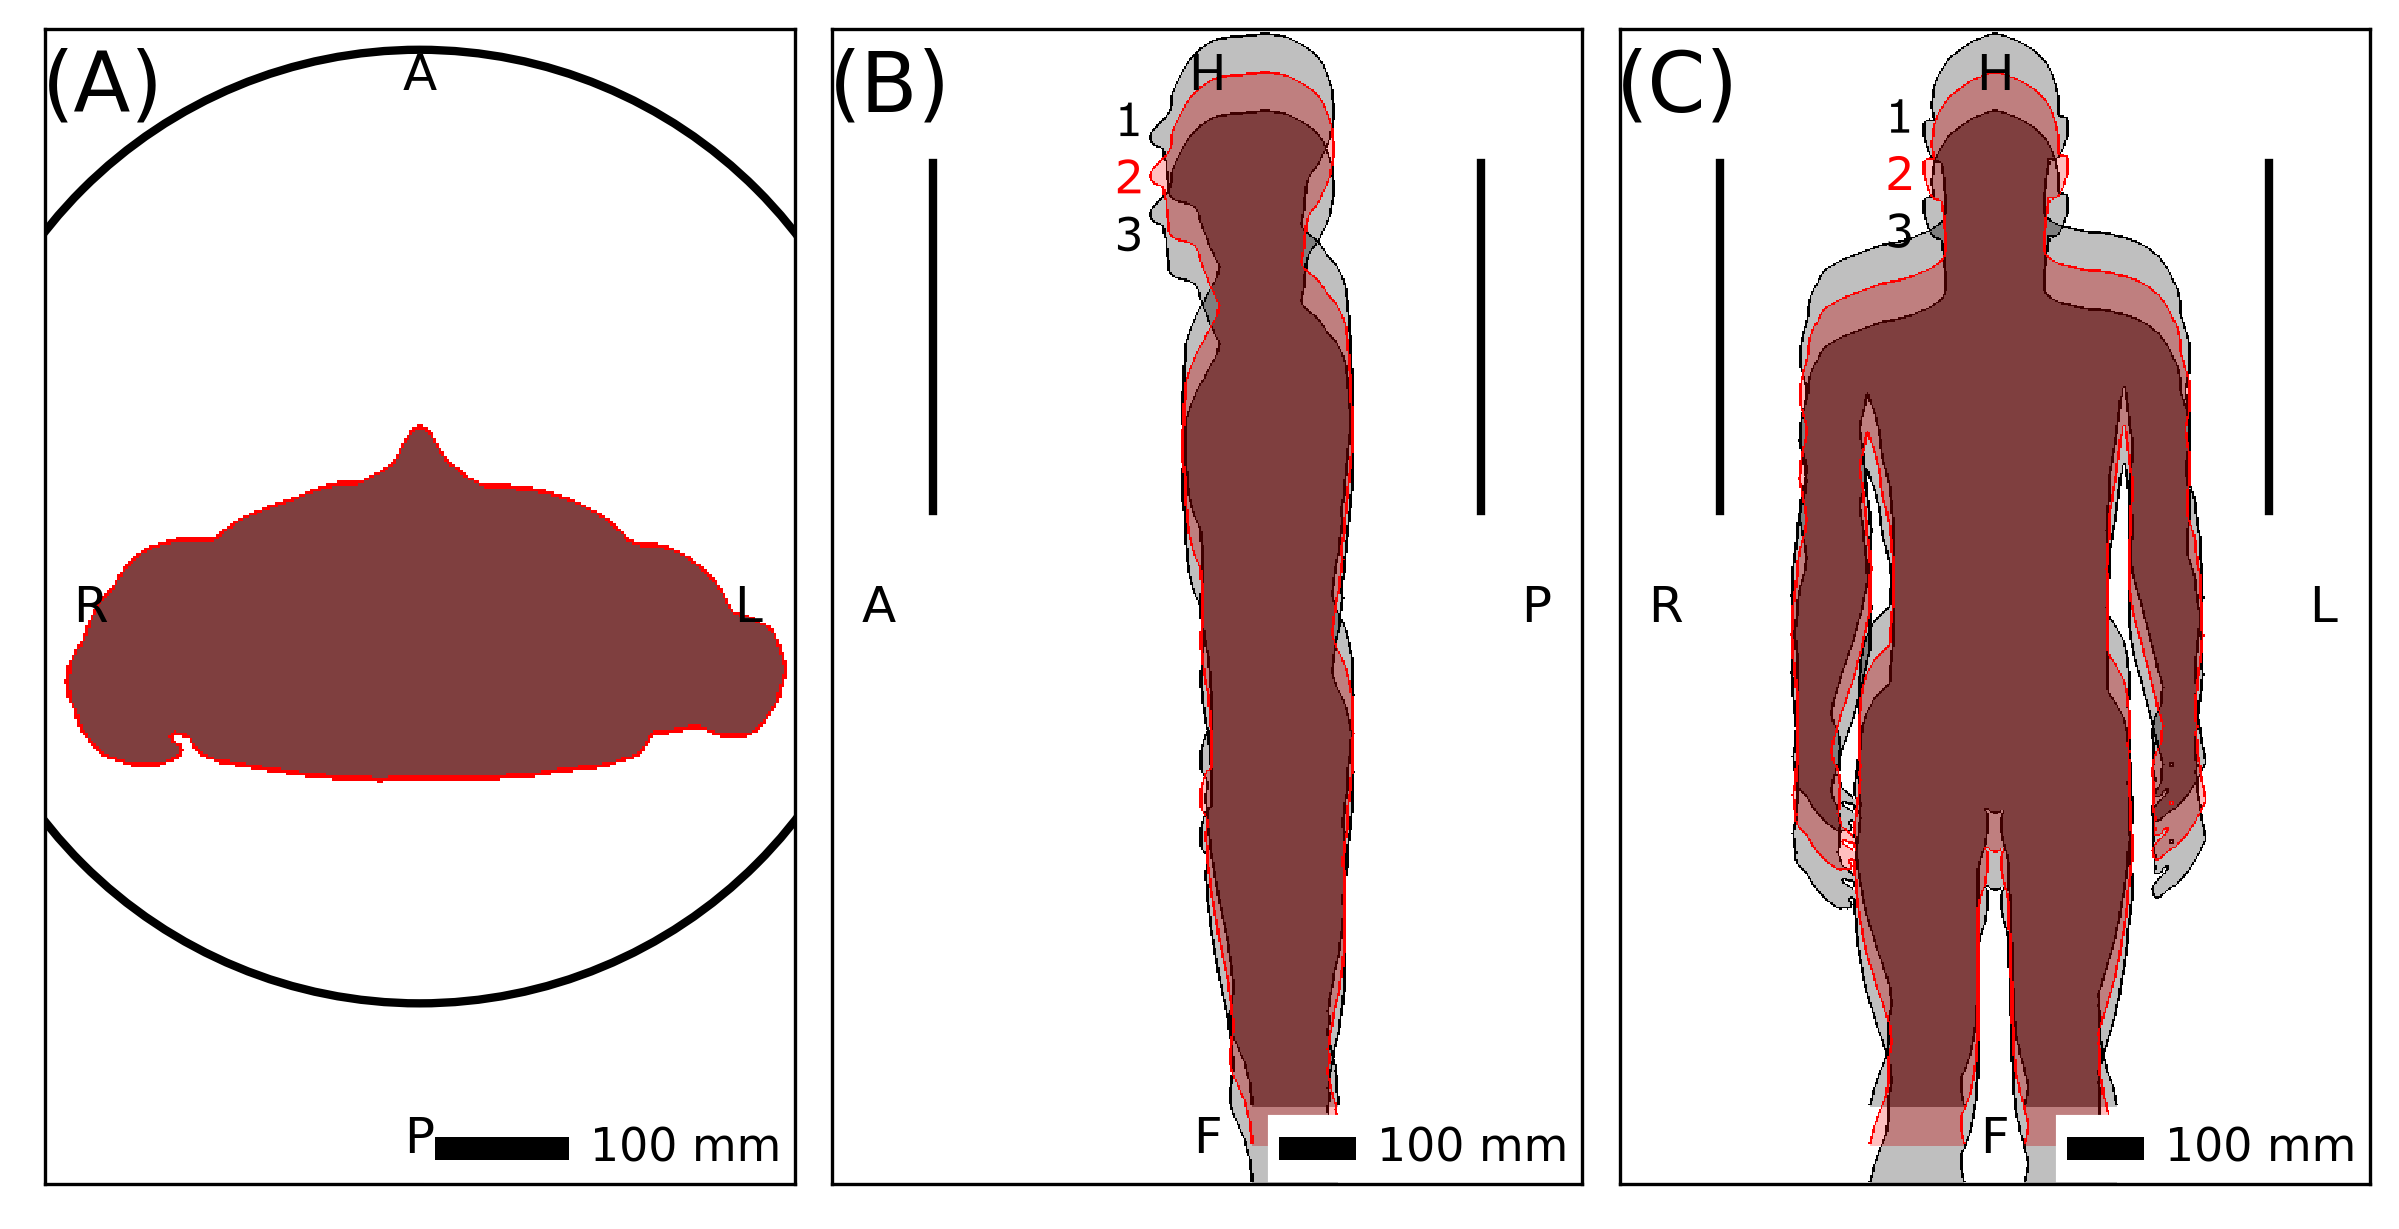
Fig. 3. Positions
of Duke used to assess robustness for interpolation and extrapolation.
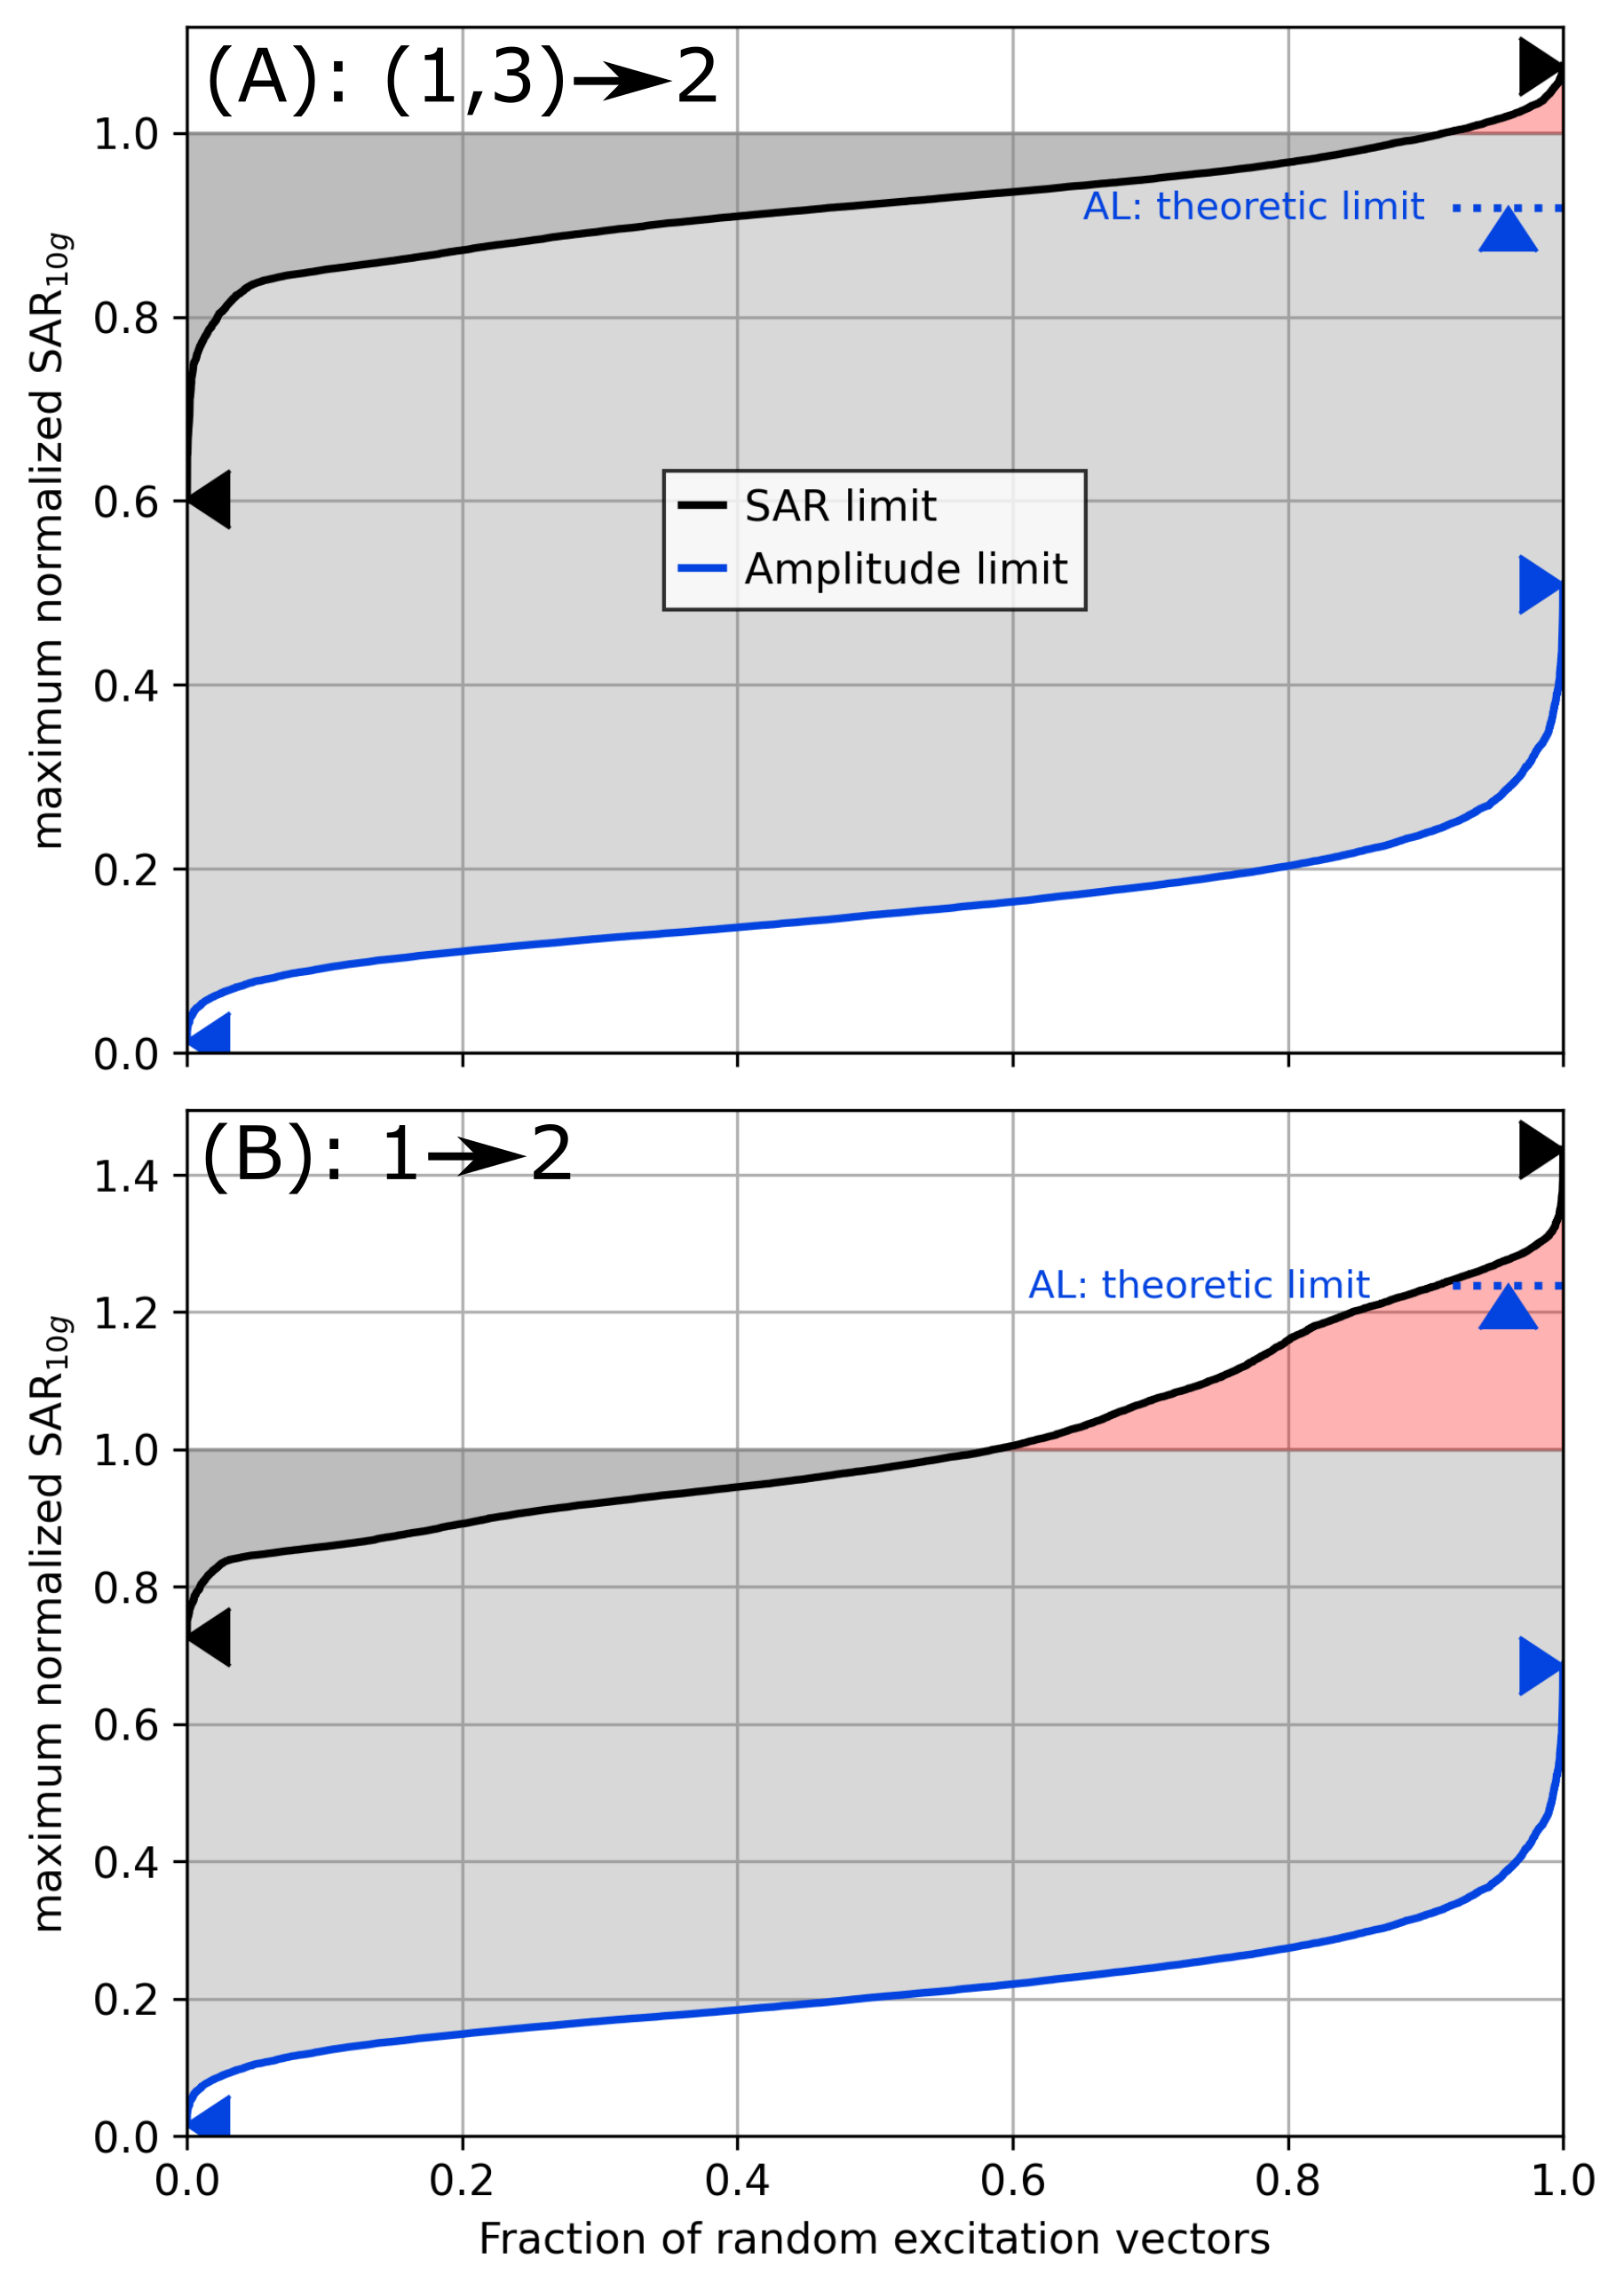
Fig. 4. A) Sweep
analysis of SAR-limit (SL, black) and amplitude limit (AL, blue) of human voxel
model Duke in center position using interpolation from two anchor simulations shifted by ∆z=±50 mm (cf. Fig. 3). 10000 random excitation vectors are scaled
to satisfy the anchor limits. A maximum normalized SAR > 1 (red) is unsafe,
a normalized SAR < 1 (gray) wastes B1+ performance. AL is more conservative
than SL. B) Corresponding curves if extrapolation from only one anchor simulation at ∆z=+50 mm is used.
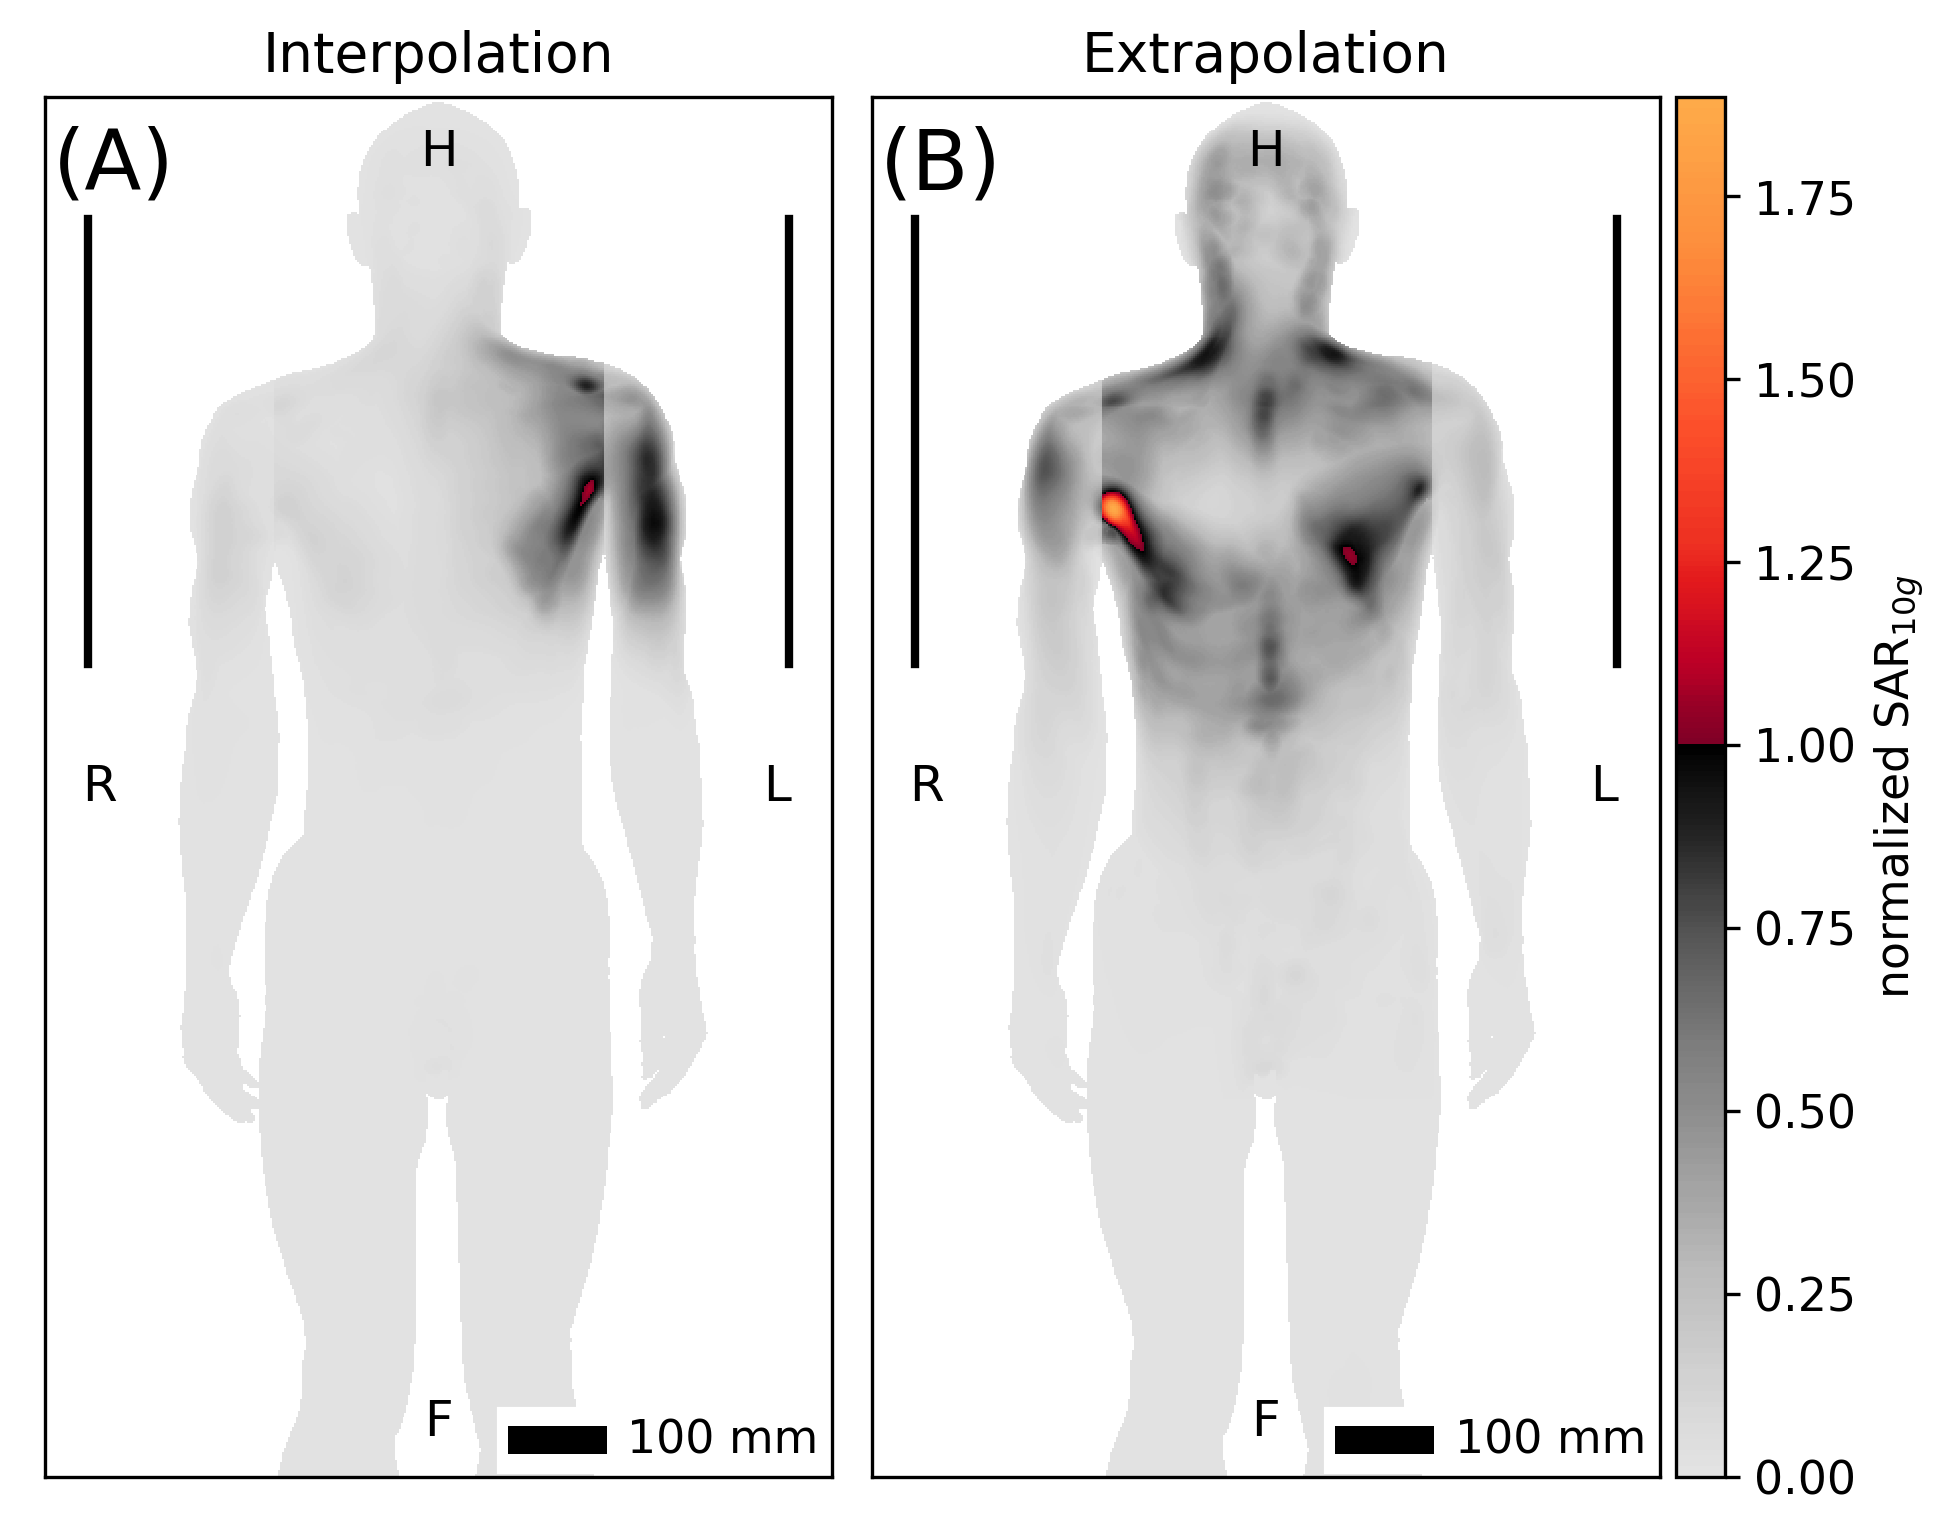
Fig. 5. Worst
case excitations of SAR limit for human voxel model Duke. A) Interpolation from
anchor simulations shifted by ∆z=±50 mm. B) Extrapolation from one anchor
simulation at ∆z=+50 mm. Cf. Figs. 3 and 4.