2474
Sensitivity to WM injury in SLE assessed by diffusion MRI: influence of field strength, acquisition approach and post-processing strategy1Diagnostic Radiology, Lund University, Lund, Sweden, 2Division of Anaesthesia, University of Cambridge, Cambridge, United Kingdom, 3Department of Computing, Imperial College London, London, United Kingdom, 4Department of Medical Radiation Physics, Lund University, Lund, Sweden, 5Russell H. Morgan Department of Radiology and Radiological Science, Johns Hopkins University, Baltimore, MD, United States, 6MRC Cognition and Brain Sciences Unit, University of Cambridge, Cambridge, United Kingdom, 7Lund University BioImaging Center, Lund University, Lund, Sweden, 8Department of Medical Imaging and Physiology, Skane University Hospital, Lund, Sweden
Synopsis
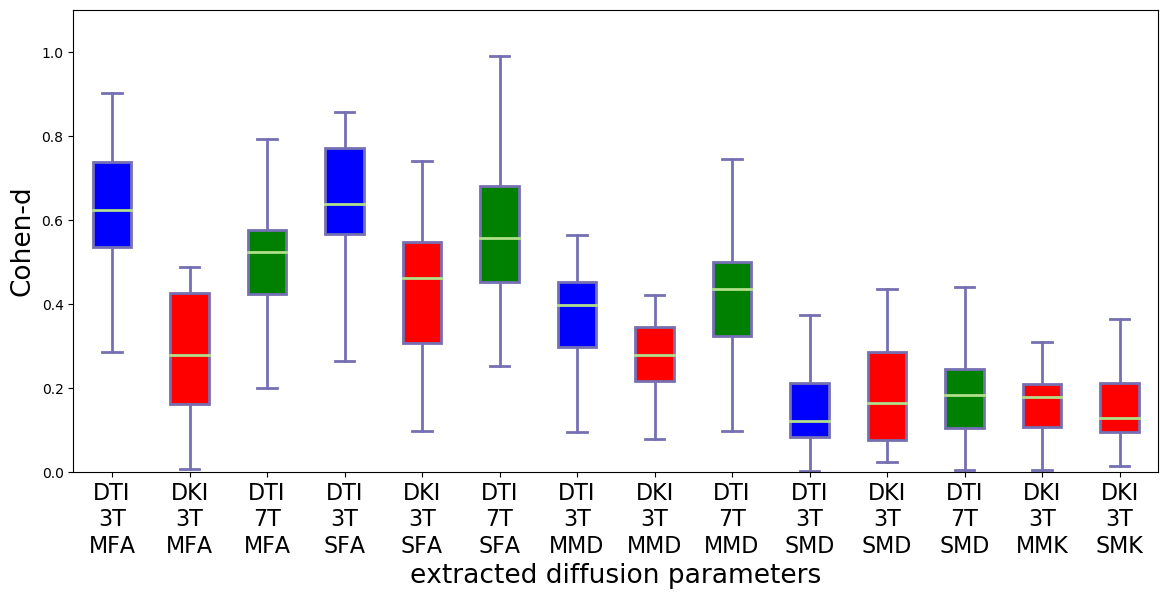
There are many ways to acquire and process diffusion MRI data. However, it is not known which yields the largest effect sizes in group studies. We evaluated the impact of different acquisitions (3T versus 7T and DTI versus DKI) and post-processing strategies (motion correction, Gibbs-ringing and denoising) on effect size estimates of white matter (WM) injury in patients with Systemic Lupus Erythematosus (SLE). Results showed that fractional anisotropy (FA) from a 3T DTI acquisition yielded the largest effect sizes.
Introduction
Diffusion Tensor Imaging (DTI) and Diffusion Kurtosis Imaging (DKI) can detect subtle WM changes due to aging1-2, injury3 and Alzheimer's disease4. However, it is unknown which of the two is more sensitive to tissue microstructure alterations. In Zhu et al.5 DTI and DKI have given similar effect size results, but they were only evaluated on a WM skeleton. Comparisons on more anatomically reliable structures such as the WM fiber tracts were undertaken but limited to human controls (HC)6 and in a small number of patients7. Moreover, the impact of a higher magnetic field strength on the sensitivity to WM injury has so far not been investigated in patients8. In this study, we evaluate two types of diffusion acquisition (DTI versus DKI) and two field strengths (3T versus 7T), along with various state-of-the-art post-processing pipelines, with the goal of determining which yields highest effect sizes when comparing diffusion parameters in WM tracts between patients with SLE and HC.Methods
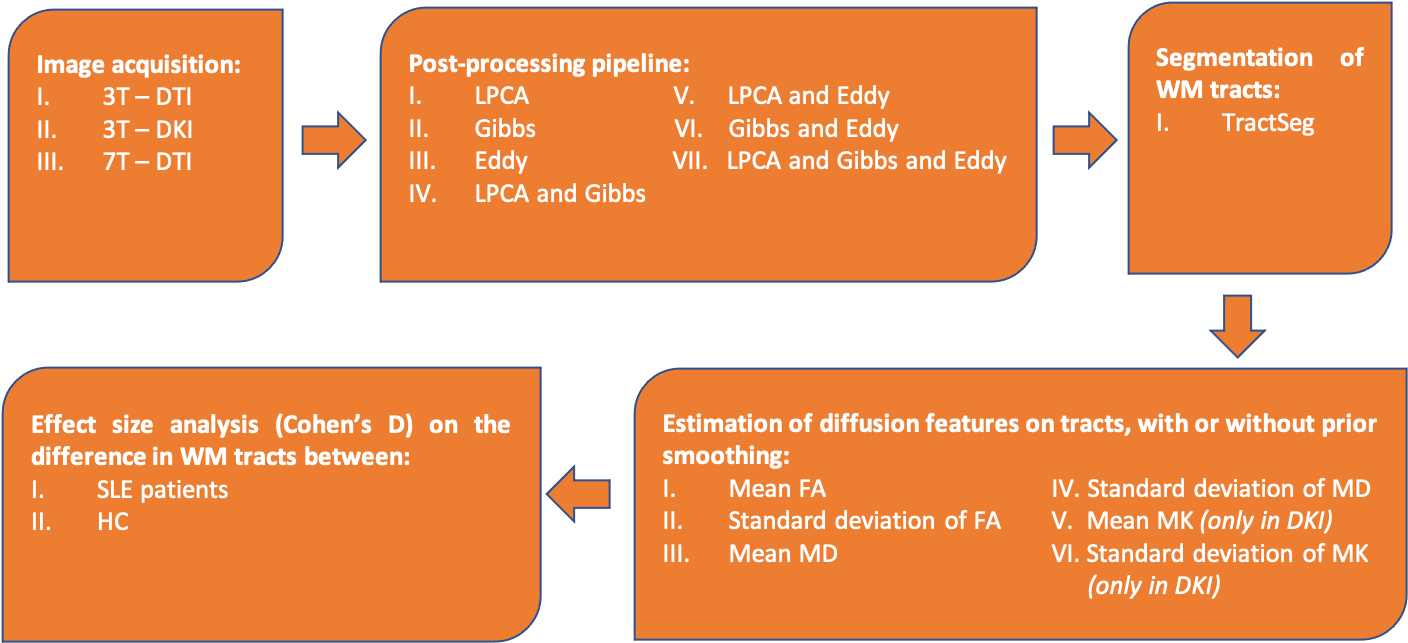
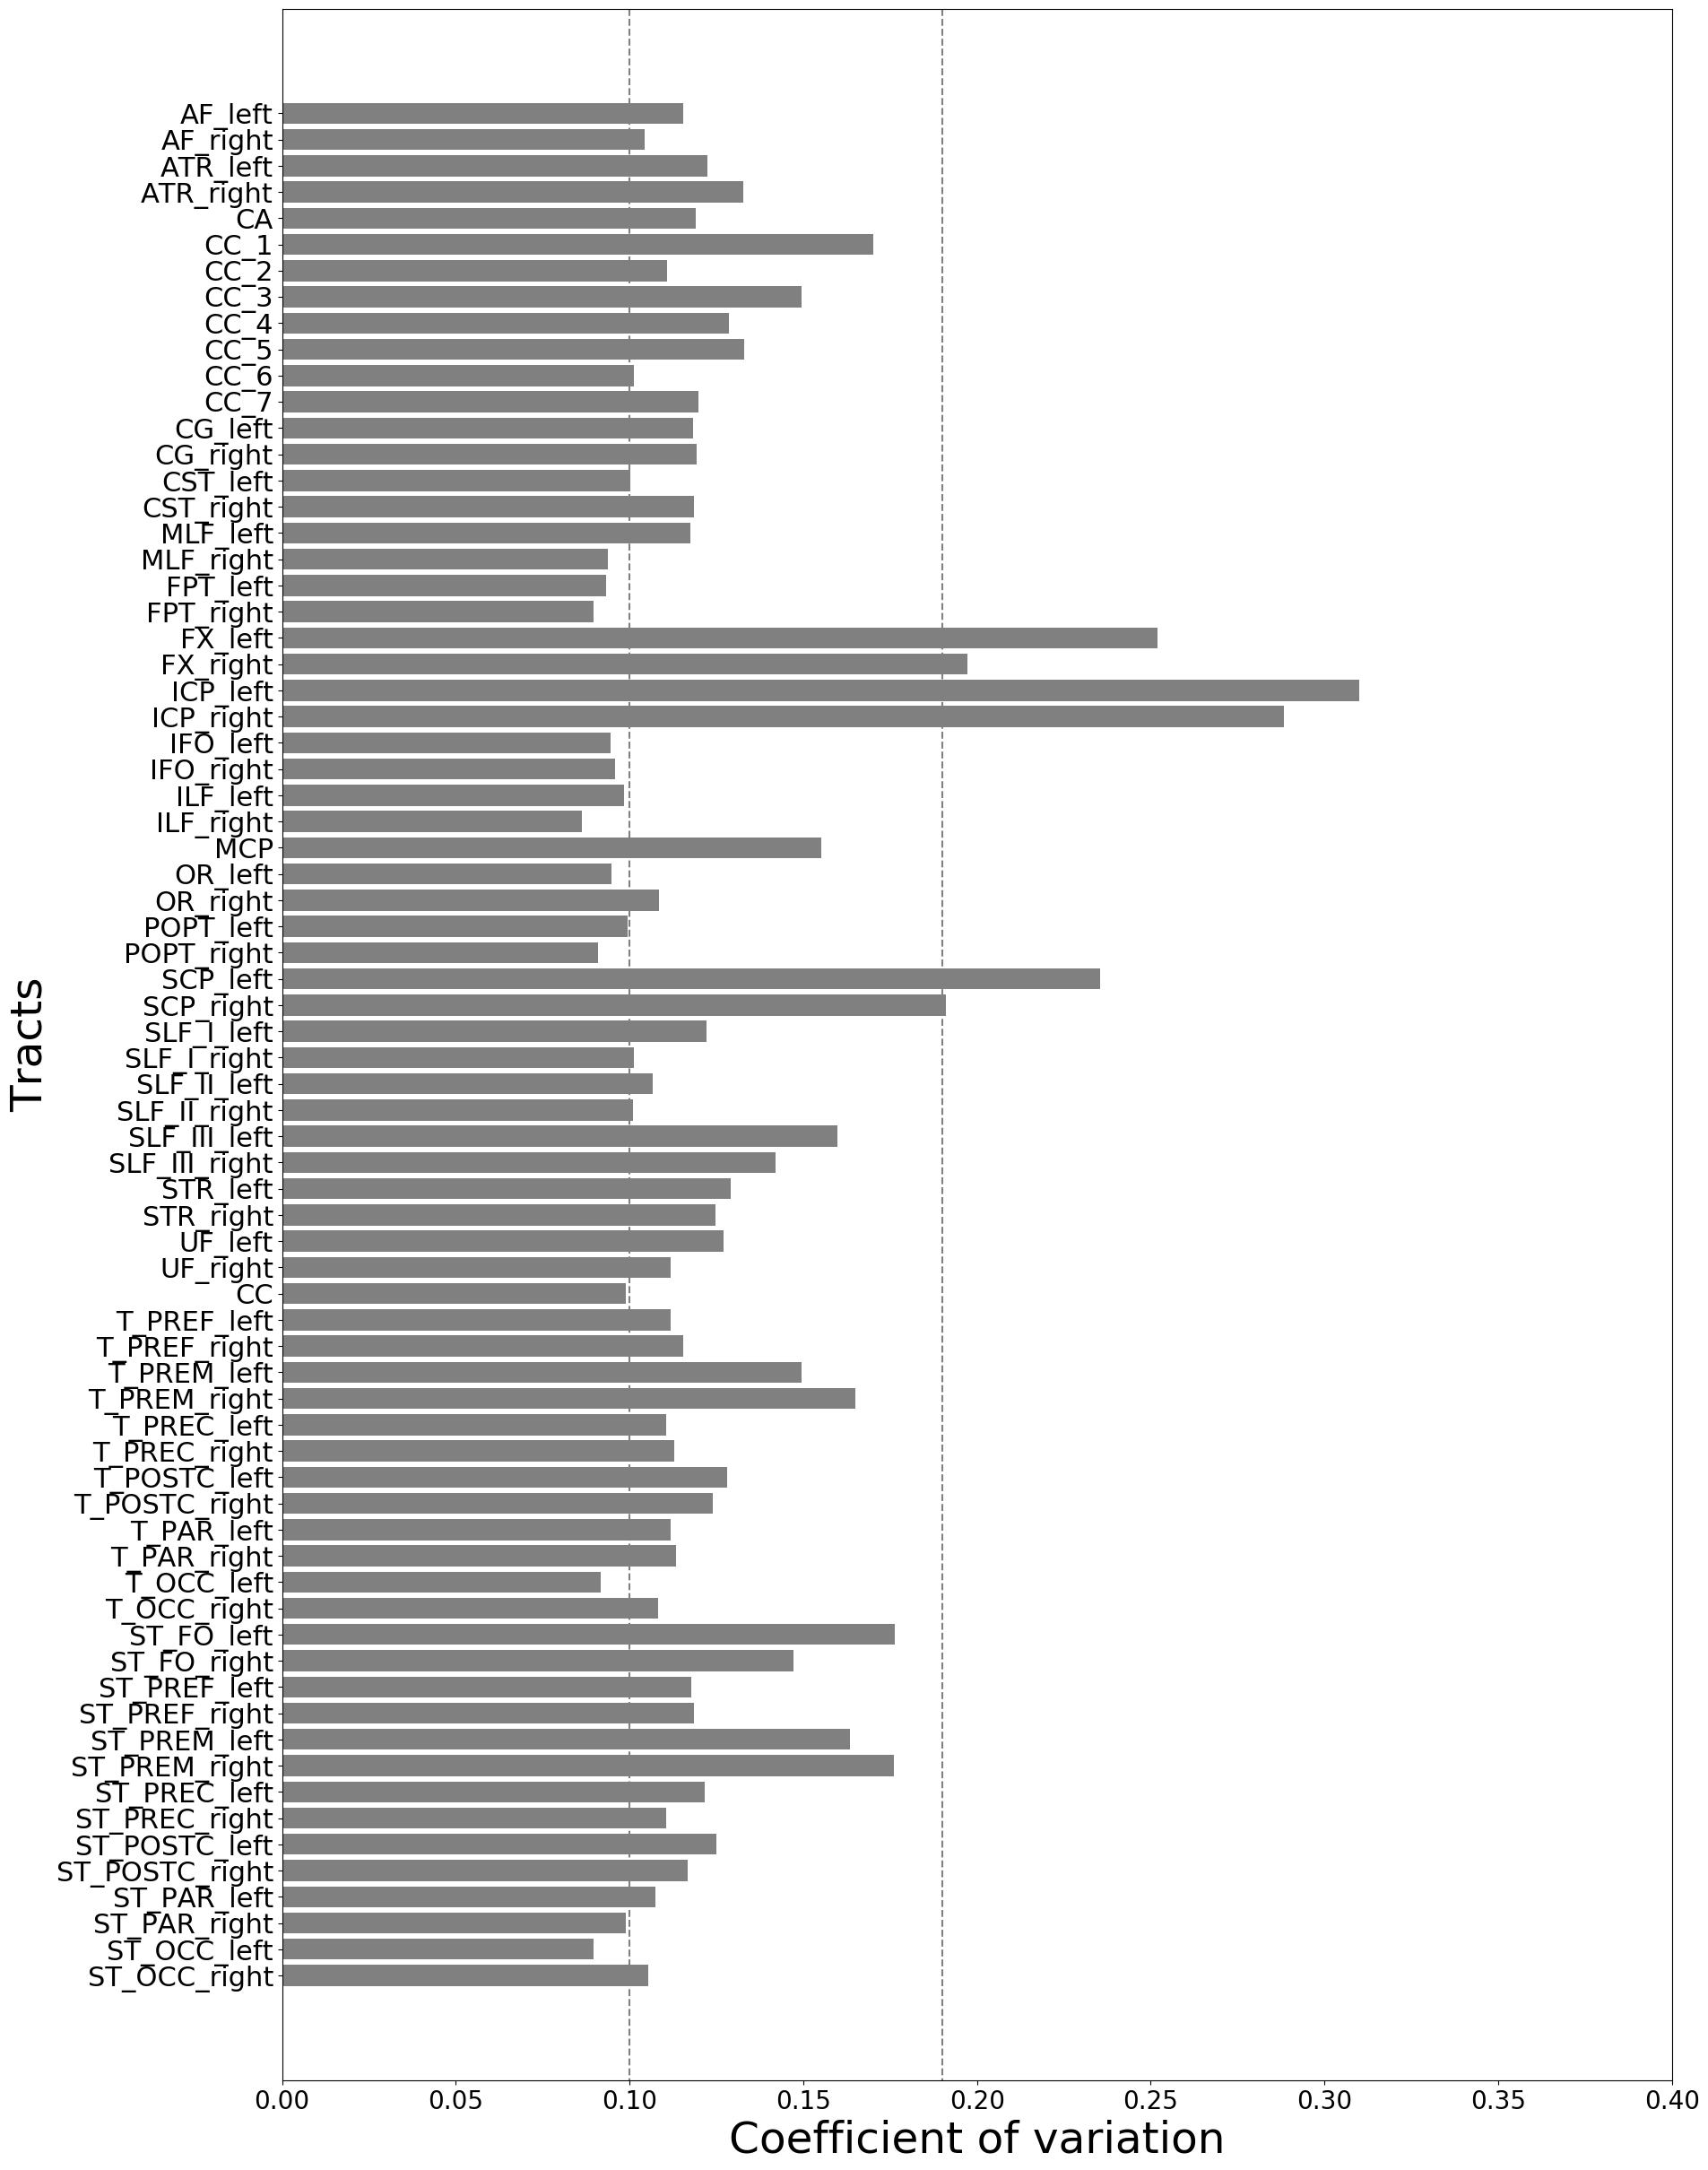
The impact of field strength and acquisition protocol was investigated by analysing two datasets: 75 SLE patients and 21 HC were scanned on a 3T Siemens Skyra, while 62 SLE patients and 27 HC were scanned at a 7T Philips Achieva system. The 3T data were acquired with two protocols (3T-DTI and 3T-DKI), while the 7T data were acquired with one protocol (7T-DTI). The 3T-DTI acquisition was performed with TR/TE=7300/73 ms/ms, a resolution of 2x2x2 mm3, and diffusion encoding with a b-value of 0 and 1000 in eight and 64 directions, respectively. The 3T-DKI acquisition was performed with TR/TE=7500/103 ms/ms, a resolution of 2.3x2.3x2.3 mm3, and diffusion encoding with b-values of 0, 250, 500, 1000, and 2750 s/mm2 applied in 3, 6, 6, 20, and 30 directions, respectively. The 7T-DTI acquisition was performed with TR/TE=8816/62 ms/ms, a resolution of 2x2x2 mm3, and diffusion encoding with a b-value of 0 and 1000 in three and 30 directions, respectively.To test the impact of post-processing choices, three different modules (LPCA denoising9, Gibbs-ringing removal10 and Eddy for eddy-current and motion correction11) were combined in seven different ways. An overview of the workflow is shown in Figure 1. TractSeg was applied to segment 72 different WM bundles12, from which different diffusion parameters were extracted. Six out of the seventy-two segmented tracts were excluded for further analysis after a visual inspection and an analysis of the coefficient of variation (Figure 2). We evaluated the impact of Gaussian smoothing on different strengths (sigma ranging from 0.10 to 1.00) on the calculation of the diffusion tensor. Subsequently, diffusion parameters (FA, MD, MK) were extracted and were evaluated in a groupwise analysis between SLE patients and HC, where the effect size was assessed using the Cohen's d metric:
$$d = (u_{HC} - u_{SLE}) / s$$ ,
where u$$$_{HC}$$$ and u$$$_{SLE}$$$ are the mean values of the diffusion parameter within the tract for the HC and SLE populations respectively, and s = $$$\sqrt{((n_{HC} - 1){s_{HC}}^2 + (n_{SLE} - 1){s_{SLE}}^2) / (n_{HC} + n_{SLE} - 2)}$$$ is the pooled standard deviation of the two populations. Moreover, n$$$_{HC}$$$ and n$$$_{SLE}$$$ are the size and s$$$_{HC}^2$$$ and s$$$_{SLE}^2$$$ the variance for the HC and SLE populations, respectively.
Results
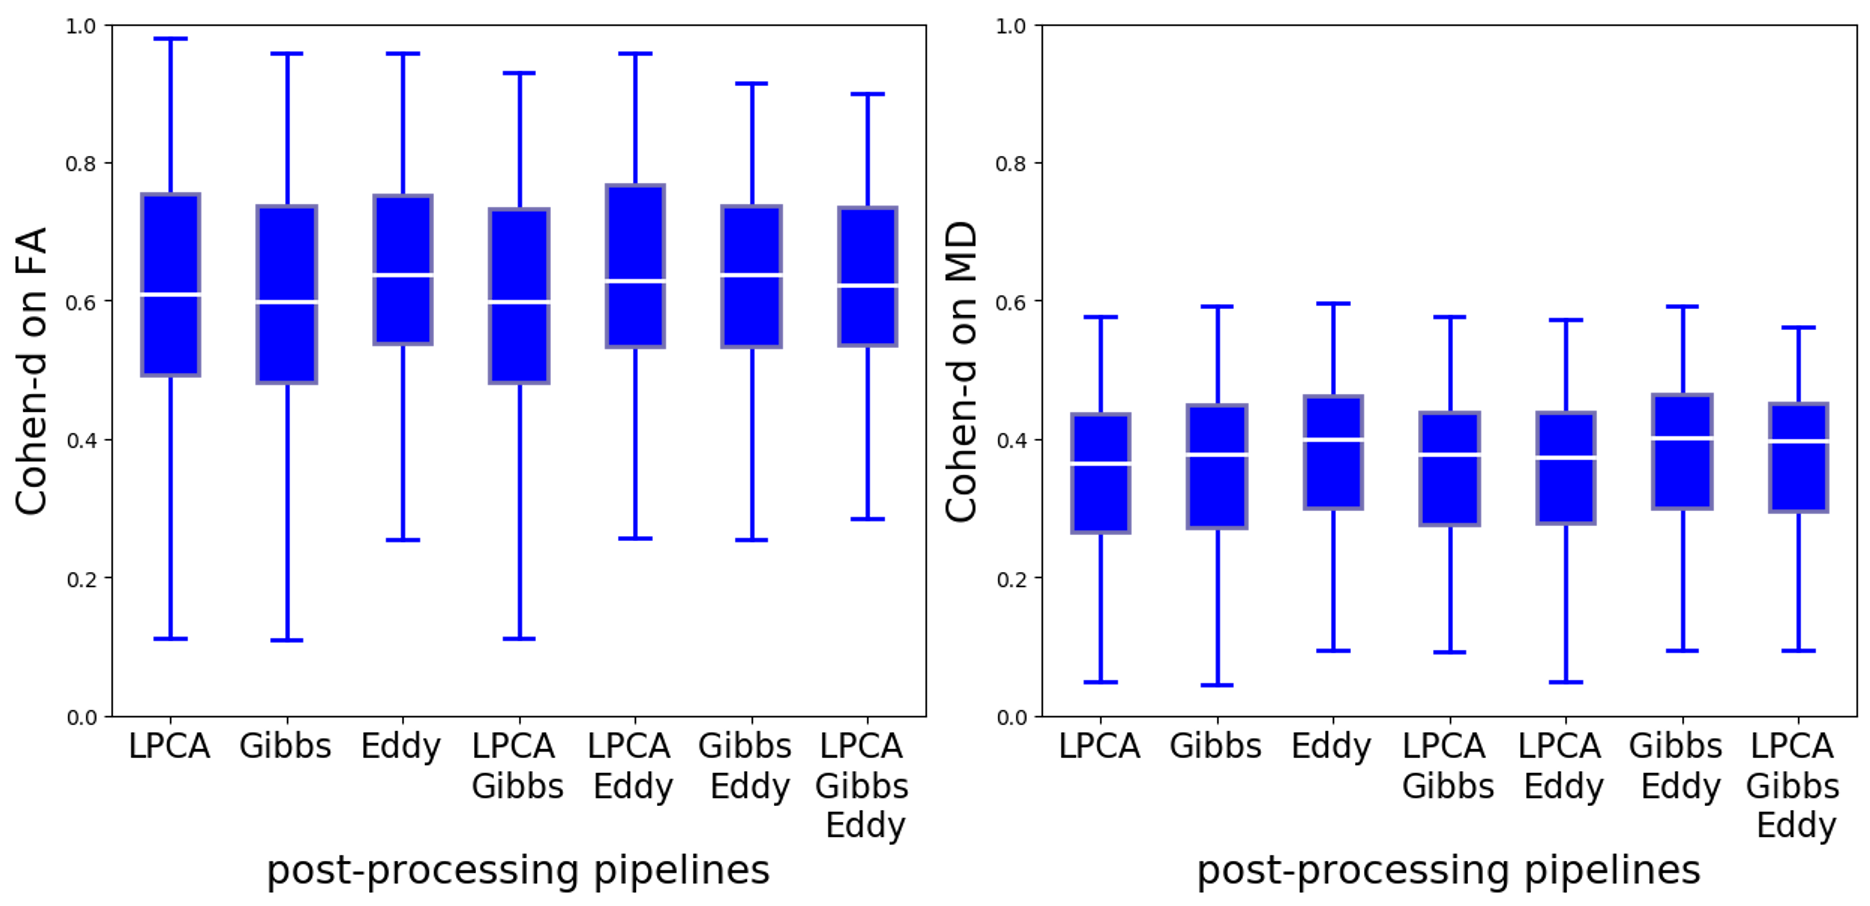
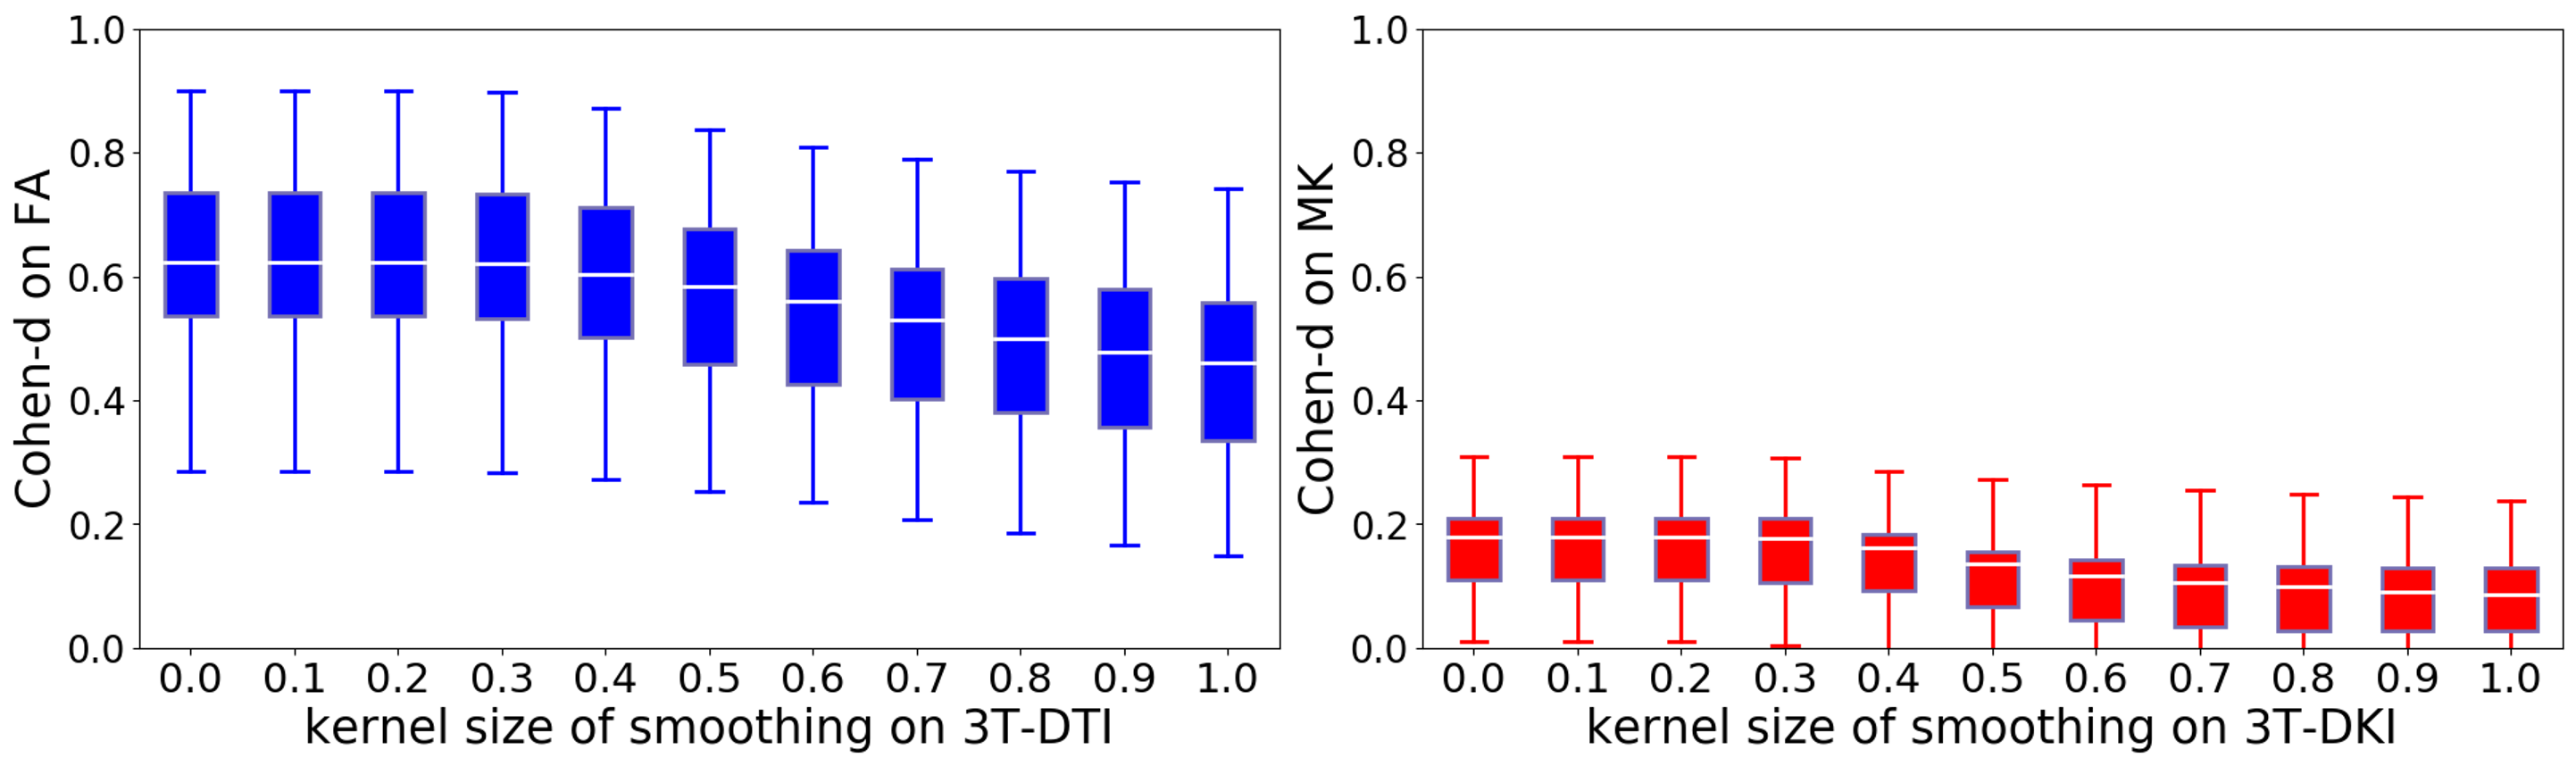
Different post-processing pipelines yielded different effect sizes, and this is illustrated in Figure 3 for FA and MD from 3T-DTI. Eddy was the post-processing step that contributed the most to increasing the average effect size. The observation held also for parameters obtained from 3T-DKI and 7T-DTI. In the cases where Eddy did not increase the effect size, no other method was superior. Figure 4 shows the effect of smoothing data prior to parameter estimation by a DTI or a DKI pipeline. Smoothing did not increase effect sizes. On the contrary, it declined as sigma grew larger than 0.4. This pattern was similar for all parameters and all protocols. Figure 5 gives an overview of effect sizes for the different field strengths and acquisition protocols. Results show a higher effect size for 3T-DTI compared to 3T-DKI or 7T-DTI, for both FA or MD. Comparing FA, MD and MK, we see that the FA yielded the highest effect sizes. Based on the samples' sizes, an effect size lower than 0.4 is considered non-significant in this study.Discussion
We found that 3T-DTI yielded higher effect sizes than both 7T-DTI and 3T-DTI. Whether this observation holds for diseases other than SLE can be discussed. A similar observation when comparing DTI with DKI was reported7. On the other hand, 7T was found advantageous over 3T in Choi et al.8, but the sample size (11 HC) was too small. It can also be discussed what aspect of the DKI acquisition led to lower effect sizes. It may have been the lower resolution by which DKI was acquired, because synthetically reducing the resolution by smoothing led to lower effect sizes. Moreover, the voxel size has been assessed as a source of bias in FA and MD reproducibility, greater than the diffusion protocol13. The observation that 7T-DTI had lower effect sizes than 3T-DTI may have been influenced by the slight sample difference between the two acquisitions.Conclusion
3T-DTI is the preferable choice to study the differences between SLE patients' and HC's WM microstructure.Acknowledgements
The study was supported by funding by Regional Research Funds (RegSkane-824651) (PSCS), SUS Foundation and Donations funds (PSCS), Alfred Osterlund Foundation (PCS), Swedish Rheumatism Association R-568371 (PCS), King Gustaf V's 80-year Foundation (FAI-2019-0559) (PCS).References
1. J.-P. Coutu, J. J. Chen, H. D. Rosas, D. H. Salat, Non-gaussian water diffusion in aging white matter, Neurobiology of aging 35 (6) (2014) 1412–1421.
2. A. Paydar, E. Fieremans, J. Nwankwo, M. Lazar, H. Sheth, V. Adisetiyo, J. Helpern, J. Jensen, S. Milla, Diffusional kurtosis imaging of the developing brain, American Journal of Neuroradiology 35 (4) (2014) 808–814.
3. J. A. Stokum, C. Sours, J. Zhuo, R. Kane, K. Shanmuganathan, R. P. Gullapalli, A longitudinal eval- uation of diffusion kurtosis imaging in patients with mild traumatic brain injury, Brain injury 29 (1) (2015) 47–57.
4. Y. Chen, M. Sha, X. Zhao, J. Ma, H. Ni, W. Gao, D. Ming, Automated detection of pathologic white matter alterations in alzheimer’s disease using combined diffusivity and kurtosis method, Psychiatry Research: Neuroimaging 264 (2017) 35–45.
5. J. Zhu, C. Zhuo, W. Qin, D. Wang, X. Ma, Y. Zhou, C. Yu, Performances of diffusion kurtosis imaging and diffusion tensor imaging in detecting white matter abnormality in schizophrenia, NeuroImage: Clinical 7 (2015) 170–176.
6. G. R. Glenn, L.-W. Kuo, Y.-P. Chao, C.-Y. Lee, J. A. Helpern, J. H. Jensen, Mapping the orientation of white matter fiber bundles: a comparative study of diffusion tensor imaging, diffusional kurtosis imaging, and diffusion spectrum imaging, American Journal of Neuroradiology 37 (7) (2016) 1216–1222.
7. M. C. G. Kimura, T. M. Doring, F. C. Rueda, G. Tukamoto, E. L. Gasparetto, In vivo assessment of white matter damage in neuromyelitis optica: a diffusion tensor and diffusion kurtosis mr imaging study, Journal of the neurological sciences 345 (1-2) (2014) 172–175.
8. S. Choi, D. T. Cunningham, F. Aguila, J. D. Corrigan, J. Bogner, W. J. Mysiw, M. V. Knopp, P. Schmal- brock, Dti at 7 and 3 t: systematic comparison of snr and its influence on quantitative metrics, Magnetic resonance imaging 29 (6) (2011) 739–751.
9. J. V. Manjón, P. Coupé, L. Concha, A. Buades, D. L. Collins, M. Robles, Diffusion weighted image denoising using overcomplete local pca, PloS one 8 (9) (2013) e73021.
10. E. Kellner, B. Dhital, V. G. Kiselev, M. Reisert, Gibbs-ringing artifact removal based on local subvoxel- shifts, Magnetic resonance in medicine 76 (5) (2016) 1574–1581.
11. J. L. Andersson, S. N. Sotiropoulos, An integrated approach to correction for off-resonance effects and subject movement in diffusion mr imaging, Neuroimage 125 (2016) 1063–1078.
12. J. Wasserthal, P. Neher, K. H. Maier-Hein, Tractseg-fast and accurate white matter tract segmentation, NeuroImage 183 (2018) 239–253.
13. N. D. Papinutto, F. Maule, J. Jovicich, Reproducibility and biases in high field brain diffusion mri: Anevaluation of acquisition and analysis variables, Magnetic resonance imaging 31 (6) (2013) 827–839.
Figures