2471
Data-driven separation of MRI signal components for tissue characterization1Department of Health Technology, Technical University of Denmark, Kgs. Lyngby, Denmark, 2Danish Research Centre for Magnetic Resonance, Centre for Functional and Diagnostic Imaging and Research, Copenhagen University Hospital Hvidovre, Hvidovre, Denmark, 3Department of Applied Mathematics and Computer Science, Technical University of Denmark, Kgs. Lyngby, Denmark, 4Laboratory of Radiation Physics, Odense University Hospital, Odense, Denmark, 5Department of Clinical Research, University of Southern Denmark, Odense, Denmark
Synopsis
We propose a novel data-driven method for extraction of tissue-related signal components from high-dimensional MRI data. In this method, the standard non-negative matrix factorization (NMF) has been extended with signal monotonicity constraints suitable for several MR signal types, and is termed the monotonous slope NMF (msNMF). Its applications are here demonstrated using both diffusion-weighted and relaxometry data. The msNMF successfully distinguish areas with different cell densities and levels of white matter intra-myelinic edema, respectively, and is potentially useful for diagnosis and therapy evaluation.
Introduction
Quantitative assessment of tissue properties from high-dimensional MRI data requires signal decomposition or appropriate parametrization1,2. Imposing physiological models in data analysis carries the risk of estimating biased parameters. On the other hand, using standard decomposition strategies without presumptive physiological models may result in physically unrealistic components difficult to interpret. This work proposes an extension of the non-negative matrix factorization (NMF), introducing additional constraints on the decomposed signals tailored to MR signals, expected to be of multi-exponential or similar character: the latent signals must be monotonous (inspired by Bhatt and Ayyar3) and have a monotonous first derivative (slope). We present a demonstration of the novel method, referred to as monotonous slope non-negative matrix factorization (msNMF).Methods
The standard NMF approximates a data matrix, $$$\textbf{X}\in\mathbb{R}^{m\times n}$$$, with a low rank matrix consisting of two factors: a set of non-negative basis functions, $$$\textbf{W}\in\mathbb{R}_{+}^{m\times k}$$$ (signal components), and the associated non-negative weights, $$$\textbf{H} \in \mathbb{R}_{+}^{k \times n}$$$ (mixture maps):$$\textbf{X} = \textbf{W}\textbf{H}+\textbf{E}$$
The residual matrix ($$$\textbf{E}\in\mathbb{R}^{m\times n}$$$) accounts for noise and non-factorizable signals. The problem was split into two sub-problems to alternately optimize for one of the two factors using Frobenius norm. In the following equations, the sub-problems have been written via standard quadratic programming3 with the new monotonicity constraints formulated as inequality terms:
$$\text{Given }\textbf{W}:\quad\min_\textbf{H}\text{vec}(\textbf{H})^\mathrm{T}(\textbf{I}_n\otimes \textbf{W}^\mathrm{T}\textbf{W})\text{vec}(\textbf{H})-2 \text{vec}(\textbf{X}^\mathrm{T}\textbf{W})^\mathrm{T}\text{vec}(\textbf{H})\quad\text{subject to: }-\textbf{I}_{nk}\text{vec}(\textbf{H})\leq\textbf{0}_{nk}$$
$$\text{Given } \textbf{H}:\quad\min_\textbf{W}\text{vec}(\textbf{W})^\mathrm{T}(\textbf{HH}^\mathrm{T}\otimes \textbf{I}_m)\text{vec}(\textbf{W})-2\text{vec}(\textbf{XH}^\mathrm{T})^\mathrm{T}\text{vec}(\textbf{W}) \quad\text{subject to: }\begin{bmatrix}-\textbf{I}_{mk}\\ \textbf{A}\\\textbf{B}\end{bmatrix}\text{vec}(\textbf{W})\leq\textbf{0}_{mk}$$
Here, $$$\text{vec()}$$$ is the column vectorization of a matrix and $$$\otimes$$$ is the Kronecker tensor product. $$$\textbf{A}$$$ and $$$\textbf{B}$$$ are designed to ensure monotonous behavior of the signal components and their first derivative, respectively.
Preclinical evaluation
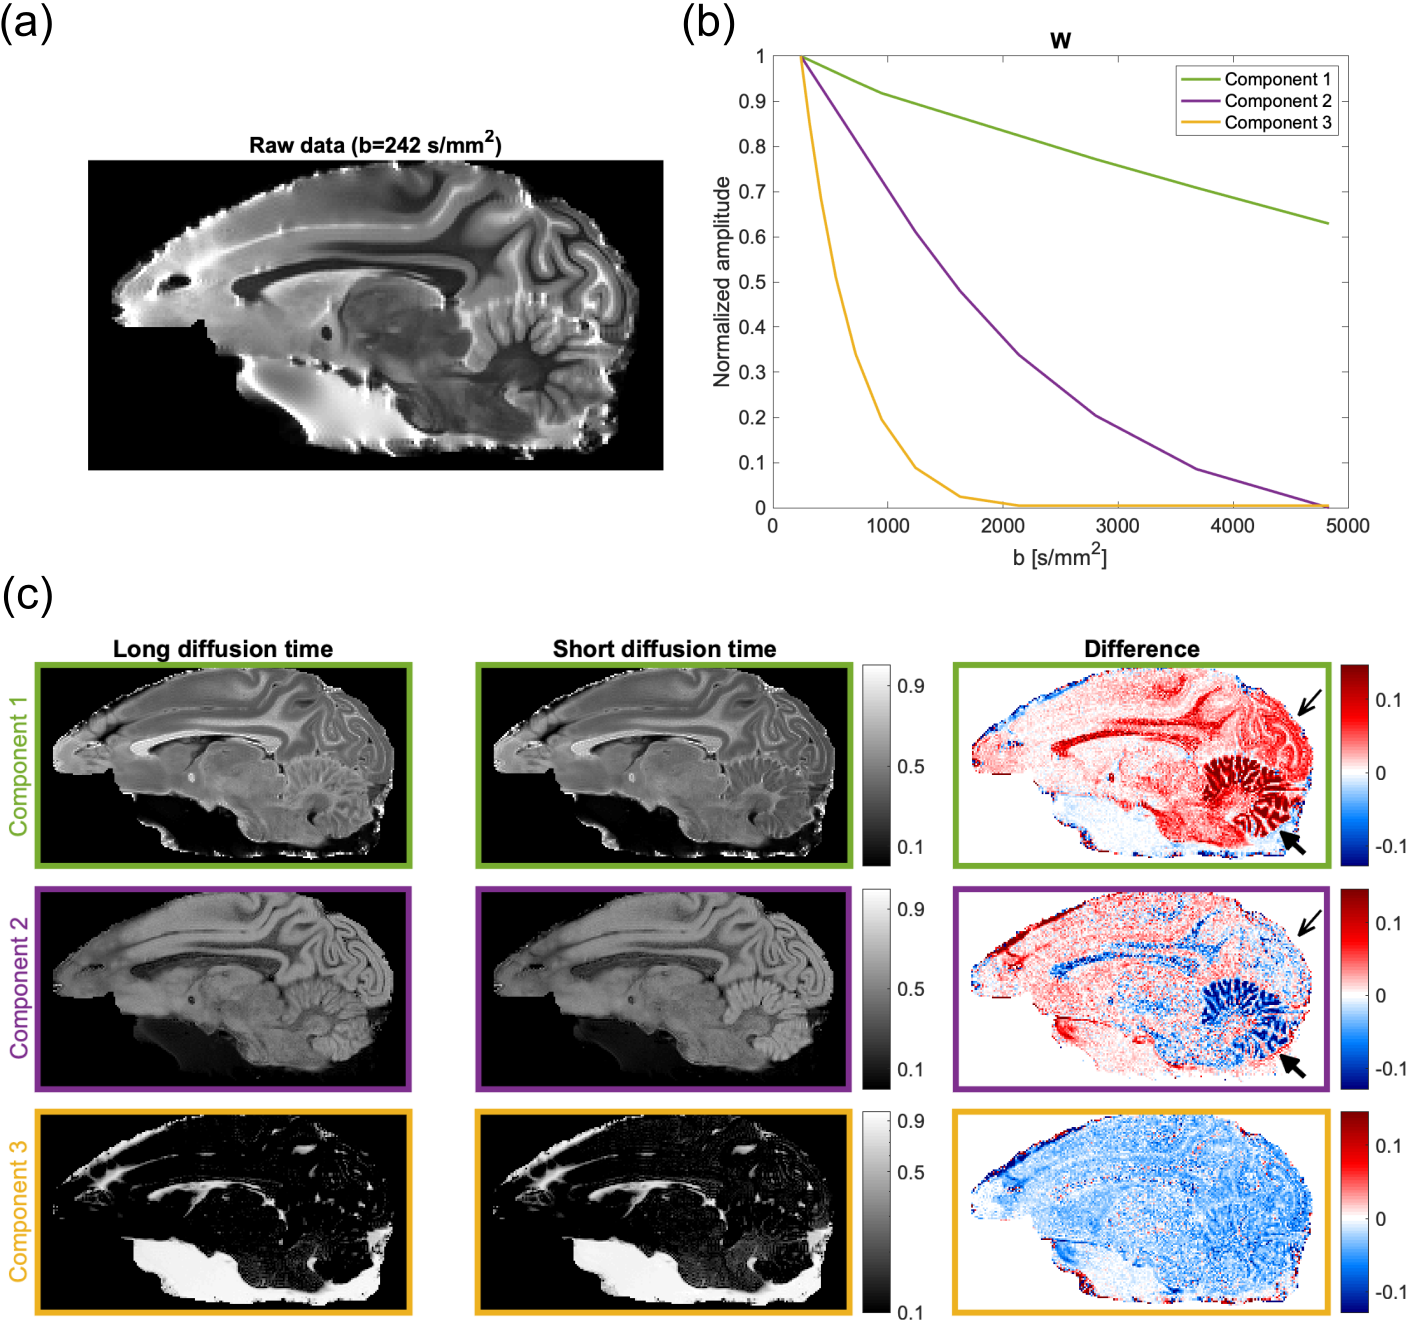
The DWI data (published by Lundell et al4) consists of multi-dimensional diffusion encoding measurements of a post mortem brain of a Vervet monkey in buffer solution. Data was recorded with a 4.7 T pre-clinical MRI-system using TE=68 ms and 12 b-values (range 242-4832 s/mm2). Two acquisitions with a difference in the implemented gradient waveform generated data with an average diffusion time of ~10 ms (short diffusion time) and ~20 ms (long diffusion time), respectively. Comparisons of these should capture the effect of time-dependent diffusion, and hence be reflected in the decomposition.
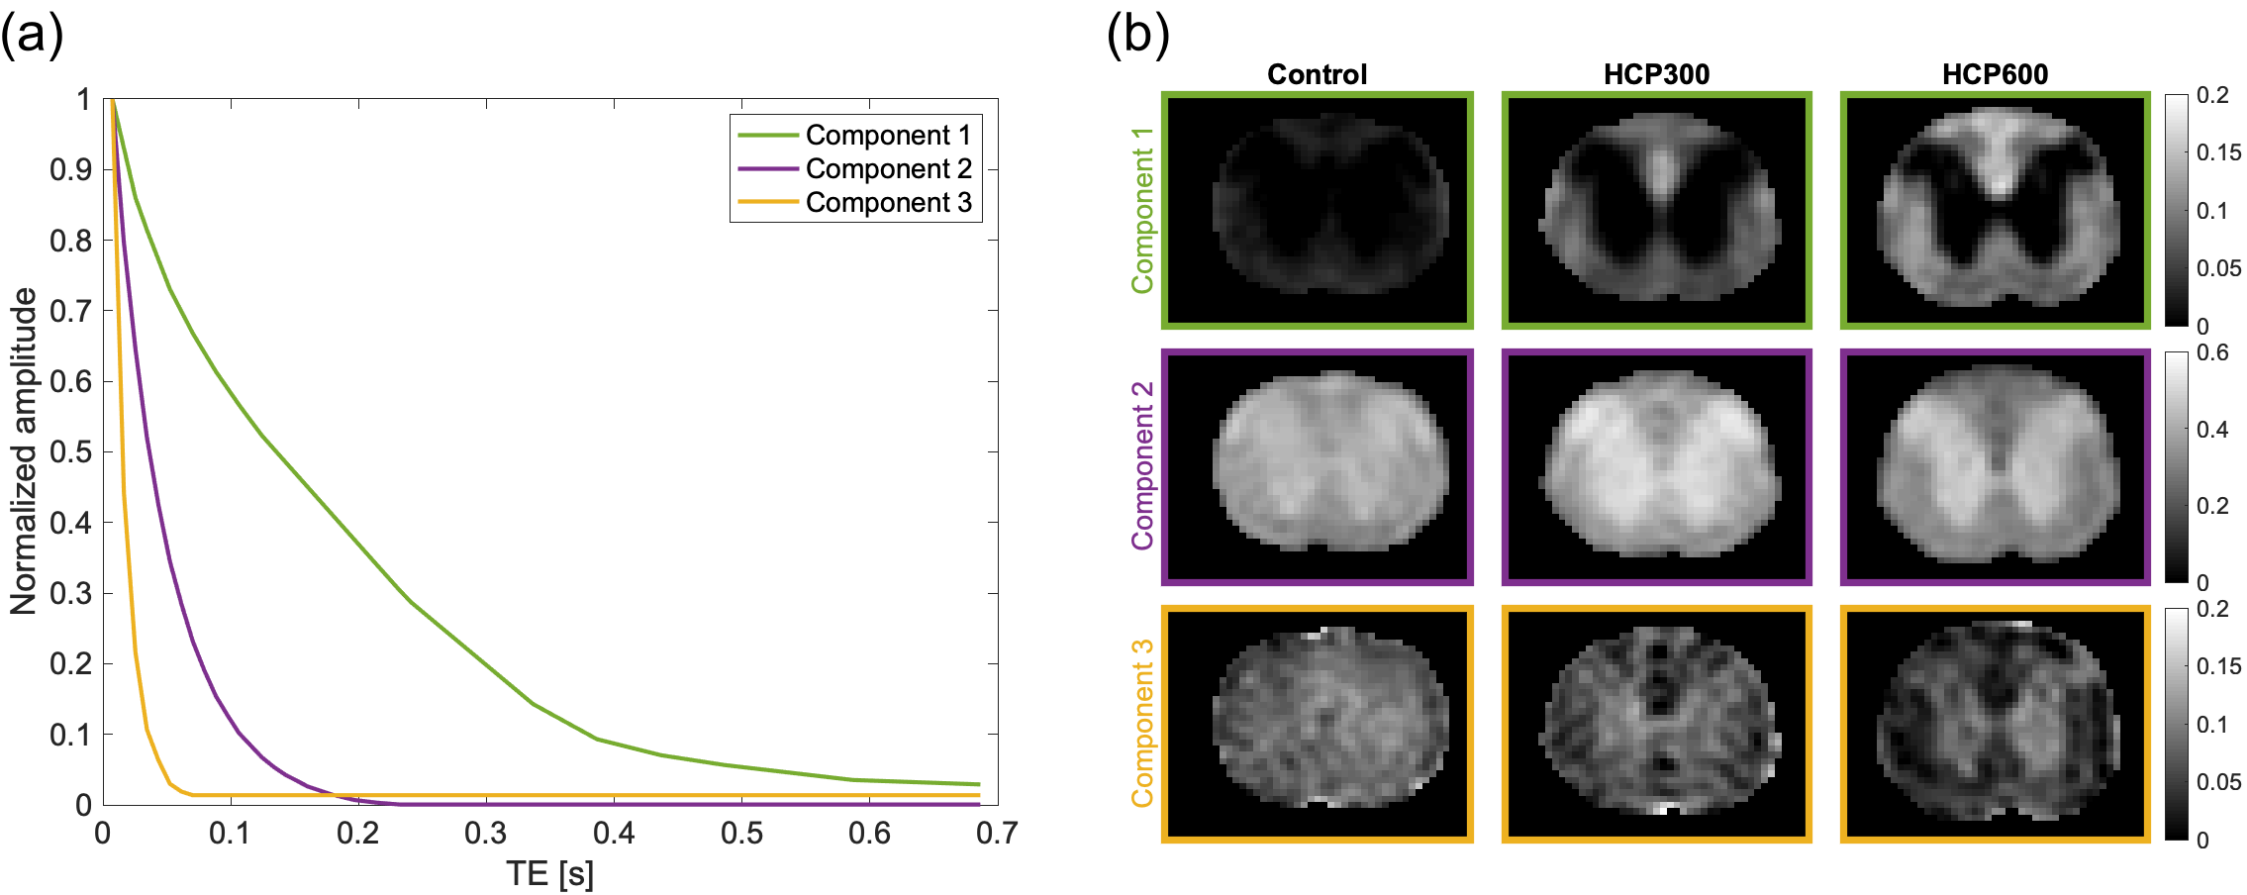
The relaxometry data (Harkins et al5) was originally used to demonstrate intra-myelinic edema (IME) quantification in rat spinal white matter. It consists of multi-echo T2-weighted measurements (40 echoes with 9 ms separation) recorded at 9.4 T for three groups of eight rats, each receiving a different amount of IME-inducing toxin in the diet: 0 ppm, 300 ppm and 600 ppm hexachlorophene (HCP). The data was decomposed into three water components to allow comparison to the reference analysis by Harkins et al and the accompanying histology values.
Results and Discussion
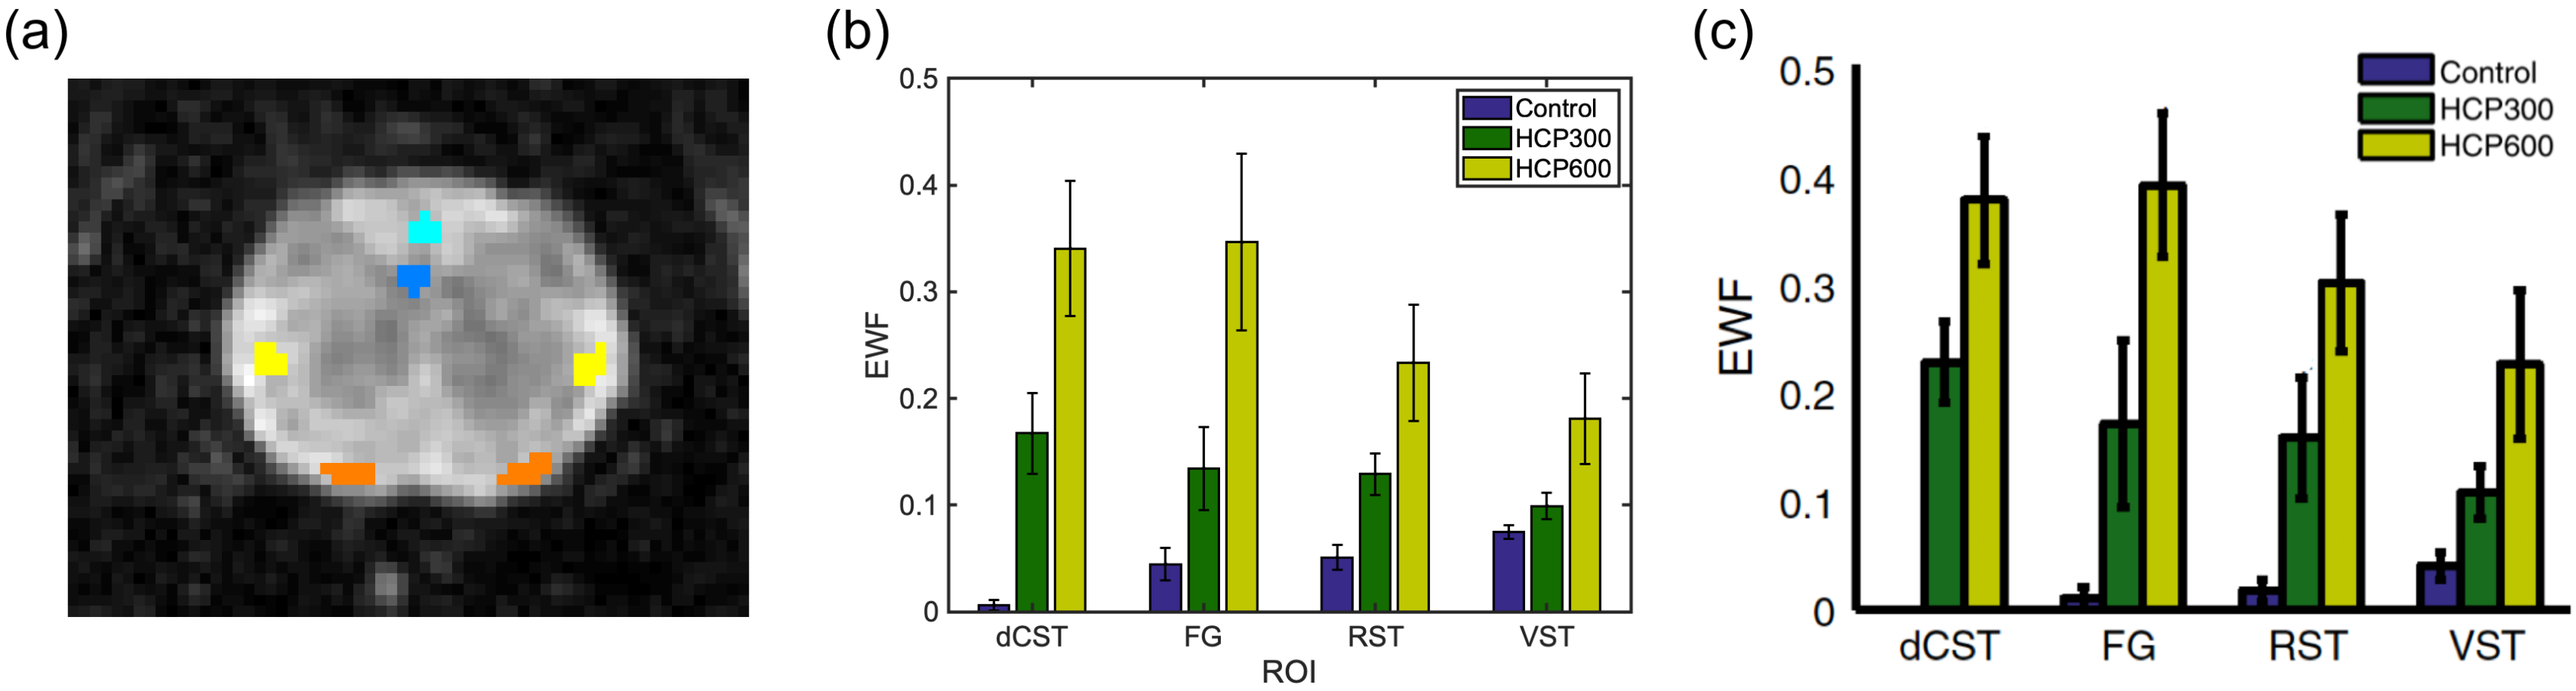
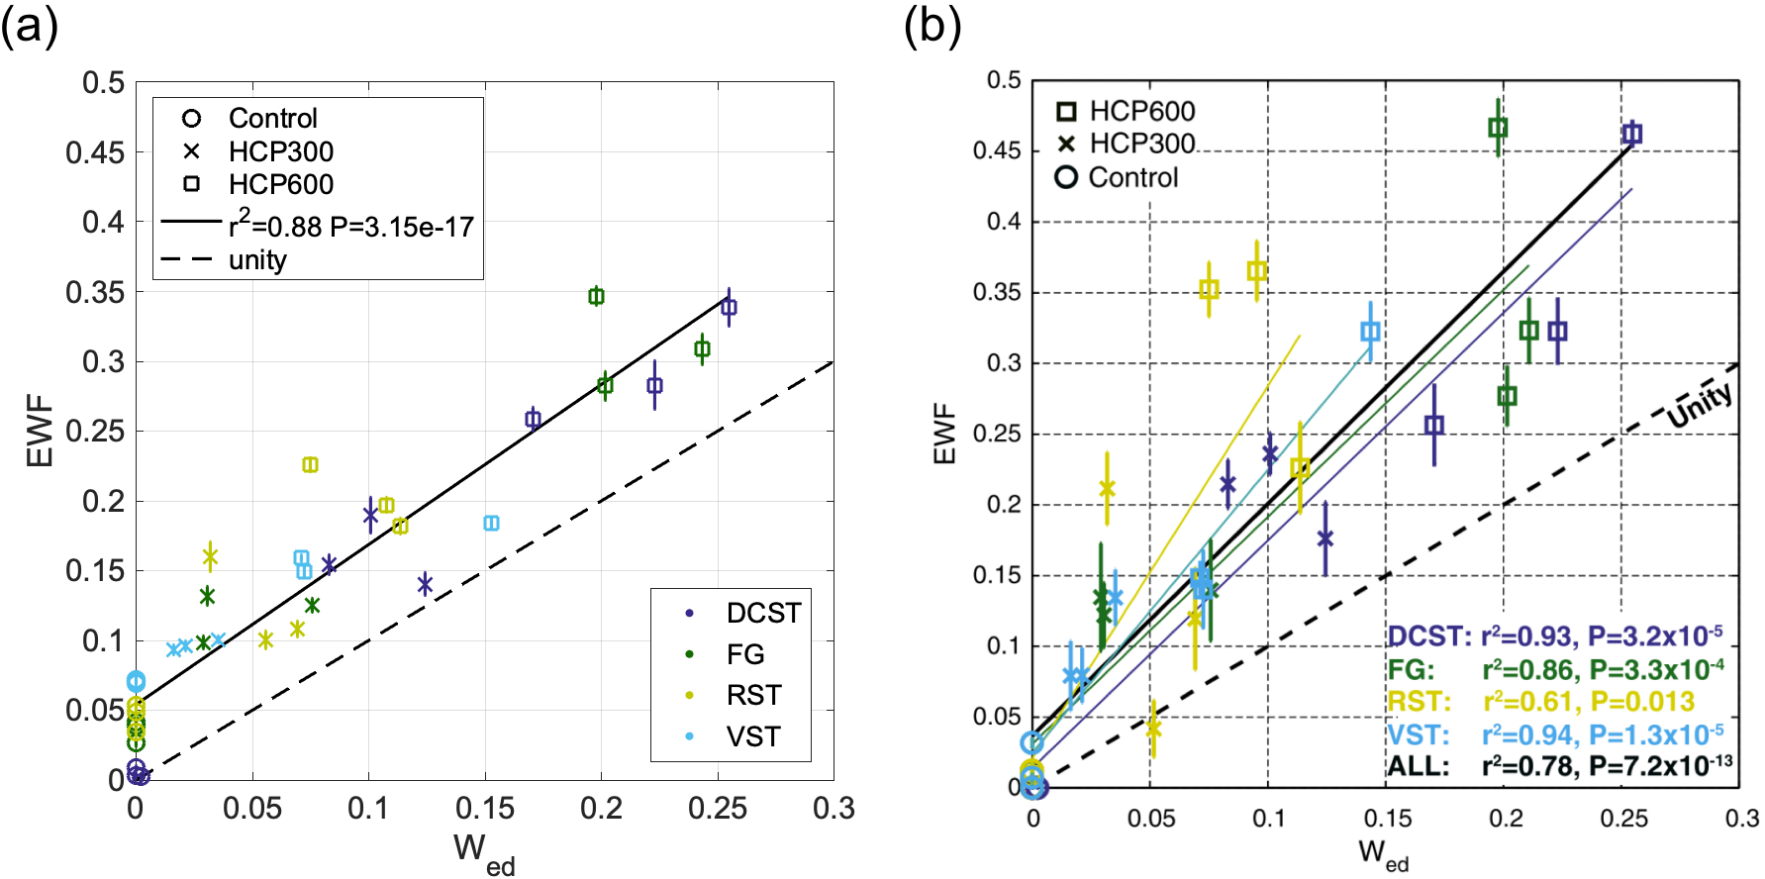
Three characteristic signal components were extracted from the DWI measurements (Figure 1b). Signals from the brain tissue has primarily been decomposed into two components (green and purple), where a different composition of these distinguishes gray from white matter (Figure 1c). The third short-lived component (yellow) is distributed as the surrounding watery buffer solution and CSF leftovers. The difference between the two sets of maps (Figure 1c, third column), provided to capture the effect of time-dependent diffusion, uncovers areas of high cell density. Tissues of limited diffusion appear strongly positive for the long-lasting signal component (green) and negative for the intermediate signal decay (purple). This involves white matter, visual cortex (thin arrow), and in particular the cerebellar cortex (thick arrow), which in accordance with the pronounced contrast consists of a very restricted diffusion environment4,6,7. Such clear contrasts across cerebral and cerebellar cortex have to our knowledge not been found using other MR contrast mechanisms before. This makes the msNMF applied to DWI data a promising and potentially powerful tool for tumor tissue characterization.The decomposition of the relaxometry data is presented in Figure 2. For all three components, the contrast between gray and white matter increases for the IME-induced rats. Consistent with expectations of relaxation properties (IME causes T2-hyperintensity5,8), the fraction of the green component (given by the normalized $$$\textbf{H}$$$) is considered an estimate of the EWF. The msNMF-based EWF estimates in four white matter tracks (Figure 3a) confirm a clear increase of edema with increasing HCP intoxication (Figure 3b). There is a high degree of similarity to the equivalent barplot presented by Harkins et al (Figure 3c), although here EWF estimates are slightly higher considering the HCP-groups. In a comparison of the EWF estimates with the histology-based edema water content fraction, Wed, (Figure 4a), a high agreement (R2 of 0.88, P<0.001) confirms that the decomposition is related to the underlying compartmentalization of the tissue. Similar to the results reported by Harkins et al (Figure 4b), an expected small overestimation of EWF compared to Wed was observed5.
Conclusion
The novel decomposition method (msNMF) separated MRI signals into identifiable components specific to the underlying structure, including imitated pathological conditions, and produced results consistent with those published. The msNMF is insensitive to partial volume effects and potentially applicable to a range of multi-dimensional MRI data. The demonstrated contrast across areas with different cell body density, for example, qualifies it as a candidate for characterization of malignant lesions for better staging, prognostics and management.Acknowledgements
The authors would like to thank Mark D. Does and Kevin D. Harkins for their cooperativeness and sharing of data, and Nirav Bhatt and Arun Ayyar for providing their software for monotonous NMF. The study was funded by the Danish Cancer Society (grant R167-A10637-17-S2) and Henrik Lundell additionally received funding from the European Research Council (ERC) under the European Union’s Horizon 2020 research and innovation programme (grant agreement No 804746).References
1. Does MD, Olesen JL, Harkins KD, et al. Evaluation of principal component analysis image denoising on multi-exponential MRI relaxometry. Magn Reson Med. 2019;81(6):3503-3514. doi:10.1002/mrm.276582.
2. Meyers SM, Vavasour IM, Mädler B, et al. Multicenter measurements of myelin water fraction and geometric mean T 2: Intra- and intersite reproducibility. J Magn Reson Imaging. 2013;38(6):1445-1453. doi:10.1002/jmri.241063.
3. Bhatt N, Ayyar A. Monotonous ( Semi- ) Nonnegative Matrix Factorization. In: Proceedings of the Second ACM IKDD Conference on Data Sciences. ; 2015:92-97. doi:10.1145/2732587.27326004.
4. Lundell H, Nilsson M, Dyrby TB, et al. Multidimensional diffusion MRI with spectrally modulated gradients reveals unprecedented microstructural detail. Sci Rep. 2019;9(1):1-12. doi:10.1038/s41598-019-45235-75.
5. Harkins KD, Valentine WM, Gochberg DF, Does MD. In-vivo multi-exponential T 2 , magnetization transfer and quantitative histology in a rat model of intramyelinic edema. NeuroImage Clin. 2013;2:810-817. doi:10.1016/j.nicl.2013.06.0076.
6. Collins CE, Airey DC, Young NA, Leitch DB, Kaas JH. Neuron densities vary across and within cortical areas in primates. Proc Natl Acad Sci U S A. 2010;107(36):15927-15932. doi:10.1073/pnas.10103561077.
7. Najac C, Branzoli F, Ronen I, Valette J. Brain intracellular metabolites are freely diffusing along cell fibers in grey and white matter, as measured by diffusion-weighted MR spectroscopy in the human brain at 7 T. Brain Struct Funct. 2016;221(3):1245-1254. doi:10.1007/s00429-014-0968-58.
8. Cohen JA, Fisher RS, Brigell MG, Peyster RG, Gordon S. The potential for Vigabatrin-induced intramyelinic edema in humans. Epilepsia. 2000;41(2):148-157. doi:10.1111/j.1528-1157.2000.tb00134.x
Figures