2470
Investigating time dependent diffusion, microscopic anisotropy and T2 effects in the mouse heart1Danish Research Centre for Magnetic Resonance, Centre for Functional and Diagnostic Imaging and Research, Copenhagen University Hospital Hvidovre, Hvidovre, Denmark, 2Random Walk Imaging, Lund, Sweden, 3Clinical Sciences, Lund University, Lund, Sweden, 4Harvard Medical School, Boston, MA, United States, 5Brigham and Women's Hospital, Boston, MA, United States, 6Leeds Institute of Cardiovascular and Metabolic Medicine, University of Leeds, Leeds, United Kingdom, 7Department of Neurosurgery, Medical College of Wisconsin, Milwaukee, WI, United States
Synopsis
Non-invasive characterization of cardiac microstructure by diffusion MRI has provided insights into the healthy and diseased heart. Multidimensional diffusion encoding (MDE) aims for measurements with independent contrasts for specific effects. We suggest a battery of MDE measurements that probe diffusivity and microscopic anisotropy at different diffusion and echo times. We show a clear effect of time-dependent diffusion but a smaller effect from transversal relaxation.
Introduction
Cardiomyocytes are elongated in shape with its shortest axis in the order of 12 µm in diameter1which may provide anisotropy and time dependent diffusion effects within the range that DW-MRI can probe2. We have previously showed that measurements with double diffusion encoding (DDE) can probe microscopic anisotropy in the mouse heart and that apparent diffusivity strongly depends on the spectral content of the gradient encoding waveform3,4. Diffusion weighting with general gradient waveforms provide great flexibility and experimental efficiency for multidimensional diffusion encoding (MDE) which enable the combined study of these effects5–8. In this work we propose a set of measurements that modulate b-tensor shape which enables decomposition of multi-Gaussian diffusion into mean shape and variance in size of underlying diffusion tensors9,10and calculation of the microscopic fractional anisotropy (µFA)10. We repeat these measurements with modulated spectral content. In compartments where time dependent diffusion is apparent, such as in restrictions, measurements with different spectral content can provide an additional contrast reflecting restriction size11,12. Further, we performed the measurements at two different echo times to investigate interactions with T2 relaxation effects.Methods
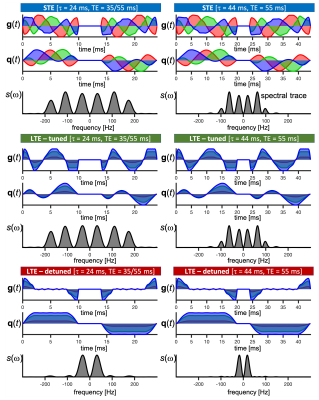
A healthy mouse heart was arrested, excised, fixed with PFA and embedded in 1% agarose PBS gel. Animal procedures were performed in accordance with UK Home Office authorization after review by local Animal Welfare and Ethical Review Committee. Multi-shot 3D diffusion-weighted EPI was used on a 7T-Bruker Biospec MRI scanner using a custom diffusion waveform sequence: TR=1s, TE=35/55ms, NSA=4, FOV=10.8×9×9 mm, resolution=225×225×450 µm3. [FS2] We considered three gradient waveform configurations based on magic angle spinning of the q-vector (q-MAS)13: One yielding spherical b-tensor encoding (STE) and two for linear b-tensor encoding (LTE) that where either tuned ordetunedto the STE. To provide a wider range of spectral content the gradient durations were stretched to total encoding times of τ = 24 and 44 ms (Figure 1). All waveforms were applied at TE=55ms and the short waveform was applied at TE=[35 55]ms resulting in 9 configurations. In all cases, b=[0 0.1 0.5 1.0 1.5]ms/µm2 with 15 uniform rotations. Data was powder-averaged and µFA maps were calculated14 for pairs of tuned LTE and STE with the same TE and τ. Mean diffusivity (MD) was also estimated within the same fitting routine from the LTE data only.Results and discussion
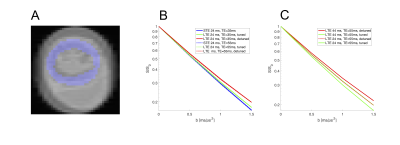
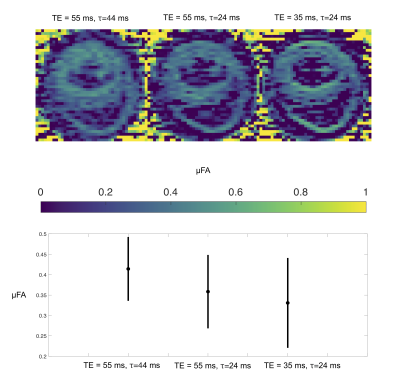
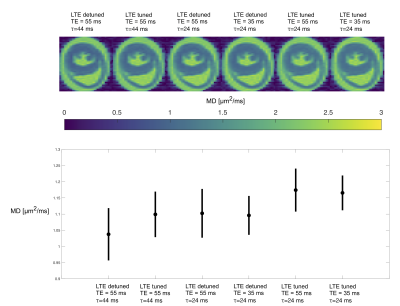
An ROI in an axial slice was chosen for the analysis and shown in Figure 1A. Signals acquired at different TE were overlapping for all waveforms but with a tendency of larger signal attenuation for the longer TE (Figure 1B). Pairs of STE and tuned LTE had overlapping initial slope but higher curvature in the LTE reflecting microscopic anisotropy. A clear effect of tuning and encoding time was observed with the highest attenuation for the tuned short waveform and lowest attenuation for the detuned long waveform (Figure 2C). The short detuned and long tuned waveforms exhibited similar signal attenuations which may reflect their similar spectral power centered around 50 Hz (Figure 1). The difference in initial slope between different settings highlight the necessity of tuning the LTE to the STE in order to correctly characterize microscopic anisotropy that should only relate to differences in higher order terms in b. Maps and ROI statistics of µFA from pairs of STE and tuned LTE are shown in figure 3. A trend with slightly lower µFA from experiments with spectral content at higher frequencies (shorter diffusion times) is seen. A more isotropic diffusivity at shorter diffusion times suggest that the different tunings mainly modulate diffusivity in the transverse axis which is consistent with early observations in calf heart15 but in contrast to observations in white matter where mainly increased diffusivity along axons is observed at shorter diffusion times16. MD maps and ROI statistics shown in figure 4 confirm the observations in figure 1C showing increased estimated MD in waveforms with spectral content at higher frequencies (left to right). We observe a weak trend towards higher diffusivities at longer TE which suggests longer relaxation times for less restricted components.Conclusion
We demonstrate diffusion time effects in cardiac DW-MRI with free gradient waveforms for estimation of microscopic anisotropy. We demonstrate that tuning is necessary for µFA estimation in this application and that time dependence in both µFA and MD maps can be estimated from measurements with experiments using a range of timing parameters which could provide a valuable additional contrast for the evaluation of healthy and diseased cardiac tissue. The rather small effects seen from varying TE suggest that T2-effects are small in this range which provide a weak handle for further separation of tissue compartments. However, combined interactions between diffusion time and relaxation in pathologies could be of interest for future experiments. For future human experiments longer gradient durations are expected for sufficient b, which may provide spectral content at lower frequencies. Time dependencies in these ranges will be evaluated to address possible biases in µFA estimation and possible additional contrasts from detuned waveforms.Acknowledgements
This project has received funding from the European Research Council (ERC) under the European Union’s Horizon 2020 research and innovation programme (grant agreement No 804746). SL is supported also by Random Walk Imaging. This work was supported by the British Heart Foundation, UK (PG/19/1/34076, SI/14/1/30718). We thank Markus Nilsson for his expert insight, and Joanna Koch-Paszkowskiand Leah Khazin for their work on the sample preparation.References
1. Chen, Y. F., Said, S., Campbell, S. E. & Gerdes, A. M. A method to collect isolated myocytes and whole tissue from the same heart. Am. J. Physiol. - Hear. Circ. Physiol.(2007). doi:10.1152/ajpheart.00479.2007
2. Teh, I., Schneider, J. E., H.J., W., Dyrby, T. B. & Lundell, H. Temporal Diffusion Spectroscopy in the Heart with Oscillating Gradients. in proc. ISMRM225, 3114 (2017).
3. Teh, I., Lundell, H., Whittington, H. J., Dyrby, T. B. & Schneider, J. E. Resolving Microscopic Fractional Anisotropy in the Heart. Proc. Intl. Soc. Mag. Reson. Med.24, 800 (2015).
4. Teh, I., Schneider, J. E., Whittington, H. J., Dyrby, T. B. & Lundell, H. Temporal Diffusion Spectroscopy in the Heart with Oscillating Gradients. Proc. Intl. Soc. Mag. Reson. Med.25, 3114 (2017).
5. Topgaard, D. Multiple dimensions for random walks. J. Magn. Reson.306, 150–154 (2019).
6. Lasič, S. et al.Motion compensated b-tensor encoding for in vivo cardiac diffusion-weighted imaging. NMR Biomed33, e4213 (2020).
7. Lundell, H. & Lasič, S. Diffusion Encoding with General Gradient Waveforms. in Advanced Diffusion Encoding Methods in MRI(Royal Society of Chemistry, 2020).
8. Szczepankiewicz, F., Westin, C.-F. & Nilsson, M. Gradient waveform design for tensor-valued encoding in diffusion MRI. J Neurosci Methods2in press (20AD).
9. Westin, C.-F. et al.Measurement Tensors in Diffusion MRI: Generalizing the Concept of Diffusion Encoding. MICCAI14, 209–216 (2014).
10. Lasič, S., Szczepankiewicz, F., Eriksson, S., Nilsson, M. & Topgaard, D. Microanisotropy imaging: quantification of microscopic diffusion anisotropy and orientational order parameter by diffusion MRI with magic-angle spinning of the q-vector. Front. Phys.2, 11 (2014).
11. Lundell, H. et al.Multidimensional diffusion MRI with spectrally modulated gradients reveals unprecedented microstructural detail. Sci. Rep.9, 9026 (2019).
12. Stepišnik, J. Time-dependent self-diffusion by NMR spin-echo. Phys. B183, 343–350 (1993).
13. Topgaard, D. Isotropic diffusion weighting in PGSE NMR: Numerical optimization of the q-MAS PGSE sequence. Microporous Mesoporous Mater.178, 60–63 (2013).
14. Szczepankiewicz, F. et al.The link between diffusion MRI and tumor heterogeneity: Mapping cell eccentricity and density by diffusional variance decomposition (DIVIDE). Neuroimage142, 522–532 (2016).
15. Kim, S., Chi-Fishman, G., Barnett, A. S. & Pierpaoli, C. Dependence on diffusion time of apparent diffusion tensor of ex vivo calf tongue and heart. Magn. Reson. Med.(2005). doi:10.1002/mrm.20676
16. Nielsen, J. S., Dyrby, T. B. & Lundell, H. Magnetic resonance temporal diffusion tensor spectroscopy of disordered anisotropic tissue. Sci. Rep.8, 2930 (2018).
Figures


