2469
Automated Surface-Based Segmentation of Deep Grey Matter Brain Regions Based Solely on Diffusion Tensor Images1Biomedical Engineering, University of Alberta, Edmonton, AB, Canada
Synopsis
A surface-based deep grey matter segmentation algorithm is proposed that works directly on diffusion images and maps of the brain acquired at a 1.5 mm isotropic resolution. The method was applied to twenty participants spanning a large age range (6-90 years) resulting in accurate segmentations of the thalamus, caudate, putamen and globus pallidus. Fractional anisotropy and mean diffusivity showed unique non-linear trajectories across the lifespan. The proposed method avoids the need of problematic coregistration to other scans (anatomical T1) and will accelerate the analysis of microstructural changes of deep grey matter regions with age (or disease) in large populations.
Purpose
Diffusion tensor imaging (DTI) of deep grey matter (GM) structures has shown neurodevelopmental trajectories (5-30 years)1 and differences between young (22-37 years) and older (65-79 years) adults2. To extract DTI measurements of deep GM structures, segmentations are usually performed either with time-consuming manually placed regions-of-interest or using atlases on 3D-T1-weighted images that are applied to the co-registered DTI. However, the latter requires the acquisition of an additional image and is prone to registration errors given image distortions in DTI. Others have proposed using atlas registration to attain segmentations using only DTI3; however modern deep GM segmentation methods on T1 and T2 images use shape-based approaches to overcome the poor contrast in subcortical regions4. Here we present an automatic surface-based deep GM segmentation method of the thalamus, putamen, globus pallidus (GP), and caudate that is applied directly on the DTI images/maps. This method is then applied on 1.5 mm isotropic DTI images at 3T to assess diffusion metric changes with age (6-90 years) in a small group of healthy participants.Methods
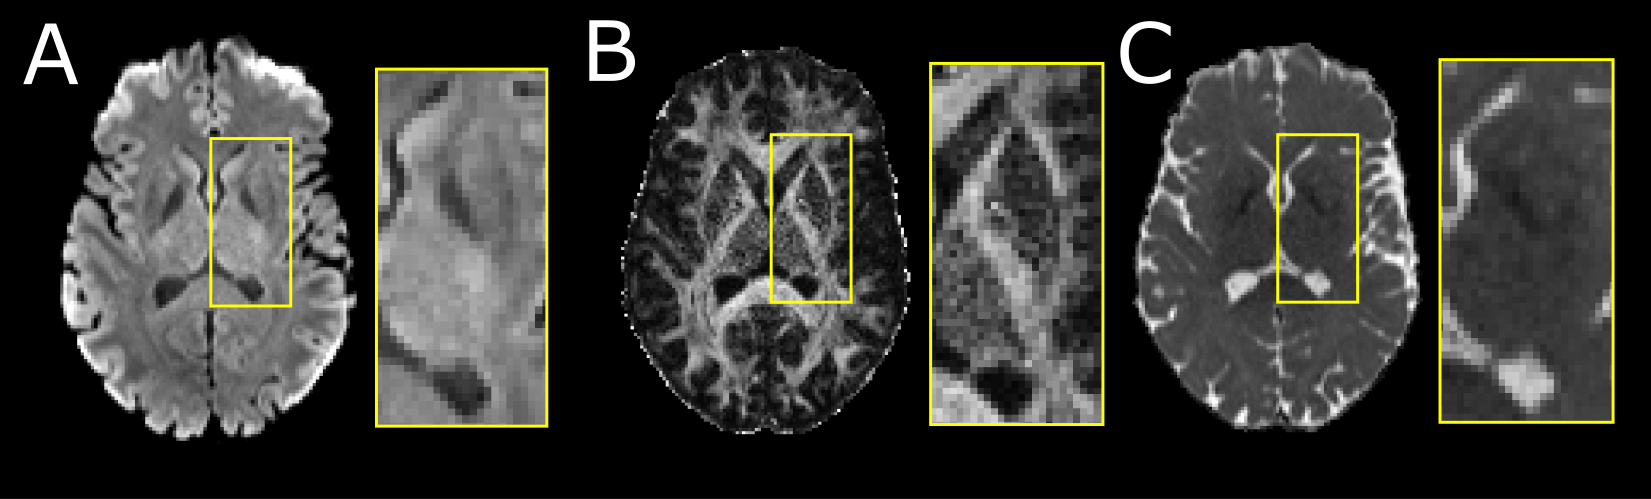
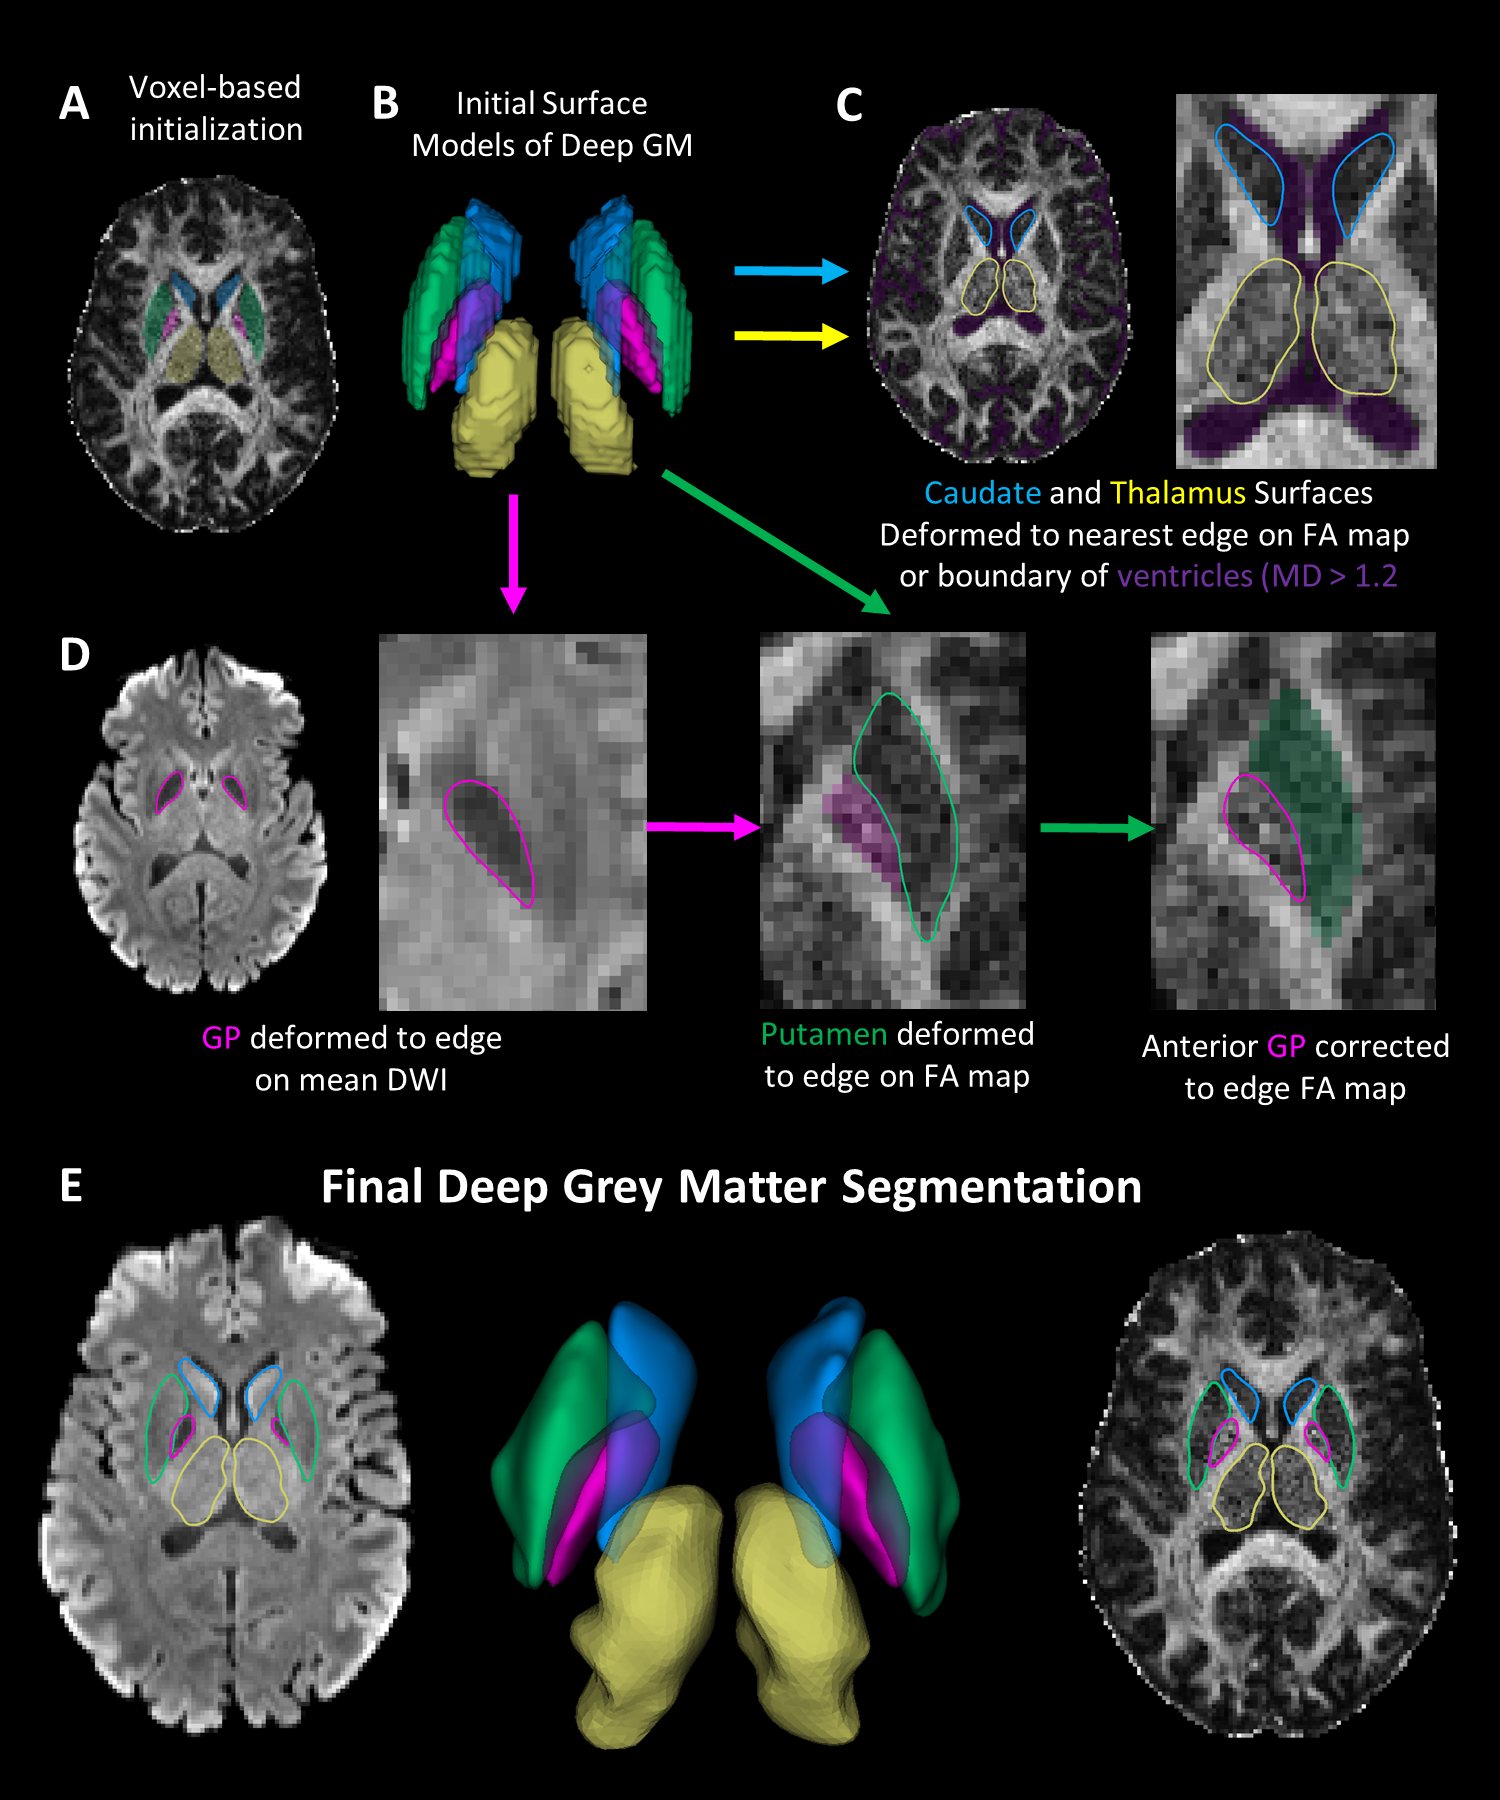
Twenty healthy participants (49±27, 6-90 years; 10 females) underwent DTI on a 3T Siemens Prisma (64 channel head coil) with a single-shot EPI spin-echo sequence: multi-band=2, GRAPPA R=2, 9.5 min scan, 10 b0 s/mm2, 6 b500 s/mm2 (not used here), 20 b 1000 s/mm2, 64 b2500 s/mm2 (not used here), TR=5160 ms, TE=67 ms,1.5x1.5 mm2 in-plane, 96 1.5 mm slices with no gap. The b0 and b1000 images were corrected for Gibbs ringing and eddy current distortions (FSL v6.0). Tensor models were fit (DIPY v1.0) outputting fractional anisotropy (FA) and mean diffusivity (MD) maps (Figure 1).The flowchart of the proposed segmentation method is shown in Figure 2. The Harvard-Oxford probabilistic atlas was registered to native DTI imaging space (FLIRT, FSLv6.0) per participant extracting left/right segmentations for the caudate, putamen, GP and thalamus. Initial voxel labels for each structure were generated by thresholding (regions > %50 probability) and removing voxels in the ventricles (MD > 1.2x10⁻³ mm2/s). Labels were converted to surfaces using the medical image registration toolbox (MIRTK) outputting 3D models consisting of vertices and edges. Notably, these structures are bordered by the highly anisotropic internal capsule or the fast diffusing, isotropic ventricles. To segment these structures, the 3D models were deformed (MIRTK, deform-mesh5) to image edges (regions of large signal change) defined by the mean b1000 image, FA map and MD values.
Surface deformation algorithms (e.g. cortex segmentation6,7) deform vertices towards image edges while constraining surface smoothness. Here we apply surface deformation to deep GM segmentation on native DTI. The caudate and thalamus are deformed to either the closest edge on the FA map or the ventricles (region with MD > 1.2x10⁻³ mm2/s). The GP surface was deformed on the mean b1000 DWI given its lower signal intensity resulting from short T2*. The putamen was deformed to the closest edge on the FA map while restricting movement into the GP. To ensure exclusion of the internal capsule from the GP segmentation, the GP is deformed on the FA map while restricting movement into the putamen.
To evaluate the accuracy of the model boundaries, segmentations were overlaid on the mean b1000 image and FA map for each subject. For each participant, voxels enclosed in each structure were identified and average values of MD and FA were calculated. Hemispheric differences were assessed for each structure (pairwise t-test, p < 0.05), then values were averaged between hemispheres and tested for non-linear effects of age (quadratic fit, R2).
Results and Discussion
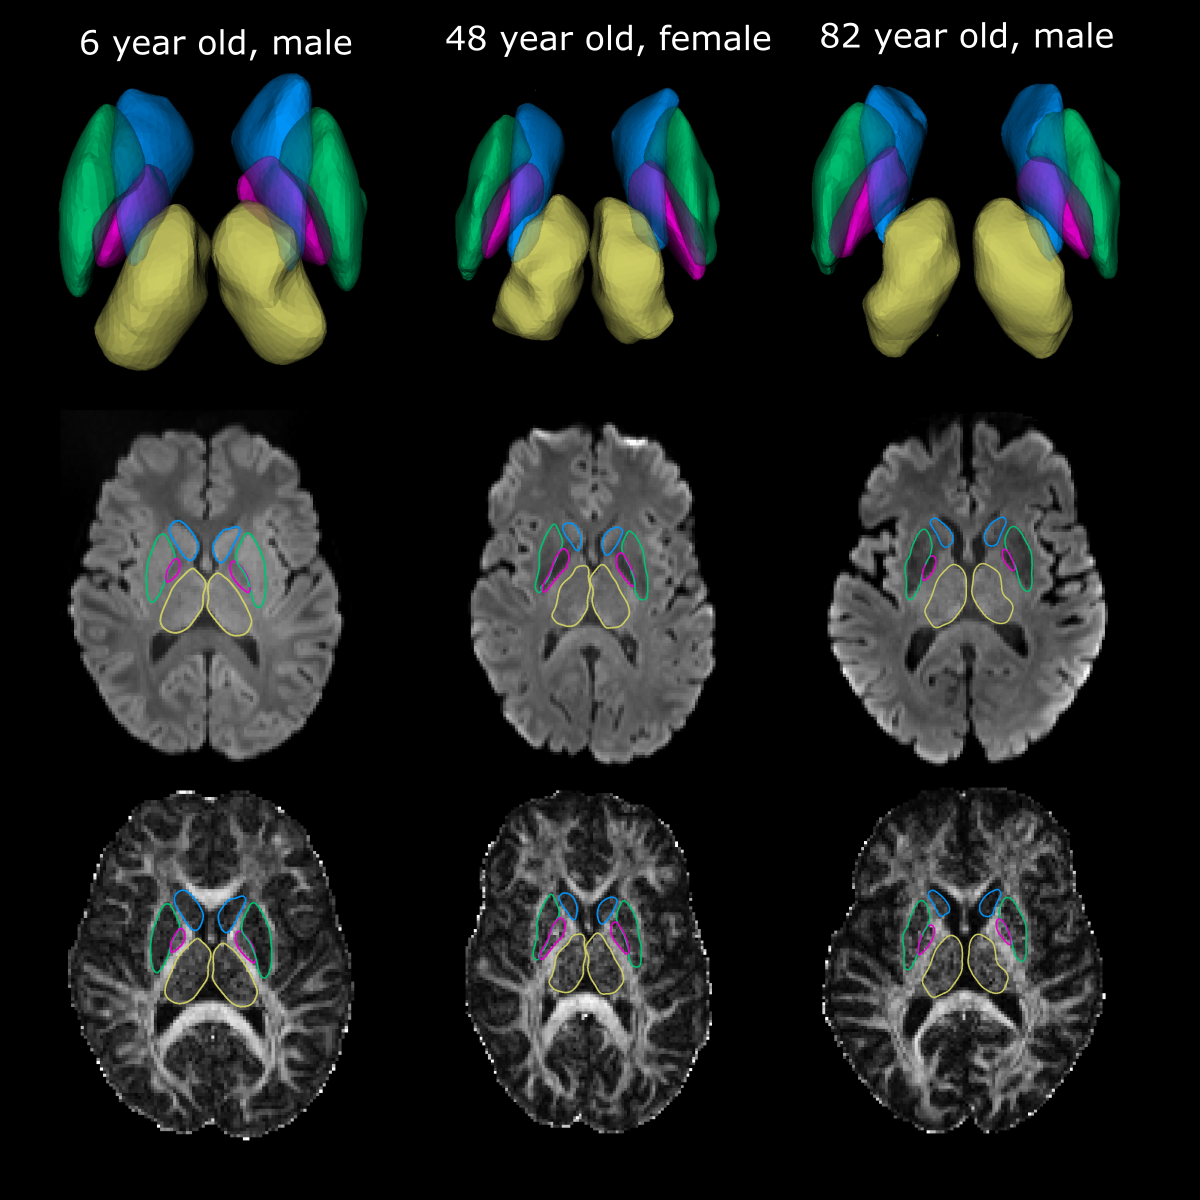
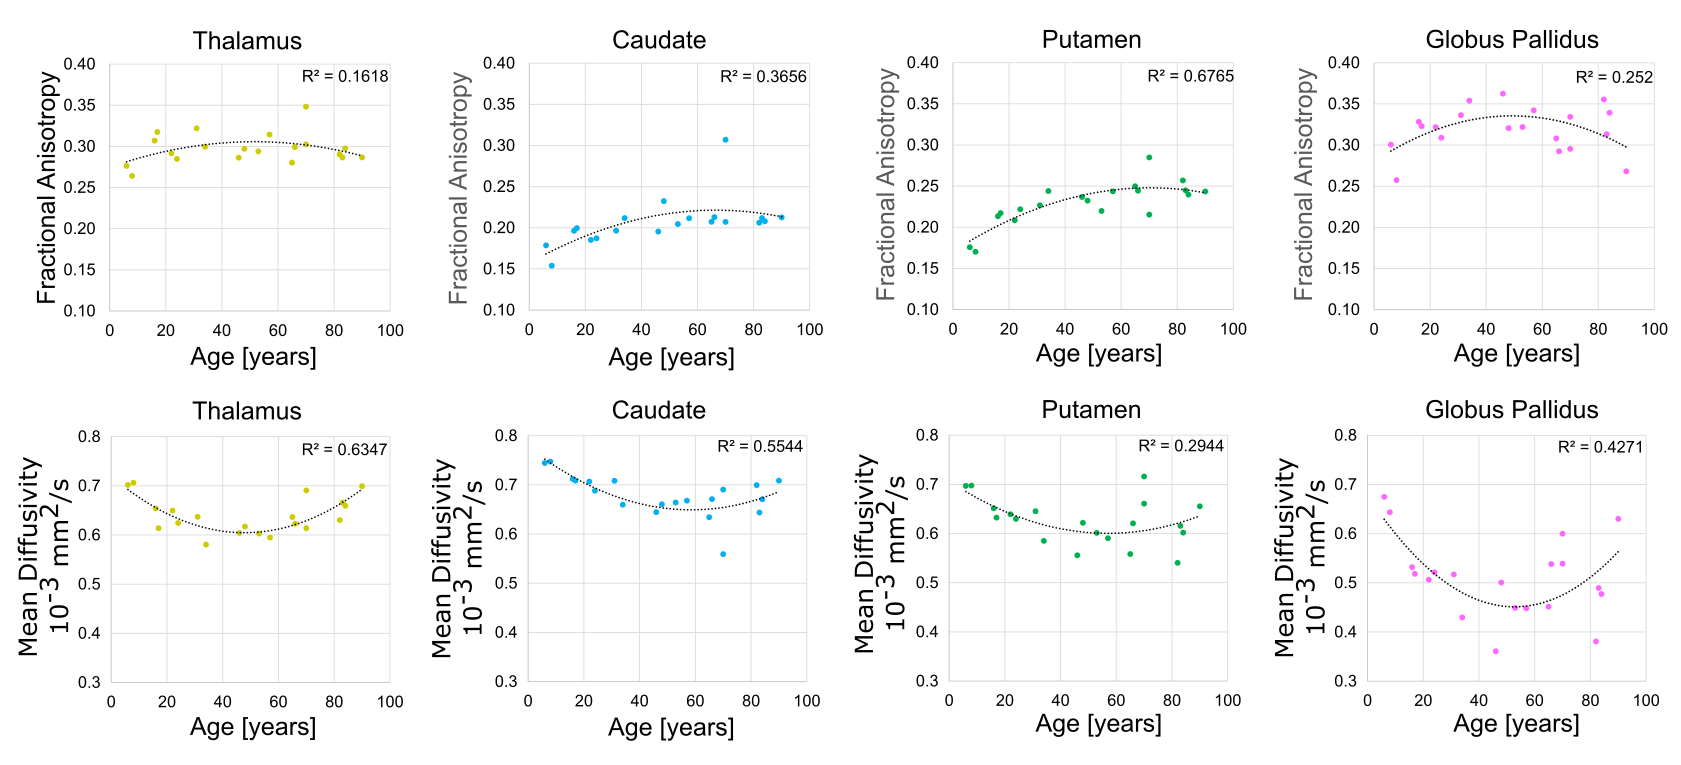
The proposed deep GM segmentation method on DTI images/maps alone yielded accurate surface segmentations of the putamen, caudate, thalamus, and GP for all twenty participants over the wide age range (Figure 3). Marginal segmentation errors were observed in the anterior inferior region of the putamen where the FA contrast is unclear on some participants. No differences in FA or MD were observed between hemispheres for the four structures. MD values (caudate: 0.68 ± 0.04 x10⁻³ mm2/s, thalamus: 0.64±0.03x10⁻³ mm2/s, putamen: 0.63±0.05 x10⁻³ mm2/s, GP: 0.51±0.08 x10⁻³ mm2/s) were lower and FA values (GP: 0.32±0.03, thalamus: 0.30±0.02, putamen: 0.23±0.03, caudate: 0.21± 0.03) were higher than values reported using lower spatial resolution DTI analyzed with either manual segmentation (1.7x1.7x3 mm3)1or atlas registration (2.5 mm isotropic)2. These differences may also relate to the lower SNR from the 1.5 mm isotropic acquisition. Age related trajectories of FA and MD in the deep GM are displayed in Figure 4. Non-linear quadratic trajectories in DTI parameters were observed in this small sample of 20 participants. FA values were lower prior to mid-adulthood (between 40 to 60 years old) and remained constant or were lower in elderly years, whereas the opposite trajectories were observed for MD. The low MD of the GP might be biased from low SNR from T2* signal loss or susceptibility-related effects8. Thus, it is possible that the age-related changes in the GP reflect iron accumulation rather than changes in diffusion2. This study proposes a novel rapid automated surface-based deep GM segmentation method using only DTI images/maps that can be applied across the lifespan.Acknowledgements
No acknowledgement found.References
1. C. Lebel, L. Walker, A. Leemans, L. Phillips, and C. Beaulieu, “Microstructural maturation of the human brain from childhood to adulthood,” NeuroImage, vol. 40, no. 3, pp. 1044–1055, Apr. 2008
2. A. Pfefferbaum, E. Adalsteinsson, T. Rohlfing, and E. V. Sullivan, “Diffusion tensor imaging of deep gray matter brain structures: Effects of age and iron concentration,” Neurobiol. Aging, vol. 31, no. 3, pp. 482–493, Mar. 2010
3. K. M. Hasan and R. E. Frye, “Diffusion tensor-based regional gray matter tissue segmentation using the international consortium for brain mapping atlases,” Hum. Brain Mapp., vol. 32, no. 1, pp. 107–117, 2011
4. B. Patenaude, S. M. Smith, D. N. Kennedy, and M. Jenkinson, “A Bayesian model of shape and appearance for subcortical brain segmentation,” NeuroImage, vol. 56, no. 3, pp. 907–922, Jun. 2011
5. A. Schuh et al., “A deformable model for the reconstruction of the neonatal cortex,” in 2017 IEEE 14th International Symposium on Biomedical Imaging (ISBI 2017), Apr. 2017, pp. 800–803
6. A. M. Dale, B. Fischl, and M. I. Sereno, “Cortical surface-based analysis. I. Segmentation and surface reconstruction,” NeuroImage, vol. 9, no. 2, pp. 179–194, Feb. 1999
7. J. S. Kim et al., “Automated 3-D extraction and evaluation of the inner and outer cortical surfaces using a Laplacian map and partial volume effect classification,” NeuroImage, vol. 27, no. 1, pp. 210–221, Aug. 2005
8. M. D. Does, J. Zhong, and J. C. Gore, “In vivo measurement of ADC change due to intravascular susceptibility variation,” Magn. Reson. Med., vol. 41, no. 2, pp. 236–240, 1999
Figures