2467
Application of DKI and IVIM in staging of hepatic fibrosis1Department of Magnetic Resonance, LanZhou University Second Hospital, LanZhou, China, 2MR Scientific Marketing, Siemens Healthineers, Shanghai, China
Synopsis
Intravoxel Incoherent Motion (IVIM) is a MRI method that enables simultaneous assessment of diffusion and perfusion. Diffusion Kurtosis imaging (DKI) is based on a mathematical approach that uses a polynomial model with a dimensionless factor called the kurtosis (K). This study evaluated the relationship between IVIM-DKI diffusion models and clinical-pathologic to assess their diagnostic accuracy for staging of hepatic fibrosis. We found that a high level of hepatic fibrosis usually have a higher MK values. A significant negative correlation was observed between FibroScan and MD. In conclusion, compared with IVIM, DKI might be more useful in staging of hepatic fibrosis.
Introduction and purpose
The staging of hepatic fibrosis can be based on biopsy and/or transient elastography. However, to find an acknowledged noninvasive method in fibrosis assessment is still a challenge. There were few studies to evaluate the potential of DKI and IVIM to assess the staging of hepatic fibrosis before. Meanwhile the results maybe difference[1-4]. Our study aimed to evaluate the accuracy of DKI and IVIM in the staging of hepatic fibrosis.Materials and Methods
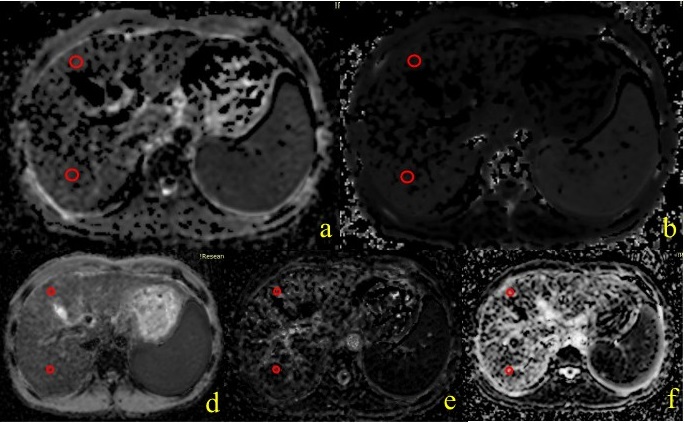
Twenty-nine patients with liver function damage were enrolled in this study. All the subjects underwent MR examination on a 1.5T MR scanner (MAGNETOM Aera, Siemens Healthcare, Erlangen, Germany) using a combination of 18-channel body and 12-channel spine matrix coil elements. A prototype single-shot spin-echo echo-planar DW imaging sequence was used to acquire the DKI and IVIM data under free breathing with following parameters: b values = 0, 200, 400, 600,800, 1000, 1,200 sec/mm2 for DKI,b values = 0,50,100,150,200,400,600,800 sec/mm2 for IVIM, TR =6800ms, TE =58ms, FOV = 304x380mm2, scan matrix = 108x134, slice thickness = 6mm, transversal orientation with coverage of the whole liver, total scan time = 10min 12sec. Mean kurtosis (MK) maps, mean diffusion (MD) maps of DKI model, and pure molecular diffusion(D), perfusion fraction(f), perfusion related diffusion(PD) of IVIM were calculated by using a prototype software (Body Diffusion Toolbox, Siemens Healthcare, Erlangen, Germany). The histopathologic diagnosis of hepatic fibrosis was confirmed by liver biopsy. Twenty-eight patients of them underwent transient elastography. Figure 1 showed the examples of placement of regions of interest (ROIs) on MD map, MK map, D map, PD map, and f map.Results
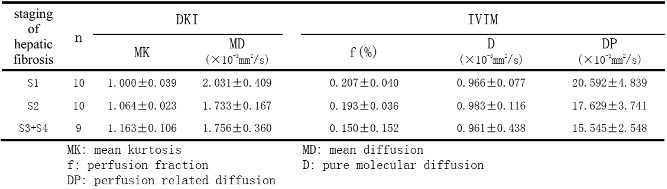
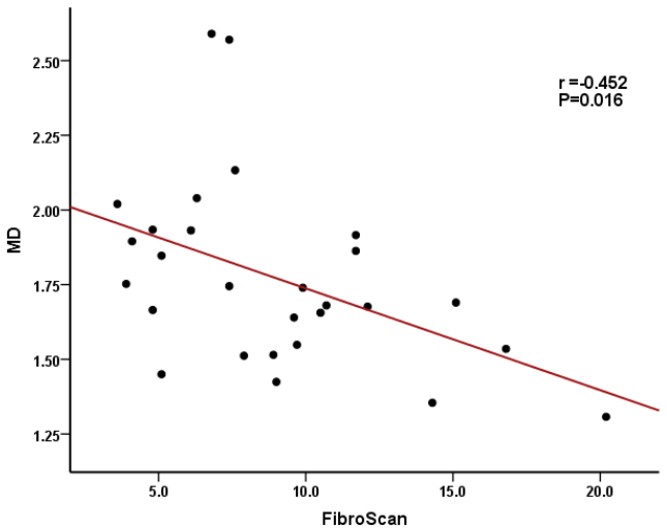
The mean and standard deviation(SD) of MD, MK, f, D and DP values of the different staging of hepatic fibrosis were showed in Table 1. The MK value were significantly higher in the higher staging of hepatic fibrosis(S2>S1, P=0.000; S3-4>S2, P=0.010). There was negative correlation between the MD value and the Fibroscan , r=-0.452, P=0.016( Figure 2 ). Which suggest that the DKI may be a superior option for staging of hepatic fibrosis.Discussion and conclusion
IVIM and DKI are different DWI models to reflect water diffusion in the complex microstructure. Our study founded that IVIM and DKI can be useful in staging of hepatic fibrosis. The MK and MD could be a potential biomarker for early stage of hepatic fibrosis. That’s may because DKI quantifies the non-Gaussian behavior of diffusion and provides both a diffusion coefficient as well as the excess kurtosis of tissue, which is more similar to the pathological changes of hepatic fibrosis[5]. While multicenter trials with larger sample sizes are needed to confirm our findings. In conclusion, IVIM and DKI models were helpful in staging of hepatic fibrosis, when compared to the bi-exponential IVIM model, the DKI model displays a higher sensitivity to detect changes in liver damage condition.Acknowledgements
This article is supported by the Lanzhou Chengguan District Science and Technology Plan Project (No. 2019SHFZ0037).References
1. Ichikawa S, Motosugi U, Morisaka H, et al. MRI-based staging of hepatic fibrosis: comparison of intravoxel incoherent motion diffusion-weighted imaging with magnetic resonance elastography. J Magn Reson Imaging, 2015, 42(1): 204-210
2. Dyvorne HA, Jajamovich GH, Bane O, et al. Prospective comparison of magnetic resonance imaging to transient elastography and serum markers for liver fibrosis detection. Liver Int, 2016, 36(5): 659-666.
3. Sheng RF, Wang HQ, Yang L, et al. Diffusion kurtosis imaging and diffusion-weighted imaging in assessment of liver fibrosis stage and necroinflammatory activity. Abdom Radiol, 2017, 42(4): 1176-1182.
4. Hu G, Liang W, Wu M, et al. Staging of rat liver fibrosis using monoexponential, stretched exponential and diffusion kurtosis models with diffusion weighted imaging- magnetic resonance. Oncotarget, 2018, 9(2): 2357-2366.
5. Jensen JH, Helpern JA, Ramani A, et al. Diffusional kurtosis imaging: the quantification of non-Gaussian water diffusion by means of magnetic resonance imaging. Magn Reson Med 53:1432–1440
Figures