2466
Investigating the relationship between diffusion MRI signal cumulants and hepatocyte microstructure at fixed diffusion time1Radiomics Group, Vall d'Hebron Institute of Oncology, Vall d'Hebron Barcelona Hospital Campus, Barcelona, Spain, 2NMR Lab, Vall d'Hebron Institute of Oncology, Vall d'Hebron Barcelona Hospital Campus, Barcelona, Spain, 3Department of Radiology, Hospital Universitari Vall d'Hebron, Barcelona, Spain
Synopsis
To date, limited attention has been paid to diffusion-weighted (DW) MRI signal modelling of the liver, where new imaging methods are needed to tackle diseases such as cancer. We report on Monte Carlo (MC) simulations run in synthetic hepatic cells to inform the developing of new model-based methods for liver application. We specifically investigate the question: “can cell size and diffusivity be estimated from signal cumulants at fixed diffusion time and realistic SNR?”, and find that the task is feasible for clinical diffusion times and b=0 SNR as low as 20, provided that both apparent diffusivity and kurtosis are considered.
Introduction
Diffusion-weighted (DW) MRI provides promising, non-invasive biomarkers in several anatomical districts1-6. To date, MRI signal modelling efforts have focussed mainly on neural7-13 and prostate14-17 tissues, and less attention has been paid to organs such as the liver. Nonetheless, new biologically-specific DW MRI methods are urgently needed in liver diseases, e.g. liver cancer, a leading cause of cancer-related death18. New imaging tools are required to help optimise the use of biopsies, which can have complications, support liver cancer diagnosis and inform treatment selection.We present results from Monte Carlo (MC) simulations of diffusion within synthetic hepatic cells. We characterise water diffusion and corresponding MRI signals, establishing a link between the two. Moreover, we aim to answer the question: “can cell size and intrinsic diffusivity be estimated from signal cumulants at fixed diffusion time and realistic SNR?”, as this can inform the development of new model-based methods tailored for liver application.
Methods
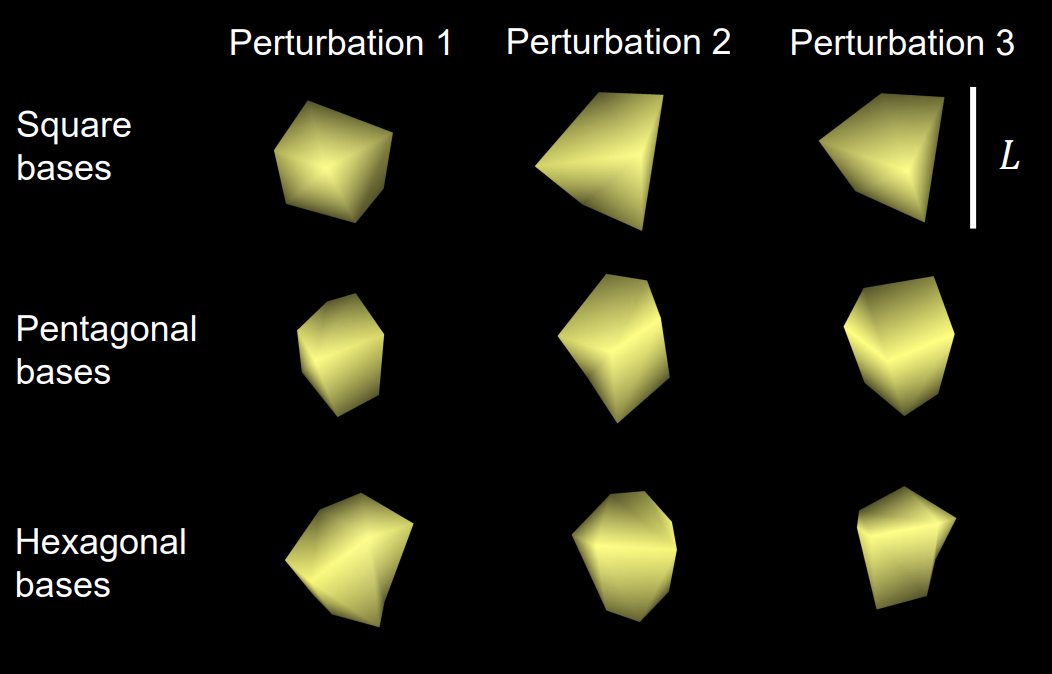
Cell generationHepatocytes are polygonal cells that occupy up to 85% of the human liver volume19. Here we generated synthetic 3D hepatocyte-like cells by perturbing the geometry of regular prisms of size $$$L$$$ (base-to-base height of $$$L$$$, square/pentagonal/hexagonal bases).
All vertices of the triangularly-meshed prisms were displaced at random, drawing displacements from a normal distribution ($$$\sigma\,=\,0.1\,\,L$$$). 15 cells for each of 33 values of $$$L$$$ in [11; 60] µm were considered (increment of 1.5 µm; 5 perturbations for each base shape). Such a range for ensures that typical mammal hepatocytes sizes (e.g. 20-30 µm in humans20, 30-50 µm in mice21) and pathological processes (preneoplastic volume increase22; increased cancer cellularity23) are considered. In total, 510 synthetic cells were studied (examples in Figure 1).
MC simulations
We performed MC simulations for all 510 cells using MCDC24. 1000 spins were uniformly distributed inside each cell, and random walks simulated for $$$TE$$$ = 140ms (3000 steps, $$$\Delta t$$$ = 47µs). We varied the intrinsic cell diffusivity $$$D_0$$$ in [0.20; 2.40] µm2 ms–1 (45 values; increment: 0.05 µm2 ms–1), for a total of 1485 $$$(D_0,L)$$$ pairs.
MRI signal synthesis
For each fixed $$$(D_0,L)$$$ pair, we pooled together all spin trajectories $$$\mathtt{\mathbf{r}}_n(t)$$$ and synthesised the signal as
$$
s \,\,=\,\, \left | \,\, \frac{1}{N} \sum_{n=1}^{N} \,\,e^{-j\gamma \sum_{t=0}^{TE} \mathrm{\mathbf{G}}^T(t)\,\mathrm{\mathbf{r}}_n(t)\,\Delta t } \,\, \right |\,\,\,\,\,\,[Eq.\,1]
$$
where $$$N$$$ is the total number of spins.
We considered ideal single-diffusion encoding25 gradient waveforms $$$\mathrm{\mathbf{G}}(t)$$$, with clinically-realistic gradient duration/separation δ/Δ, fixing δ = 20 ms and varying Δ (Δ = {25, 50, 75} ms). For each Δ, we synthesised DW measurements for 8 different b-values, uniformly spaced in [0; $$$b_{\mathrm{max}}$$$] ($$$b_{\mathrm{max}}$$$ = {500, 1000, 1500, 2000} s mm–2), by averaging signals from three mutually orthogonal gradients.
Analysis
For each $$$(D_0,L)$$$ at given Δ and $$$b_{\mathrm{max}}$$$, we evaluated the apparent diffusion coefficient $$$D$$$ and apparent kurtosis excess $$$K$$$ via linear fitting of the b-value expansion26
$$
\mathrm{ln}(s)\,\,\,=\,\,\,-\,b\,D \,\,+\,\, \frac{K}{6}(b\,D)^2\,\,\,\,\,\,[Eq.\,2]
$$
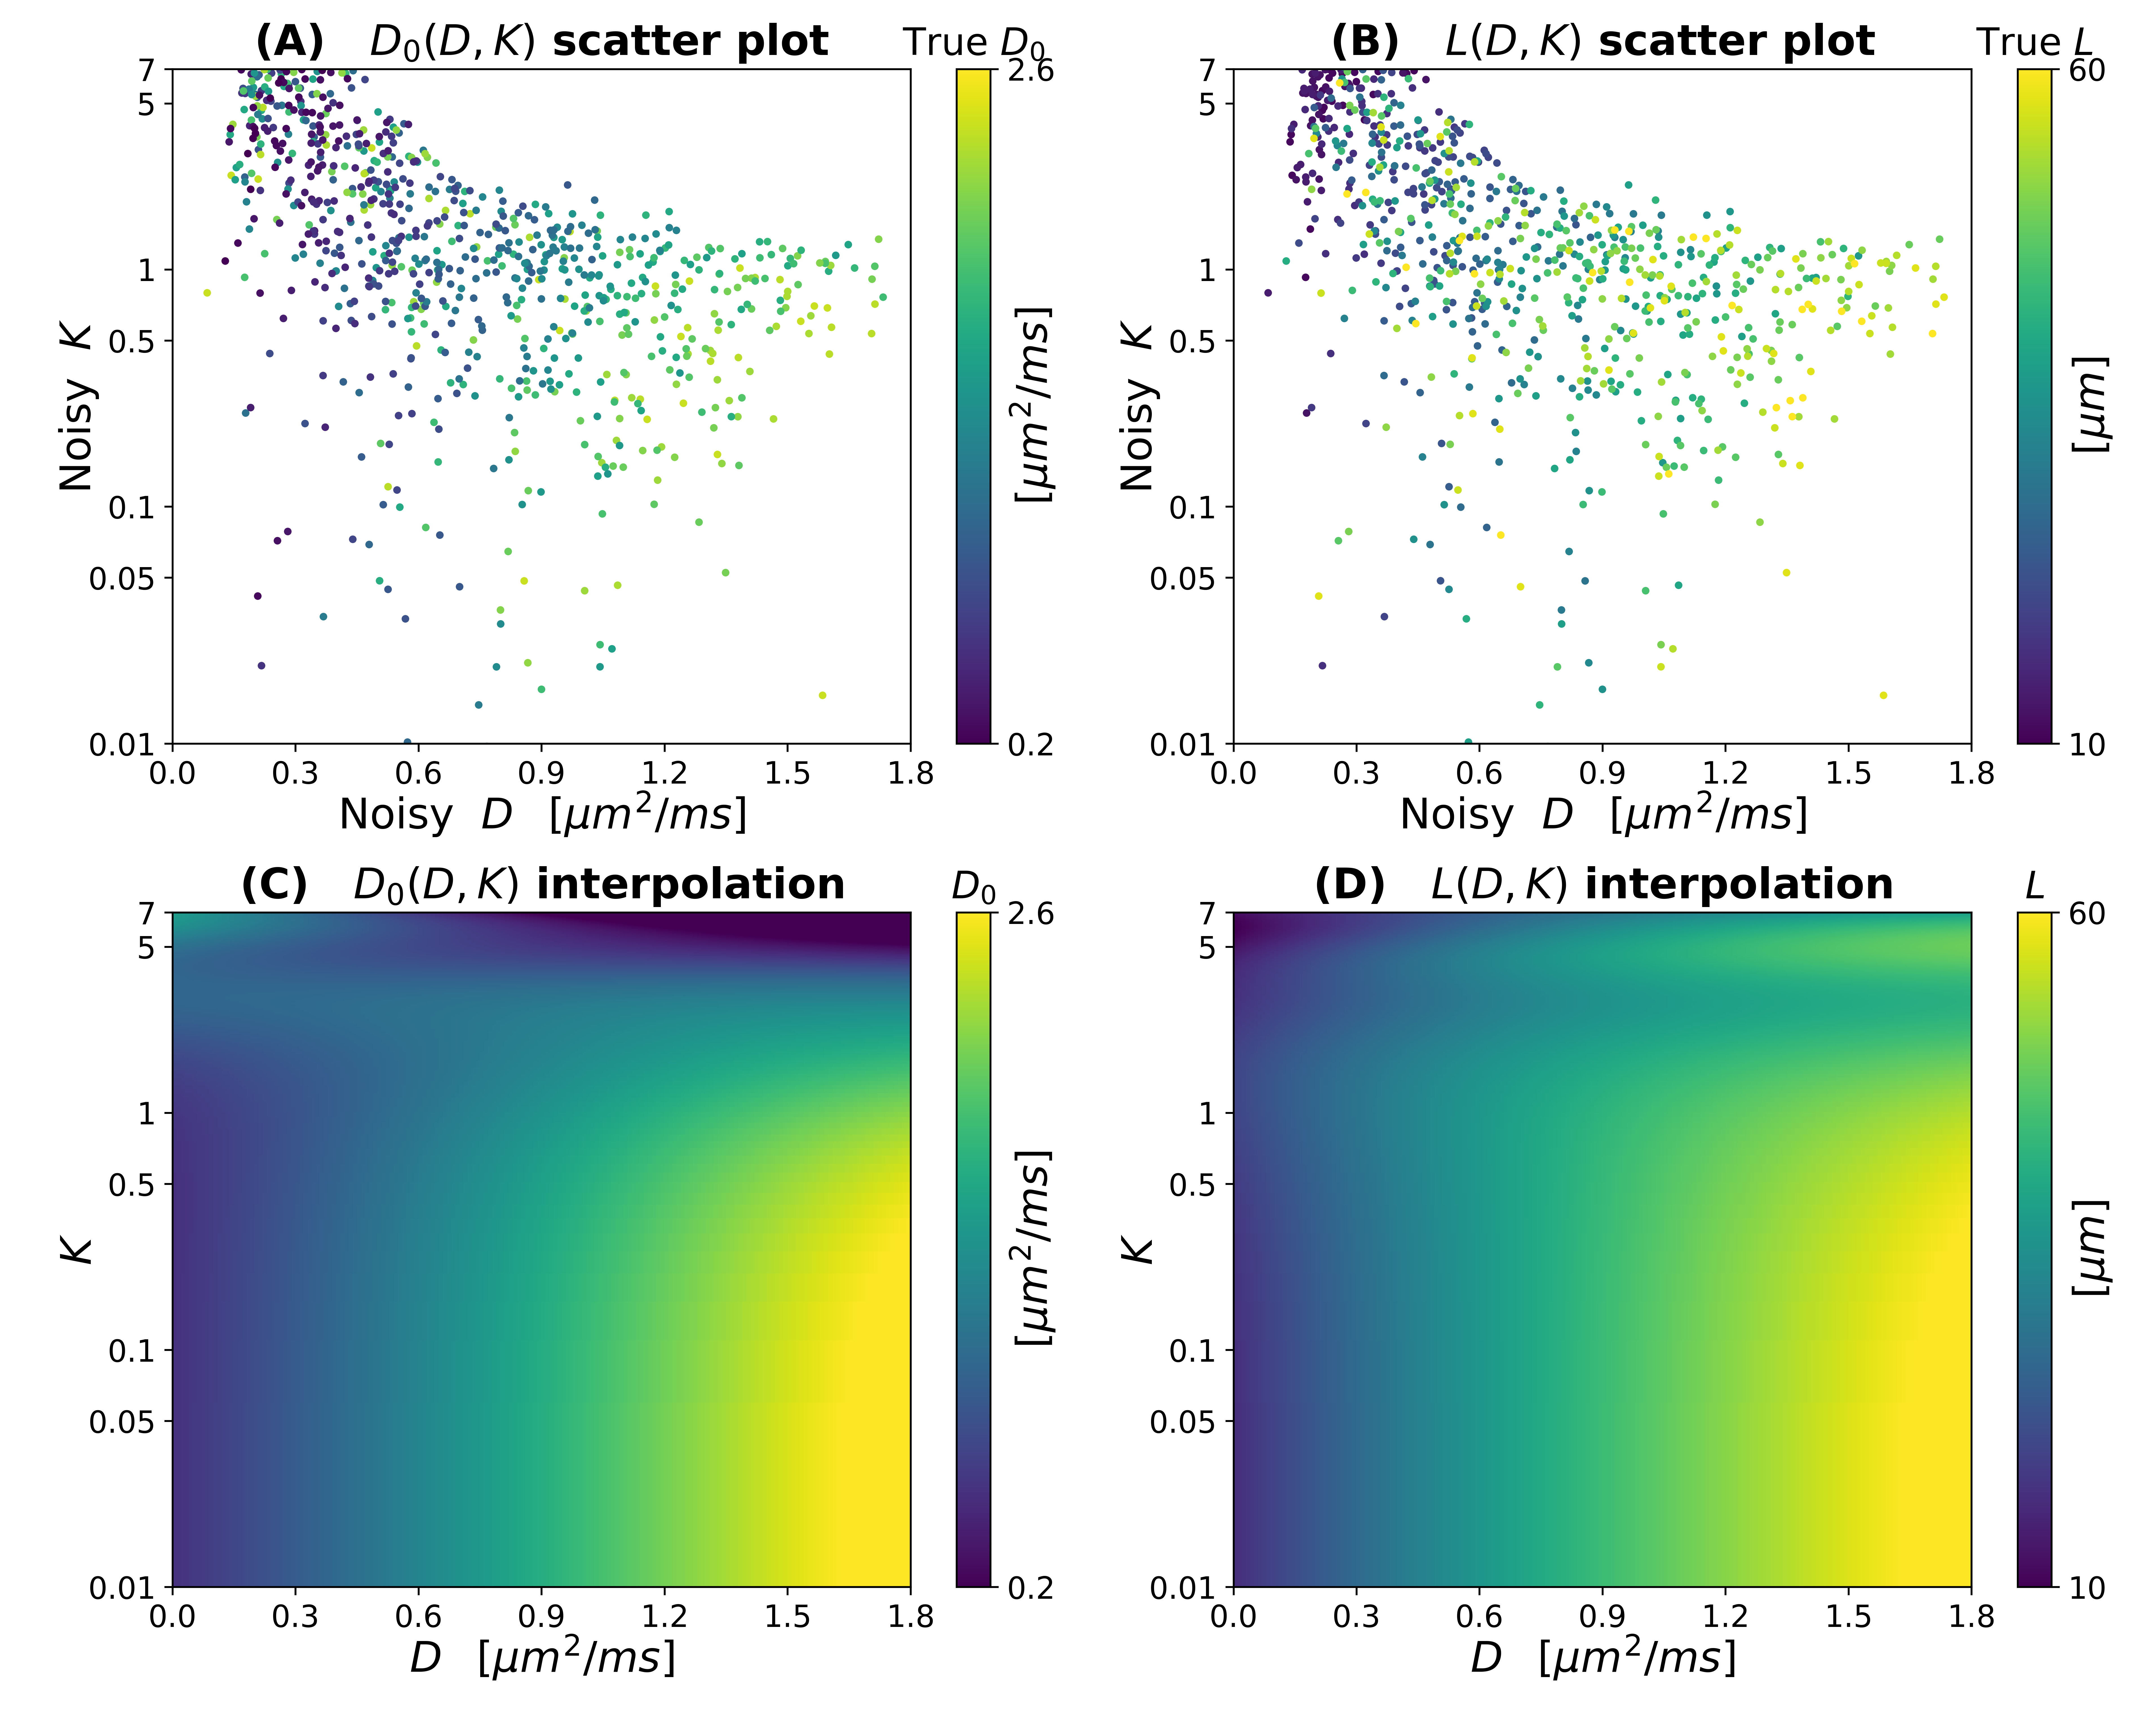
at different signal-to-noise ratio (SNR) levels (Rician noise; b=0 SNR = {20, 40, 60, 80, 100, $$$\infty$$$}). $$$D$$$ and $$$K$$$ carry a signature of the micro-environment within which diffusion takes place, being related to the 2nd and 4th cumulants of the spin displacement distribution27. Finally, we related signal properties $$$(D,K)$$$ to latent microstructural characteristics $$$(D_0,L)$$$ by means of colour-coded scatter plots. We interpolated the scatter plots and thus obtained smooth functions enabling the estimation of $$$(D_0,L)$$$ directly from $$$(D,K)$$$.
Results and discussion
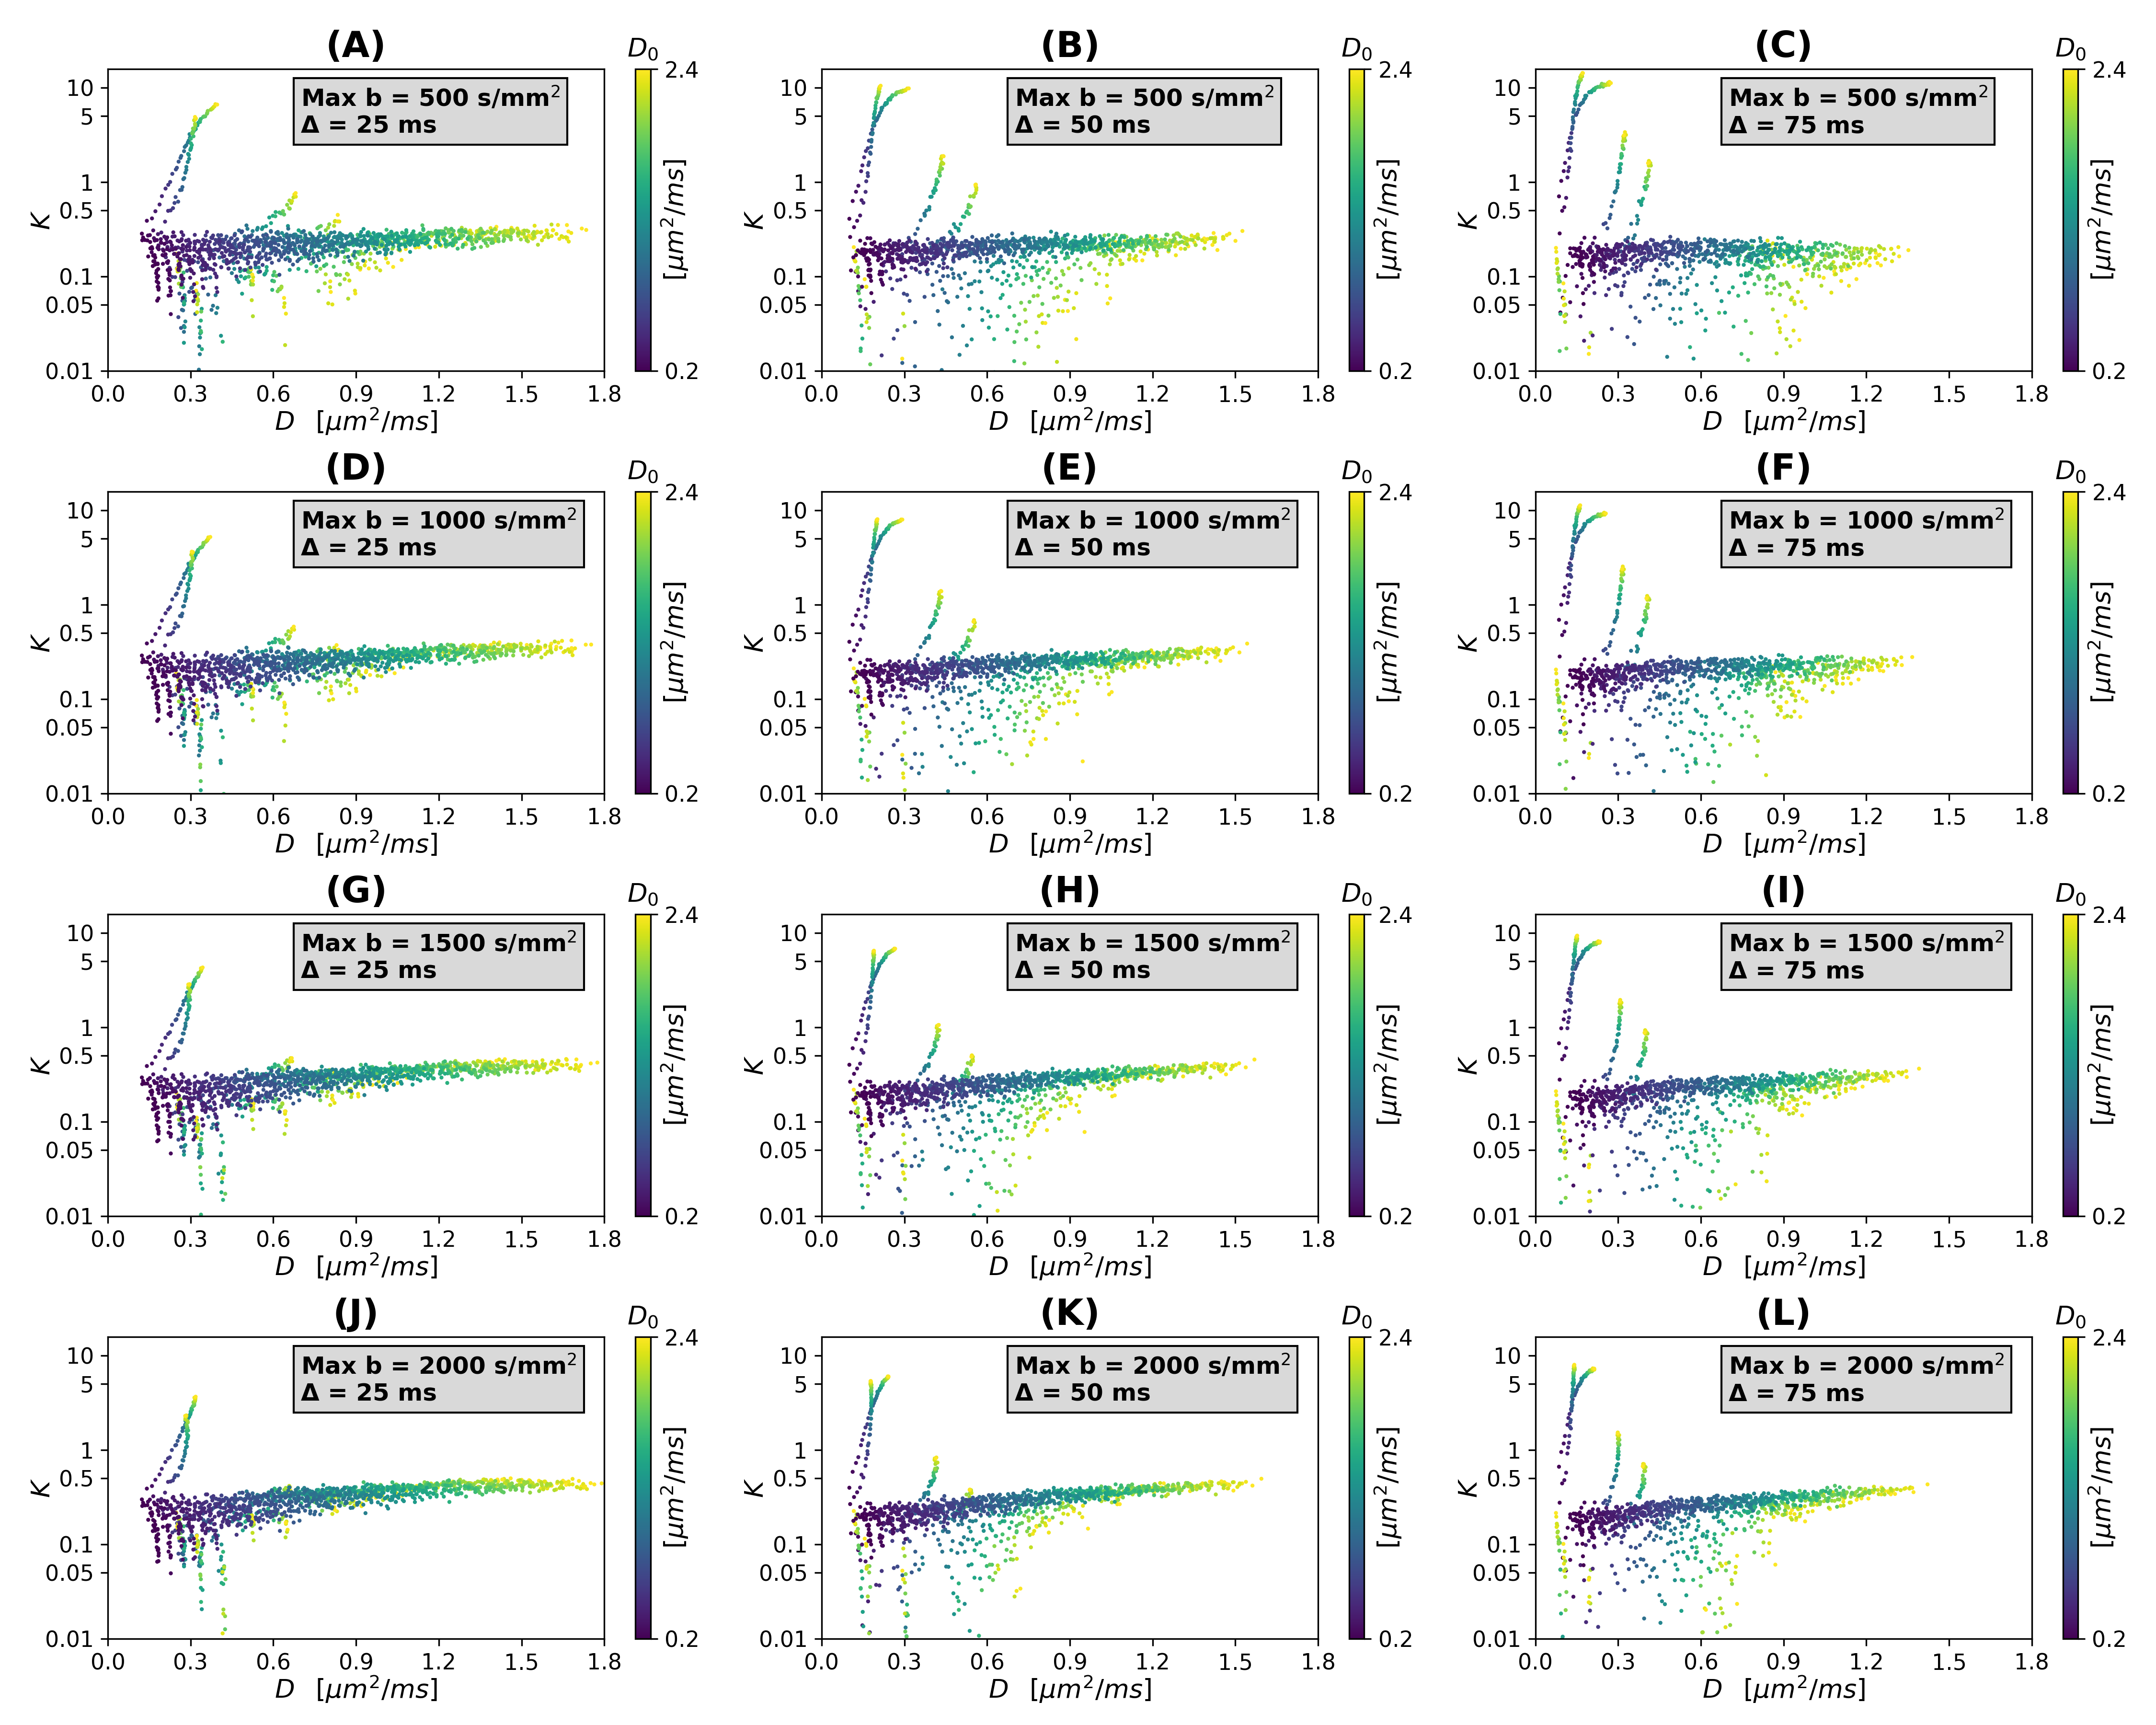
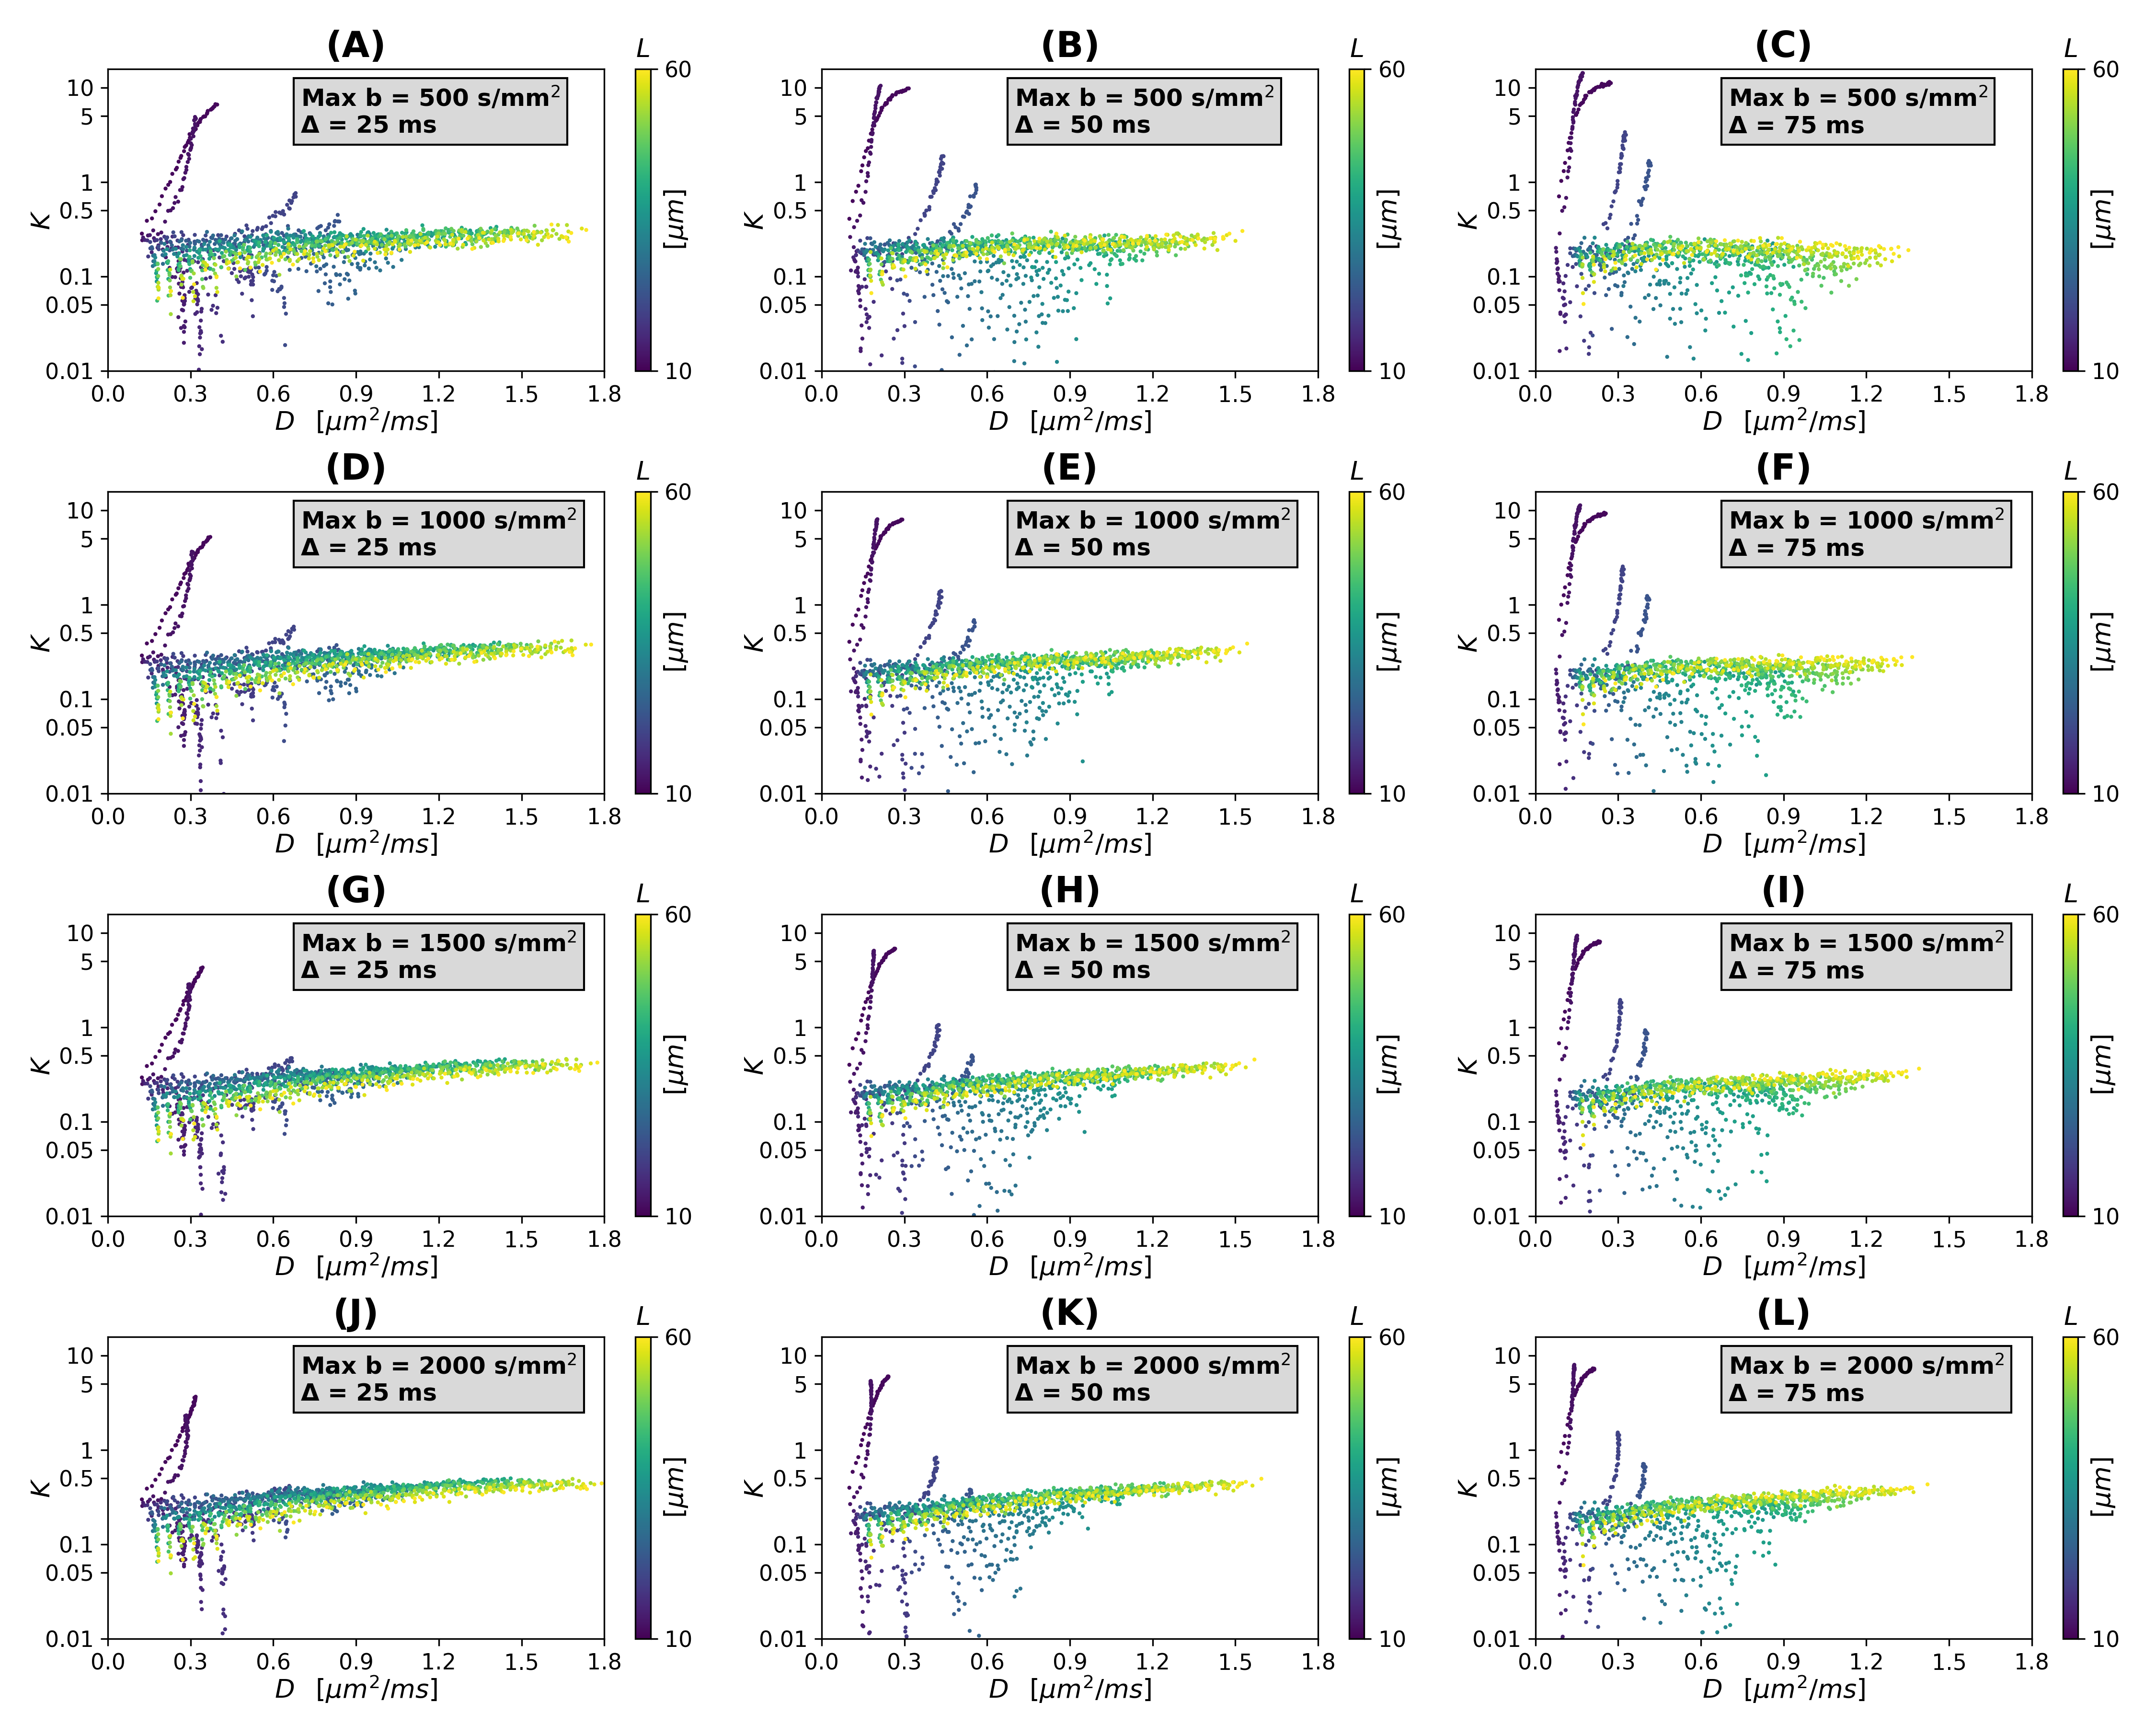
Scatter plots in Figures 2 and 3 illustrate theoretical relationships between $$$(D,K)$$$ and $$$(D_0,L)$$$ (SNR $$$\rightarrow \infty$$$). In general, the relationship between $$$(D,K)$$$ and both $$$D_0$$$ and $$$L$$$ is complex and non-monotonic. The range of observed $$$D$$$ values decreases as Δ increases, while $$$K$$$ increases slightly as $$$b_{\mathrm{max}}$$$ increases (especially for high $$$D_0$$$). This suggests that detailed knowledge of the MRI protocol (including the diffusion time) is essential to establish an accurate mapping $$$(D,K) \rightarrow (D_0,L)$$$. Interestingly, observations are distributed according to complex branching patterns in the $$$(D,K)$$$ plane, suggesting that certain combinations of $$$(D,K)$$$ may not be physically plausible.Figure 4 shows an example of interpolation of experimental observations and extrapolation to the whole $$$(D,K)$$$ domain in presence of noise (SNR = 20; case Δ = 50 ms, $$$b_{\mathrm{max}}$$$ = 1500 s mm–2). The figure shows that a wider range of $$$(D,K)$$$ can be observed in presence of noise, compared to infinite SNR. It also demonstrates the feasibility of estimating smooth functions mapping $$$(D,K) \rightarrow (D_0,L)$$$ .
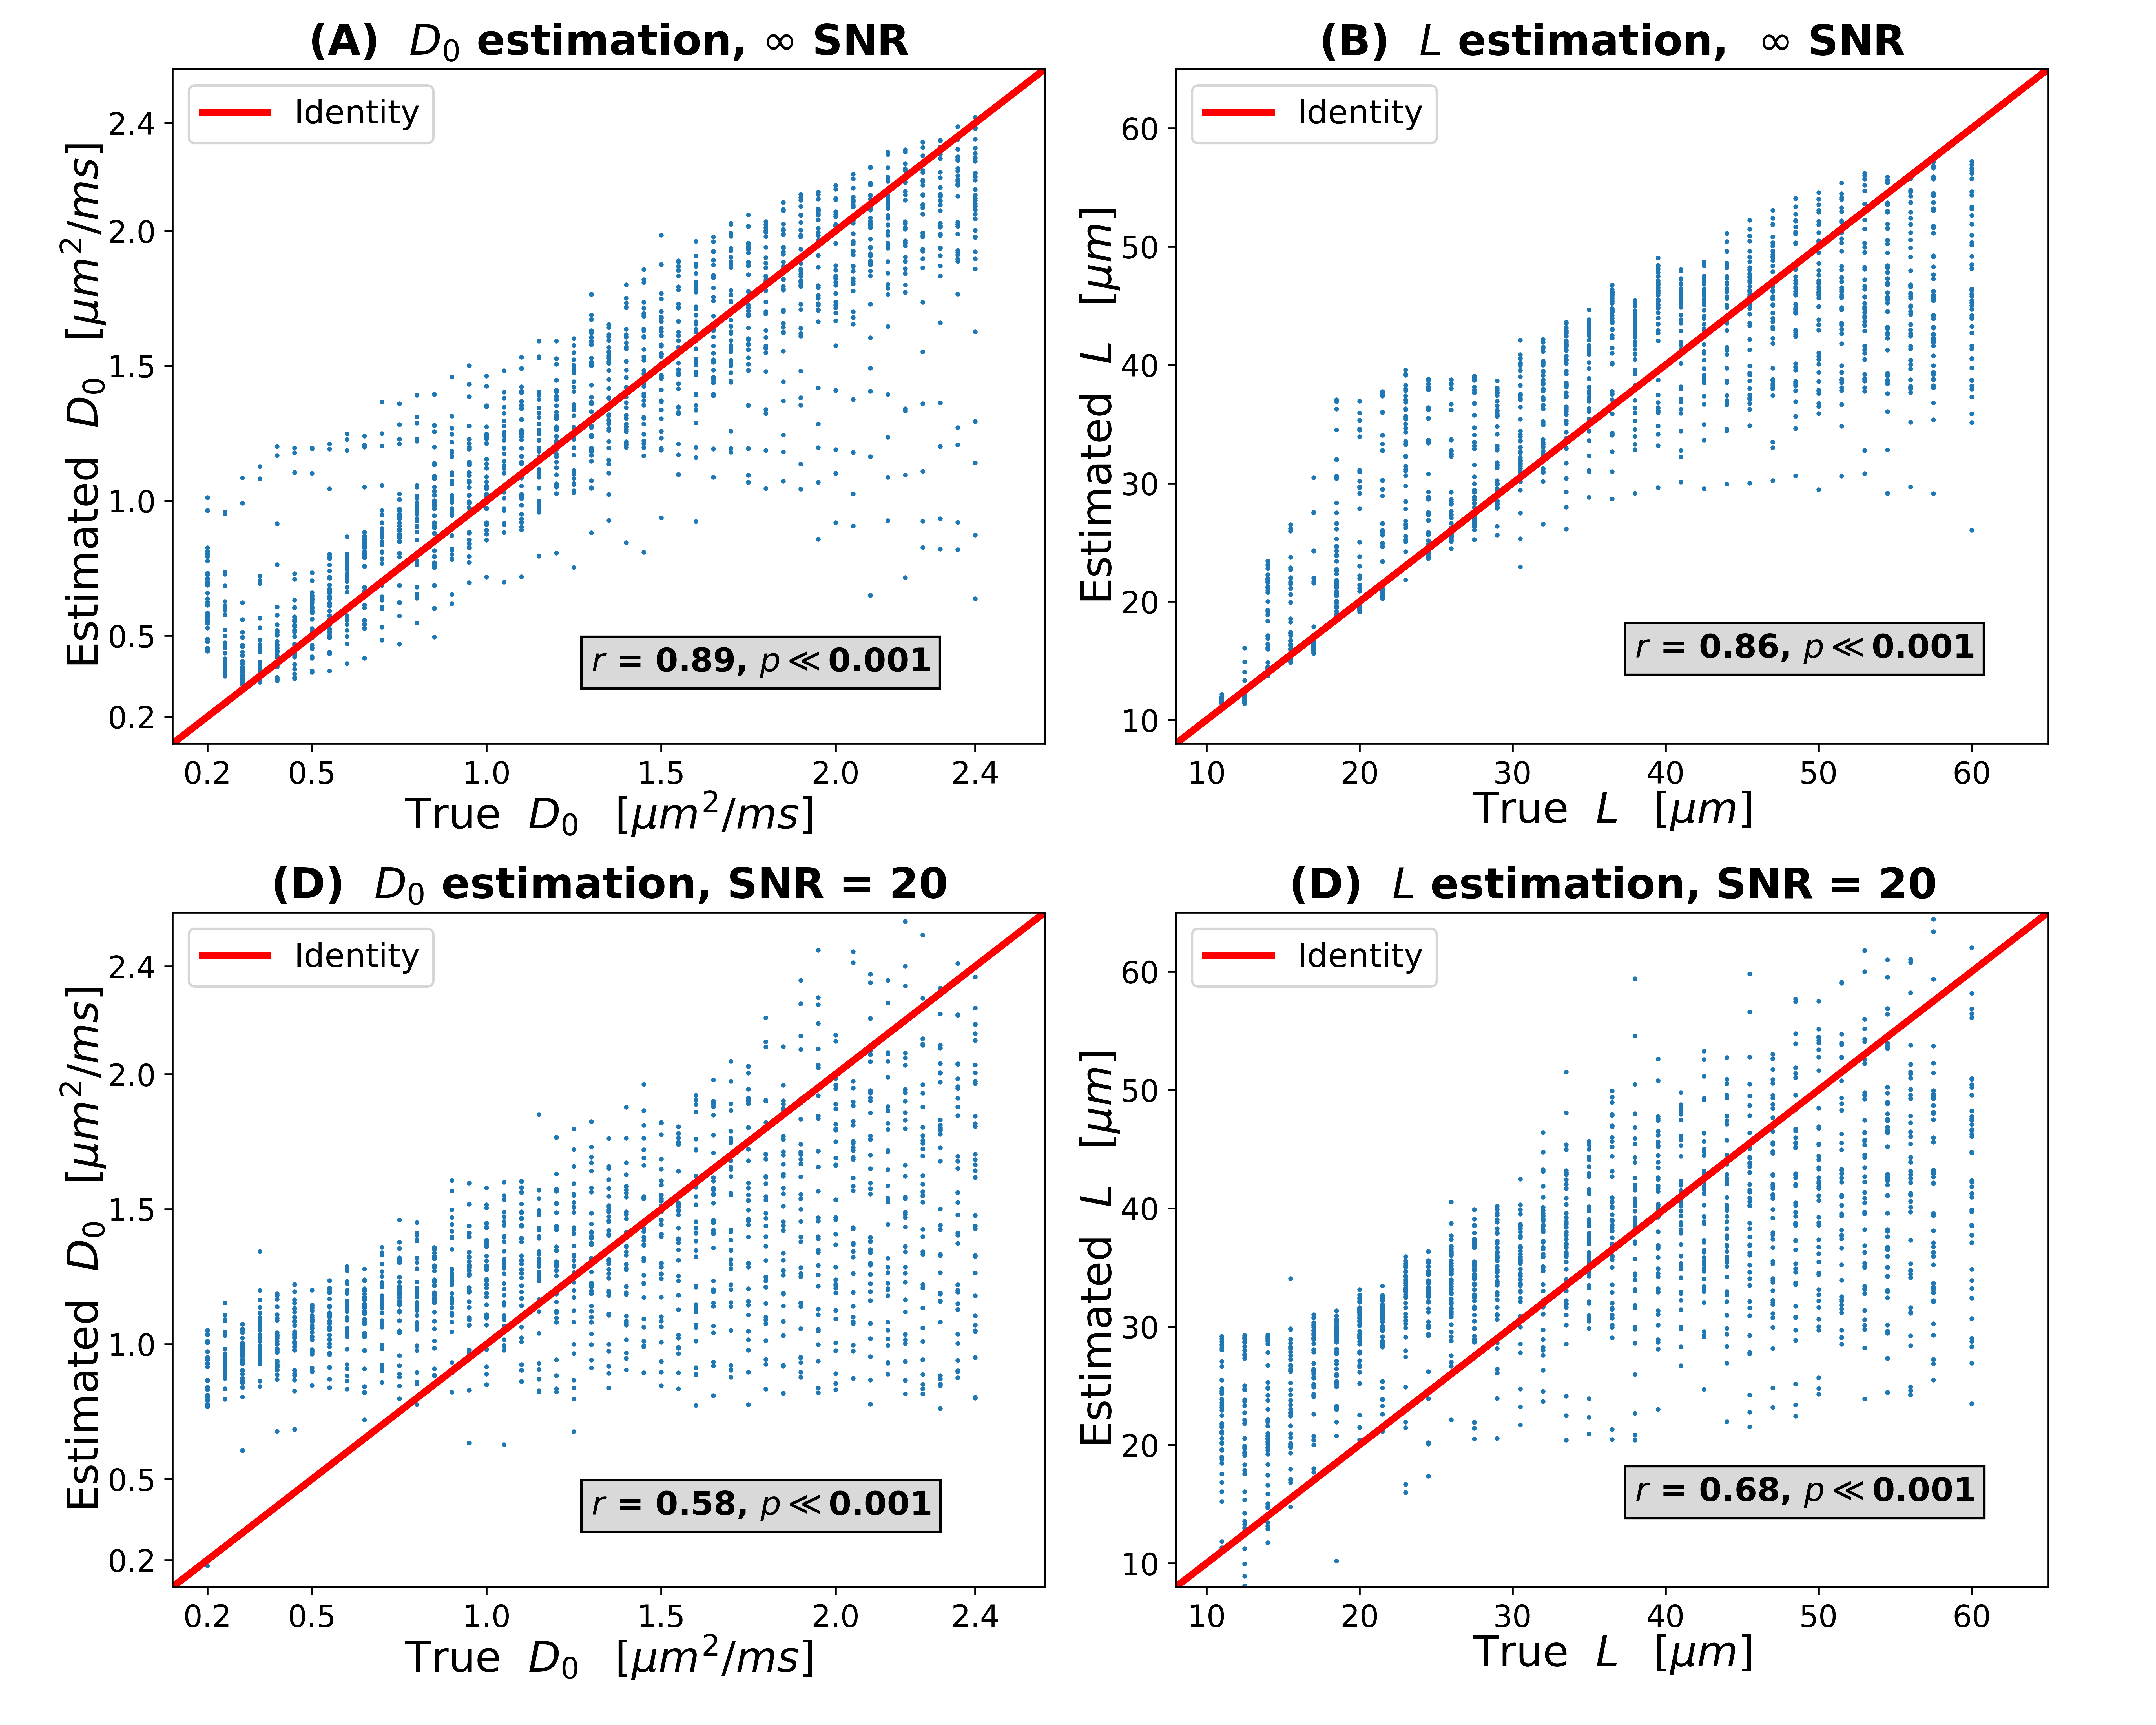
Figure 5 plots ground truth $$$(D_0,L)$$$ values against $$$(D_0,L)$$$ as predicted from $$$(D,K)$$$ using functions derived from scatter plot interpolation (SNR $$$\rightarrow \infty$$$ on top; SNR = 20 to the bottom). In general, there is a good agreement between ground truth and predicted $$$(D_0,L)$$$, even with SNR as low as 20. For SNR = 20, both of $$$D_0$$$ and $$$L$$$ are slightly overestimated as compared to the ground truth, but still sensitive to the underlying ground truth values (correlation coefficients of 0.58/0.68 for $$$D_0$$$/$$$L$$$).
Conclusions
Estimating indices sensitive to hepatic cell size and intrinsic diffusivity from signal measurements at fixed diffusion time is feasible, provided that both of apparent diffusivity and apparent kurtosis excess are computed. Future work is warranted to translate the present findings to clinical application in liver MRI.Acknowledgements
This project was supported by the investigator-initiated PREdICT study at the Vall d'Hebron Institute of Oncology (Barcelona), funded by AstraZeneca. FG is funded by PREdICT. KB is funded by a Beatriu de Pinós post-doctoral grant (2019BP/00182). RPL is supported by a CRIS Foundation Talent Award (TALENT19-05), the Instituto de Salud Carlos III-Investigación en Salud (PI18/01395) and the Prostate Cancer Foundation Young Investigator Award.References
[1] D. Le Bihan, “Looking into the functional architecture of the brain with diffusion MRI”, Nat. Rev. Neurosci., vol. 4, no. 6, pp. 469–480, Jun. 2003, doi: 10.1038/nrn1119.
[2] M. Rovaris et al., “Diffusion MRI in multiple sclerosis”, Neurology, vol. 65, no. 10, pp. 1526–1532, Nov. 2005, doi: 10.1212/01.wnl.0000184471.83948.e0.
[3] T. Tamada, T. Sone, Y. Jo, A. Yamamoto, and K. Ito, “Diffusion-weighted MRI and its role in prostate cancer”, NMR Biomed., vol. 27, no. 1, pp. 25–38, Jan. 2014, doi: 10.1002/nbm.2956.
[4] R. Perez-Lopez et al., “Diffusion-weighted Imaging as a Treatment Response Biomarker for Evaluating Bone Metastases in Prostate Cancer: A Pilot Study”, Radiology, vol. 283, no. 1, pp. 168–177, Apr. 2017, doi: 10.1148/radiol.2016160646.
[5] A. R. Martin et al., “Translating state-of-the-art spinal cord MRI techniques to clinical use: A systematic review of clinical studies utilizing DTI, MT, MWF, MRS, and fMRI”, NeuroImage Clin., vol. 10, pp. 192–238, 2016, doi: 10.1016/j.nicl.2015.11.019.
[6] H. Rahbar et al., “Utility of Diffusion-weighted Imaging to Decrease Unnecessary Biopsies Prompted by Breast MRI: A Trial of the ECOG-ACRIN Cancer Research Group (A6702)”, Clin. Cancer Res., vol. 25, no. 6, pp. 1756–1765, Mar. 2019, doi: 10.1158/1078-0432.CCR-18-2967.
[7] Y. Assaf, T. Blumenfeld-Katzir, Y. Yovel, and P. J. Basser, “Axcaliber: A method for measuring axon diameter distribution from diffusion MRI”, Magn. Reson. Med., vol. 59, no. 6, pp. 1347–1354, Jun. 2008, doi: 10.1002/mrm.21577.
[8] H. Zhang, T. Schneider, C. A. Wheeler-Kingshott, and D. C. Alexander, “NODDI: Practical in vivo neurite orientation dispersion and density imaging of the human brain”, Neuroimage, vol. 61, no. 4, pp. 1000–1016, Jul. 2012, doi: 10.1016/j.neuroimage.2012.03.072.
[9] D. S. Novikov, J. Veraart, I. O. Jelescu, and E. Fieremans, “Rotationally-invariant mapping of scalar and orientational metrics of neuronal microstructure with diffusion MRI”, Neuroimage, vol. 174, pp. 518–538, Jul. 2018, doi: 10.1016/j.neuroimage.2018.03.006.
[10] B. Lampinen et al., “Towards unconstrained compartment modeling in white matter using diffusion‐relaxation MRI with tensor‐valued diffusion encoding”, Magn. Reson. Med., vol. 84, no. 3, pp. 1605–1623, Sep. 2020, doi: 10.1002/mrm.28216.
[11] B. Jeurissen, J.-D. Tournier, T. Dhollander, A. Connelly, and J. Sijbers, “Multi-tissue constrained spherical deconvolution for improved analysis of multi-shell diffusion MRI data”, Neuroimage, vol. 103, pp. 411–426, Dec. 2014, doi: 10.1016/j.neuroimage.2014.07.061.
[12] E. T. McKinnon, J. A. Helpern, and J. H. Jensen, “Modeling white matter microstructure with fiber ball imaging”, Neuroimage, vol. 176, pp. 11–21, Aug. 2018, doi: 10.1016/j.neuroimage.2018.04.025.
[13] S. N. Jespersen, L. A. Leigland, A. Cornea, and C. D. Kroenke, “Determination of axonal and dendritic orientation distributions within the developing cerebral cortex by diffusion tensor imaging”, IEEE Trans. Med. Imaging, vol. 31, no. 1, pp. 16–32, 2012, doi: 10.1109/TMI.2011.2162099.
[14] E. Panagiotaki et al., “Microstructural Characterization of Normal and Malignant Human Prostate Tissue With Vascular, Extracellular, and Restricted Diffusion for Cytometry in Tumours Magnetic Resonance Imaging”, Invest. Radiol., vol. 50, no. 4, pp. 218–227, Apr. 2015, doi: 10.1097/RLI.0000000000000115.
[15] A. Chatterjee et al., “Diagnosis of Prostate Cancer with Noninvasive Estimation of Prostate Tissue Composition by Using Hybrid Multidimensional MR Imaging: A Feasibility Study”, Radiology, vol. 287, no. 3, pp. 864–873, Jun. 2018, doi: 10.1148/radiol.2018171130.
[16] V. Brancato, C. Cavaliere, M. Salvatore, and S. Monti, “Non-Gaussian models of diffusion weighted imaging for detection and characterization of prostate cancer: a systematic review and meta-analysis”, Sci. Rep., vol. 9, no. 1, p. 16837, Dec. 2019, doi: 10.1038/s41598-019-53350-8.
[17] G. Lemberskiy, E. Fieremans, J. Veraart, F.-M. Deng, A. B. Rosenkrantz, and D. S. Novikov, “Characterization of Prostate Microstructure Using Water Diffusion and NMR Relaxation”, Front. Phys., vol. 6, Sep. 2018, doi: 10.3389/fphy.2018.00091.
[18] L. Li and H. Wang, “Heterogeneity of liver cancer and personalized therapy”, Cancer Lett., vol. 379, no. 2, pp. 191–197, Sep. 2016, doi: 10.1016/j.canlet.2015.07.018.
[19] Z. Zhou, M.-J. Xu, and B. Gao, “Hepatocytes: a key cell type for innate immunity”, Cell. Mol. Immunol., vol. 13, no. 3, pp. 301–315, May 2016, doi: 10.1038/cmi.2015.97.
[20] H. Imamura, S. Kawasaki, J. Shiga, Y. Bandai, K. Sanjo, and Y. Idezuki, “Quantitative evaluation of parenchymal liver cell volume and total hepatocyte number in cirrhotic patients”, Hepatology, vol. 14, no. 3, pp. 448–453, Sep. 1991, doi: 10.1002/hep.1840140308.
[21] N. C. Martin, C. T. McCullough, P. G. Bush, L. Sharp, A. C. Hall, and D. J. Harrison, “Functional analysis of mouse hepatocytes differing in DNA content: Volume, receptor expression, and effect of IFN”, J. Cell. Physiol., vol. 191, no. 2, pp. 138–144, May 2002, doi: 10.1002/jcp.10057.
[22] E. M. Jack et al., “Increase in hepatocyte and nuclear volume and decrease in the population of binucleated cells in preneoplastic foci of rat liver: A stereological study using the nucleator method”, Hepatology, vol. 11, no. 2, pp. 286–297, Feb. 1990, doi: 10.1002/hep.1840110220.
[23] M. Schlageter, L. M. Terracciano, S. D’Angelo, and P. Sorrentino, “Histopathology of hepatocellular carcinoma”, World J. Gastroenterol., vol. 20, no. 43, p. 15955, 2014, doi: 10.3748/wjg.v20.i43.15955.
[24] J. Rafael-Patino, D. Romascano, A. Ramirez-Manzanares, E. J. Canales-Rodríguez, G. Girard, and J.-P. Thiran, “Robust Monte-Carlo Simulations in Diffusion-MRI: Effect of the Substrate Complexity and Parameter Choice on the Reproducibility of Results”, Front. Neuroinform., vol. 14, Mar. 2020, doi: 10.3389/fninf.2020.00008.
[25] N. Shemesh et al., “Conventions and nomenclature for double diffusion encoding NMR and MRI”, Magn. Reson. Med., vol. 75, no. 1, pp. 82–87, Jan. 2016, doi: 10.1002/mrm.25901.
[26] J. H. Jensen, J. A. Helpern, A. Ramani, H. Lu, and K. Kaczynski, “Diffusional kurtosis imaging: The quantification of non-gaussian water diffusion by means of magnetic resonance imaging”, Magn. Reson. Med., vol. 53, no. 6, pp. 1432–1440, Jun. 2005, doi: 10.1002/mrm.20508.
[27] D. S. Novikov, V. G. Kiselev, and S. N. Jespersen, “On modeling”, Magn. Reson. Med., vol. 79, no. 6, pp. 3172–3193, Jun. 2018, doi: 10.1002/mrm.27101.
Figures