2463
Intra-compartmental kurtosis biases tensor-valued multidimensional diffusion1Champalimaud Research, Champalimaud Centre for the Unknown, Lisbon, Portugal, 2Center of Functionally Integrative Neuroscience (CFIN) and MINDLab, Clinical Institute, Aarhus University, Aarhus, Denmark, 3Department of Physics and Astronomy, Aarhus University, Aarhus, Denmark
Synopsis
Multidimensional diffusion encoding (MDE) has been gaining attention for its potential to describe tissue microstructure with enhanced specificity by resolving kurtosis sources, albeit with significant assumptions (no time dependence, no intra-compartmental kurtosis). Correlation Tensor Imaging (CTI) has been introduced as a novel methodology capable of resolving kurtosis sources without relying on a-priori assumptions. Here, we harnessed CTI to validate the accuracy of tensor-valued MDE metrics and assess the importance of intra-compartmental kurtosis (Kintra) in tissues. Our results reveal that Kintra is non-negligible and skews the estimates of tensor-valued MDE approaches, even in the absence of detectable diffusion time dependence.
Introduction
Diffusional Kurtosis Imaging (DKI) quantifies the degree of non-Gaussian diffusion1, leading to improved sensitivity towards microstructural alterations in both health and disease2,3. Multidimensional diffusion encoding (MDE) aims to improve DKI’s specificity by resolving kurtosis into different sources4-6 that are inherently conflated in single diffusion encoding (SDE) measurements. For instance, the tensor-valued information of MDE acquisitions was proposed to decouple sources of anisotropic and isotropic kurtosis ($$$K_{aniso}$$$ and $$$K_{iso}$$$)4,5. However, a critical assumption is that the underlying system can be represented by a sum of Gaussian diffusion components, ignoring 1) diffusion time-dependence7-9 and 2) non-Gaussian diffusion effects due to the restricted diffusion or structural disorder (i.e., intra-compartmental kurtosis $$$K_{intra}$$$)6,10,11.Correlation Tensor Imaging (CTI)6 has been recently introduced to more generally resolve different kurtosis sources using signals acquired with double diffusion encoding (DDE) acquisitions12,13. At long mixing times, CTI reliably measures $$$K_{aniso}$$$, $$$K_{iso}$$$ and $$$K_{intra}$$$ without relying on the Gaussian assumption (at the expense of longer acquisition times)6.
Here, the above approaches are compared for the first-time using simulations and experiments, revealing that non-negligible $$$K_{intra}$$$ biases tensor-valued MDE estimates. Moreover, CTI is used to identifying the regimes in which MDE tensor-valued kurtosis estimates are still accurate.
Theory
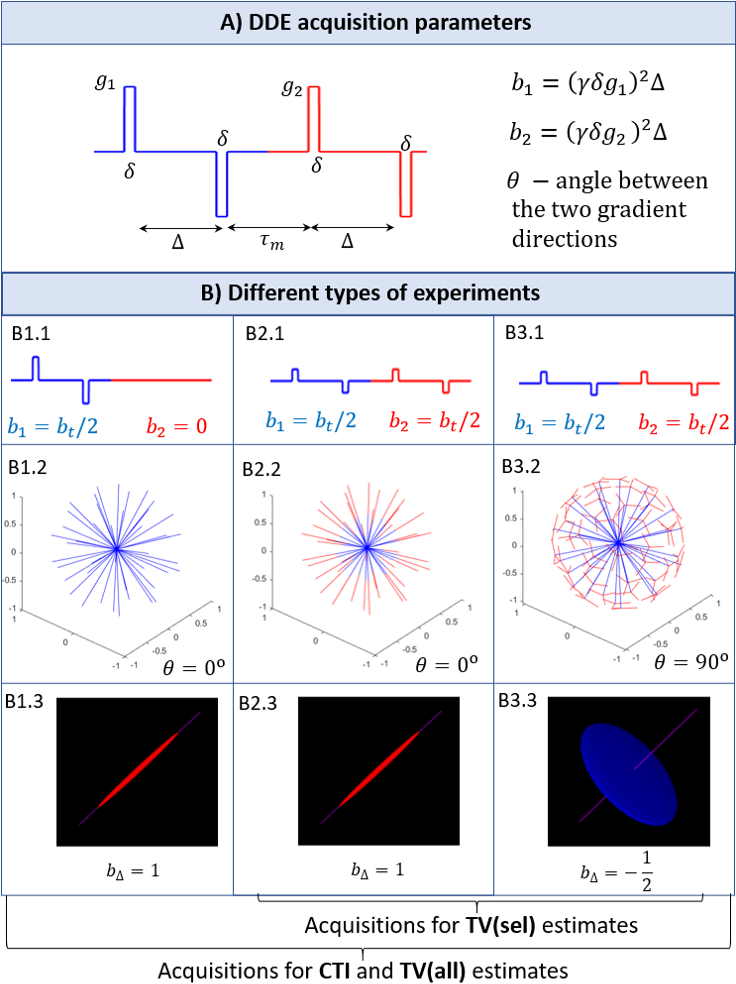
General CTI approach: At the long mixing time regime, powder-averaged DDE signals can be expressed by:$$\log\left(\frac{\bar{S}(b_1,b_2,\theta)}{S_0}\right)=-(b_1+b_2)D+\frac{1}{6}(b_1^2+b_2^2)D^2K_t\\+\frac{1}{6}b_1b_2\cos^2(\theta)D^2K_{aniso}+\frac{1}{6}b_1b_2D^2(2K_{iso}-K_{aniso})$$(1)
where $$$b_1$$$ and $$$b_1$$$ are the b-values associated with the two DDE gradients, $$$\theta$$$ is the angle between them, $$$D$$$ is the mean diffusivity, and the total kurtosis $$$K_t$$$ is the sum of its sources ($$$K_t=K_{aniso}+K_{iso}+K_{intra}$$$). To resolve the kurtosis sources from Eq. 1, three different types of experiments are required (Fig.1) which are repeated for at least two non-zero total b-values ($$$b_t=b_1+b_2$$$) and several powder-averaging orientations6.
Tensor-valued approach: Under the Gaussian diffusion assumption and axial encoding, powder-average MDE signals can be expressed as5,14:$$\log\left(\frac{\bar{S}(b_t,b_\Delta)}{S_0}\right)=-b_tD+\frac{1}{6}b_t^2D^2K_ {iso}+\frac{1}{6}b_t^2b_{\Delta}^2D^2K_{aniso}$$(2)
where $$$b_{\Delta}$$$ describes the b-tensor shape. To resolve $$$K_{aniso}$$$ and $$$K_{iso}$$$ from Eq. 2, data for at least two $$$b_{\Delta}$$$ and two $$$b_t$$$ values are required. In this study, tensor-valued (TV) estimates are obtained from the same data as for CTI, since they are associated with two different $$$b_{\Delta}$$$ values (Fig.1). TV estimates are first obtained for all data of the three experiments in Fig.1 (TV(all) estimates). Note that the experiment B1 in Fig.1 has a different encoding profile than the experiments B2 and B3. To assess the robustness of kurtosis estimates from data acquired for a single enconding profile type, TV estimates are also computed using the selected data from experiments B2 and B3 (TV(sel) estimates).
Methods
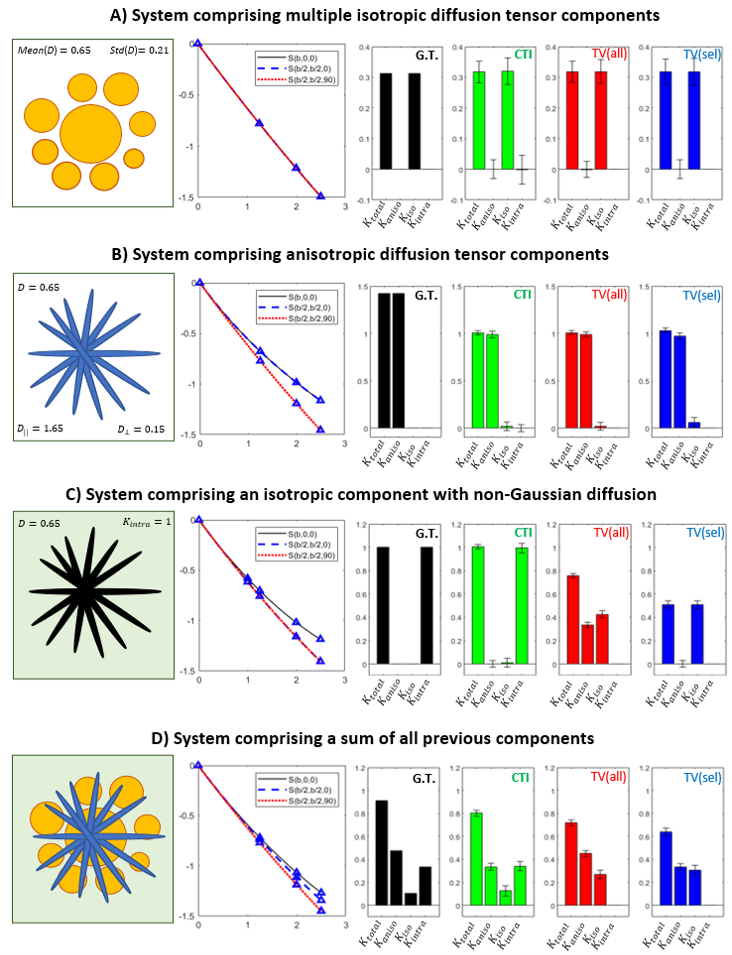
Simulations: Synthetic signals were produced for four systems with known ground truth kurtosis sources (Fig.2): 1) isotropic Gaussian components; 2) randomly oriented anisotropic Gaussian components; 3) single non-Gaussian diffusion component; and 4) all components combined. All simulations parameters were matched to the experimetnal MRI acquisition parameters.MRI experiments: Animal experiments were preapproved by the competent institutional and national authorities (European Directive 2010/63). Data was acquired from N=3 female Long Evans rats (19-22 weeks old) under anesthesia (~2.5% Isoflurane) on a 9.4T Bruker Biospec scanner equipped with an 86 mm quadrature transmission coil and 4-element array reception cryocoil. Acquisitions were performed for the experiments described in Fig.1 and repeated for $$$b_t$$$=1.25, 2, 2.5ms/μm2 together with 24 b=0 acquisitions per experiment. Other parameters: $$$\Delta=\tau_m$$$=12ms, $$$\delta$$$=3.5ms, TR/TE=3000/50.9ms, in-plane resolution = 200×200μm2, slice thickness = 0.9mm.
Results
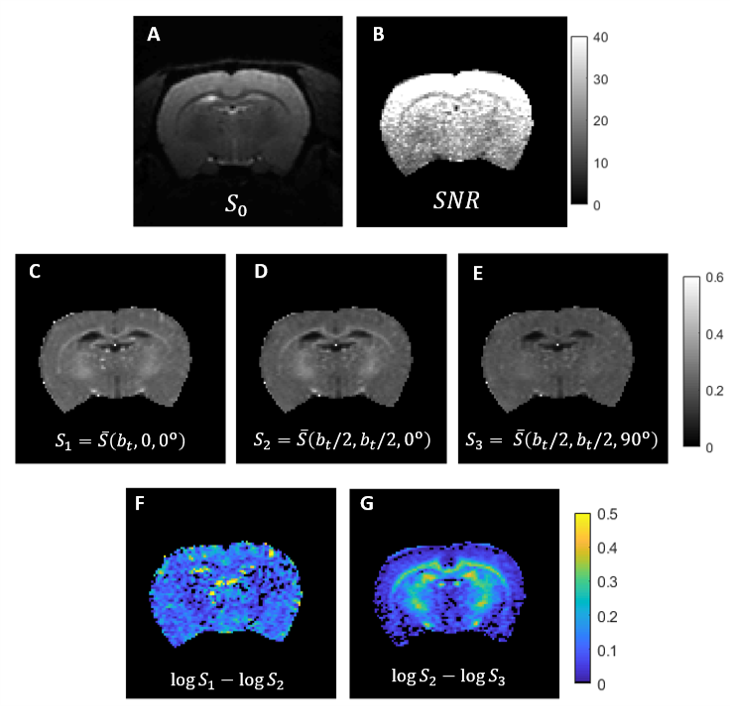
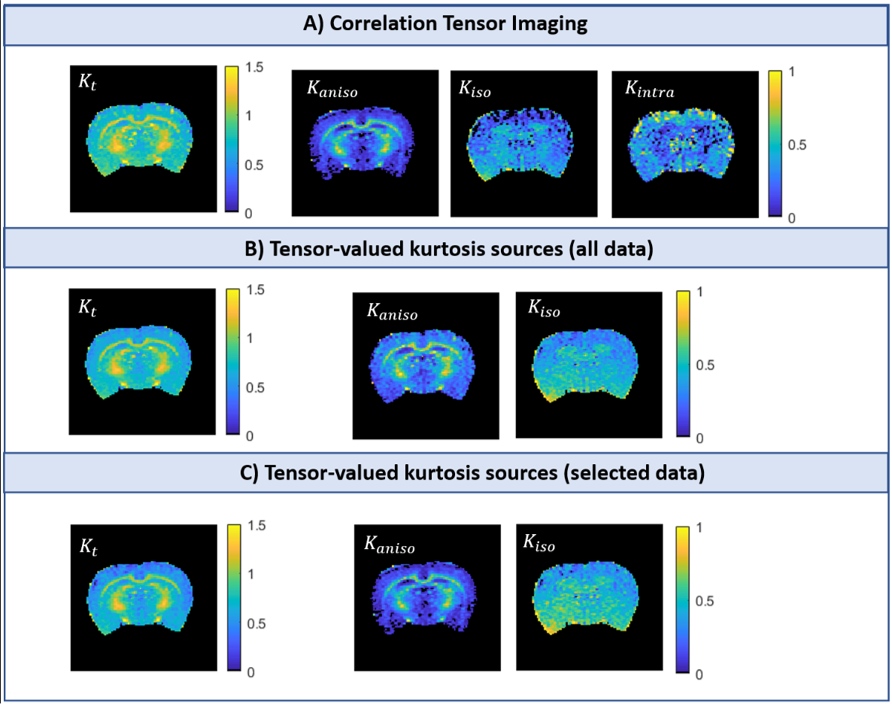
Simulations: Both CTI and tensor-valued approaches correctly estimate the different kurtosis sources for systems comprising only Gaussian components (Fig.2A-B). However, when intra-compartmental kurtosis is introduced, tensor-valued $$$K_{aniso}$$$ and $$$K_{iso}$$$ estimates are biased and overestimated (Fig.2C-D), while the CTI approach accurately resolves the kurtosis sources.Experiments: Fig.3 shows the raw powder-averaged signal decays for the three DDE experiments ($$$b_t=2.5$$$ms/μm2) of a representative slice. Although corresponding to acquisitions of identical b-tensor shapes, $$$\bar{S}(b_t,0,0^o)$$$ and $$$\bar{S}(b_t/2,b_t/2,0^o)$$$ signals present different intensities. Their log differences indicate the presence of positive $$$K_{intra}$$$ sources (Fig.3F). CTI and tensor-valued kurtosis estimates for this representative slice are shown in Fig.4, verifying positive CTI-$$$K_{intra}$$$ estimates from both grey and white matter.
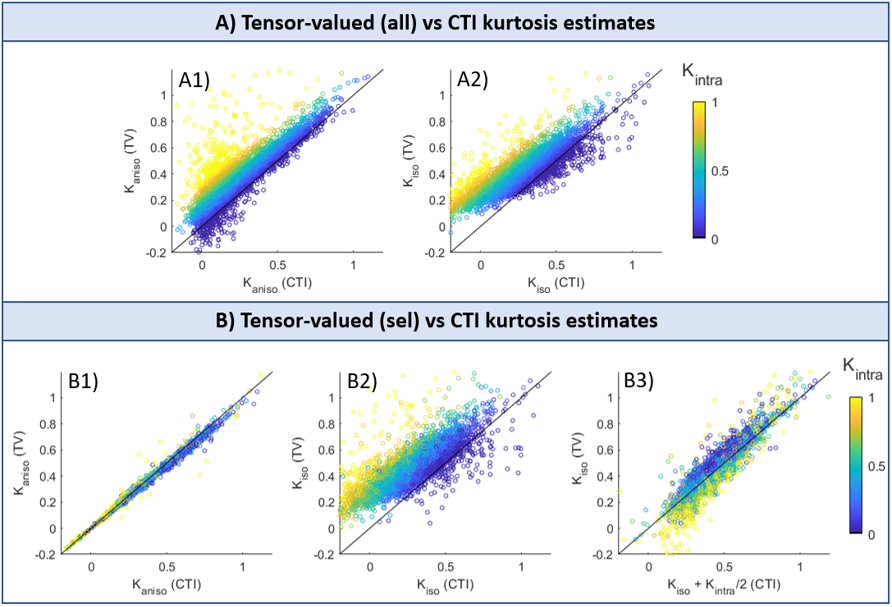
The scatter plots in Fig.5 confirm that most of the tensor-valued kurtosis estimates are overestimated when $$$K_{intra}\neq0$$$, except for $$$K_{aniso}$$$ from TV(sel) which match the $$$K_{aniso}$$$ estimates from CTI.
Discussion
Previous studies showed that kurtosis estimates from tensor-valued can be biased by effects of diffusion time-dependence7-9. Here, these effects are removed by using DDE acquisitions in the long mixing time regime and with fixed $$$\Delta$$$. Even under this ideal condition, we show that tensor-valued estimates can still be confounded by neglected $$$K_{intra}$$$ effects.Our results confirm that CTI can decouple $$$K_{aniso}$$$ and $$$K_{iso}$$$ estimates from $$$K_{intra}$$$, and that $$$K_{intra}$$$ is non-negligible, at least in rat brain in vivo. Moreover, we show that CTI can be useful to explore the biases of tensor-valued-based measures and explore its regimes of validity. Here we used CTI to: 1) validate the tensor-valued $$$K_{aniso}$$$ estimates when these are extracted from data acquired with constant gradient profiles (Fig.5B1); and 2) show that $$$K_{iso}$$$ estimates from these experiments are a combination of both isotropic and intra-compartmental kurtosis sources ($$$K_{iso}^{TV(sel)}=K_{iso}^{CTI}+K_{intra}^{CTI}/2$$$, Fig.5B3). In the future, our results will be expanded to assess the biases of tensor-valued kurtosis estimates from faster continuous waveform acquisitions14-15.
Acknowledgements
This study was funded by the European Research Council (ERC) (agreement No. 679058). We acknowledge the vivarium of the Champalimaud Centre for the Unknown, a facility of CONGENTO financed by Lisboa Regional Operational Programme (Lisboa 2020), project LISBOA01-0145-FEDER-022170.References
1. Jensen JH, Helpern JA, Ramani A, et al. Diffusional Kurtosis Imaging: The Quantification of Non-Gaussian Water Diffusion by Means of Magnetic Resonance Imaging, Magn. Reson. Med. 2005; 53: 1432–1440
2. Falangola MF, Jensen JH, Babb JS, et al. Age-related non-Gaussian diffusion patterns in the prefrontal brain. J. Magn. Reson. Imaging 2008; 28: 1345–1350. doi:10.1002/jmri.21604
3. Cheung JS, Wang E, Lo EH, Sun PZ. Stratification of heterogeneous diffusion MRI ischemic lesion with kurtosis imaging: evaluation of mean diffusion and kurtosis MRI mismatch in an animal model of transient focal ischemia. Stroke 2012; 43: 2252–4. doi: 10.1161/STROKEAHA.112.661926
4. Westin CF, Knutsson H, Pasternak O, et al. Q-space trajectory imaging for multidimensional diffusion MRI of the human brain. Neuroimage 2016; 135: 345–362. doi: 10.1016/j.neuroimage.2016.02.039
5. Szczepankiewicz F, van Westen D, Englund E, et al. The link between diffusion MRI and tumor heterogeneity: mapping cell eccentricity and density by diffusional variance decomposition (DIVIDE). NeuroImage. 2016;142: 522–532. doi: 10.1016/j.neuroimage.2016.07.038
6. Henriques RN, Jespersen SN, Shemesh N. Correlation tensor magnetic resonance imaging. Neuroimage 2020; 211: 116605. doi: 10.1016/j.neuroimage.2020.116605
7. Jespersen SN, Olesen JL, Ianus A, Shemesh N. Effects of nongaussian diffusion on “isotropic diffusion” measurements: an ex-vivo microimaging and simulation study. J. Magn. Reson. 2019; 300: 84–94. Doi: 10.1016/j.jmr.2019.01.007
8. Szczepankiewicz F, Lasic S, Nilsson C, et al. Is spherical diffusion encoding rotation invariant? An investigation of diffusion time dependence in the healthy brain. Proc. Intl. Soc. Mag. Reson. Med. 2019.
9. Lundell H, Nilsson M, Dyrby TB, et al. Multidimensional diffusion MRI with spectrally modulated gradients reveals unprecedented microstructural detail. Sci. Rep. 2019; 9: 9026.
10. Dhital B, Kellner E, Kiselev VG, Reisert M. The absence of a restricted water pool in brain white matter. Neuroimage 2018; 182: 398-406.
11. Lee HH, Papaioannou A, Kim SL, et al. A time-dependent diffusion MRI signature of axon caliber variations and beading. Communications biology. 2020; 3(1):1-13.
12. Cory DG, Garroway AN, Miller JB. Applications of spin transport as a probe of local geometry. Polym Prepr 1990; 31: 149.
13. Henriques RN, Polombo M, Jespersen SN, et al. Double diffusion encoding and applications for biomedical imaging. J. Neurosci. Methods 2020 (In Press). doi: 10.1016/j.jneumeth.2020.108989
14. Nilsson M, Szczepankiewicz F, Brabec J, et al., Tensor‐valued diffusion MRI in under 3 minutes: an initial survey of microscopic anisotropy and tissue heterogeneity in intracranial tumors. Magn. Reson. Med. 2020; 83: 608-620. doi: 10-1002/mrm.27959
15. Lundell H, Lasic S. Diffusion encoding with General gradient waveforms. In: Topgaard, D. (Ed.), Advanced Diffusion Encoding Methods in MRI. Royal Society of Chemistry 2020.
Figures