2461
Quantifying the Repeatability of Microstructural Measures Derived from Free Gradient Waveforms1Cardiff University Brain Research Imaging Centre, Cardiff, United Kingdom, 2Image Sciences Institute, University Medical Center Utrecht, Utrecht, Netherlands, 3Department of Neurosurgery, University Hospital of Wales, Cardiff, United Kingdom, 4BRAIN Biomedical Research Unit, Health & Care Research Wales, Cardiff, United Kingdom, 5Mary MacKillop Institute for Health Research, Australian Catholic University, Melbourne, Australia
Synopsis
Diffusional variance decomposition (DIVIDE) is a promising state-of-the-art approach to measure microscopic microstructure using ‘free’ gradient waveforms (including spherical and linear tensor encoding). Here, in a cohort of 6 participants scanned 5 times each with the DIVIDE protocol, we quantify the microscopic FA (μFA) and isotropic and anisotropic diffusional variance (MKi and MKa) across scans, thus demonstrating high test-retest repeatability.
Introduction
Diffusional variance decomposition (DIVIDE)1 is a promising technique for estimation of microstructural features from diffusion MRI data. Taking advantage of both linear and spherical tensor encoding, DIVIDE1 allows the probing of orientation independent microscopic features such as microscopic fractional anisotropy, yet its statistical reliability across multiple subjects and sessions is unknown. In this work we demonstrate the statistical repeatability via measures of variation and correlation of measures derived from DIVIDE on an ultra-high gradient MRI scanner, thereby supporting DIVIDE in applications that target subtle/longitudinal changes of microstructure.Methods
Data. MRI brain scans were performed on an ultra-stong gradient (300mT/m) 3T MRI scanner (MAGNETOM Skyra CONNECTOM) in six healthy human adults (3 female, age range 24-30). The DIVIDE sequence was acquired 5 times within a two-week period with the following parameters: echo time =160ms, repetition time= 2000ms, 96x96 acquisition matrix, spatial resolution = 3mm3, spherical diffusion encoding obtained with the NOW toolbox2, 15 repetitions p/bval, linear diffusion encoding with 15 directions3, 10 equidistant b-values 100-2800 s/mm2 by modulating the gradient amplitude.Processing. The data were corrected for drift4, motion5, susceptibility distortion6 and Gibbs ringing7 and processed using the DIVIDE pipeline1. Microscopic FA (μFA) was computed in each voxel in addition to isotropic and anisotropic diffusional variance maps, MKi and MKa, respectively.
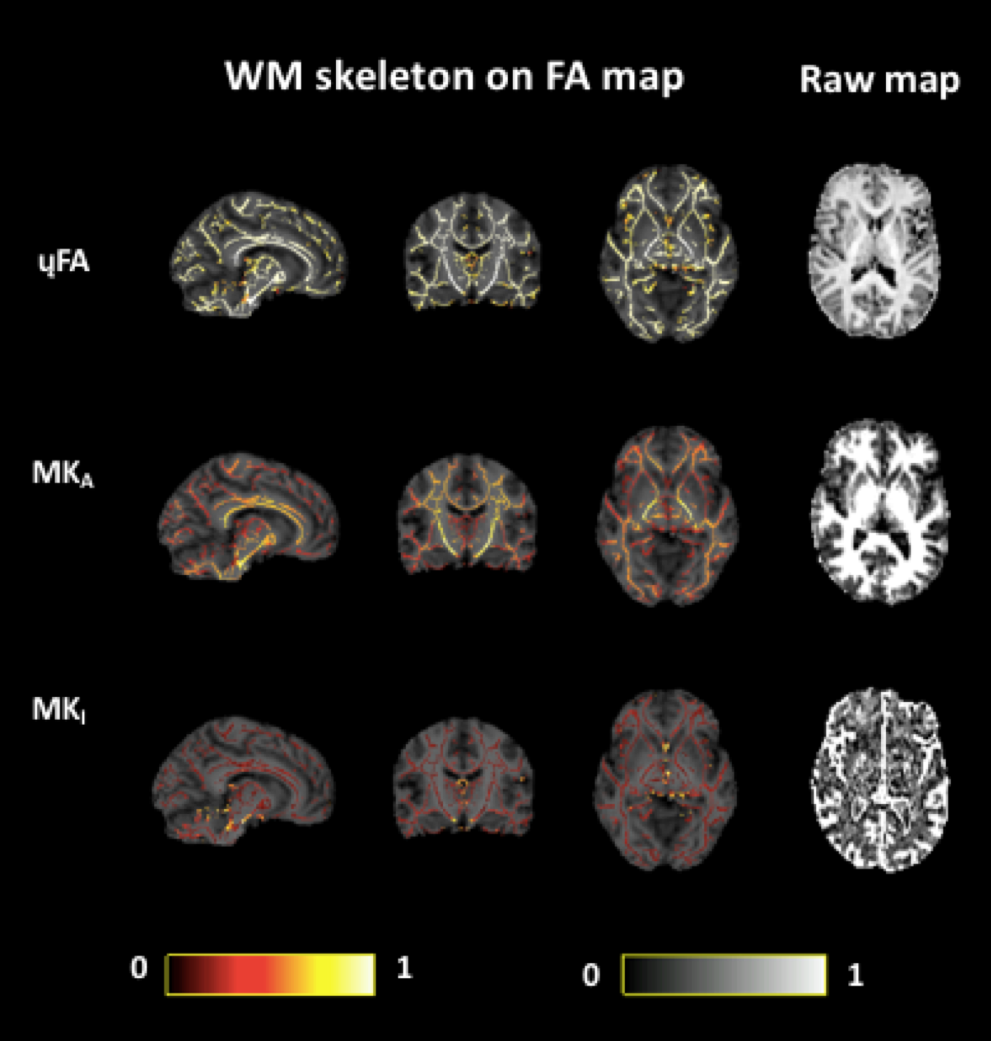
Analysis. Repeatability of all measures across whole brain white matter was ascertained at the voxel level by adopting the TBSS8 white matter skeletonisation approach . For each time point, each subject's FA map (previously acquired9) was projected onto the FA skeleton in MNI space. The nonlinear warps and skeleton projections were then applied to the corresponding non-FA maps (μFA, MKa and MKi). Prior to further analysis, each voxel in the skeletonised data was only retained for further analysis if, in that voxel, all 5 participants at all six time-points had an FA > 0.2. This provided enhanced assurance that the analysis was restricted to white matter. For each metric, the Pearson correlation was then computed across all voxels in the thresholded skeleton between each possible pair of time-points to assess the repeatability across whole brain white matter. Figure 1 demonstrates μFA, MKi and MKa skeletons registered to a fractional anisotropy (FA) map derived from conventional diffusion encoding9 in one representative participant across 5 sessions.
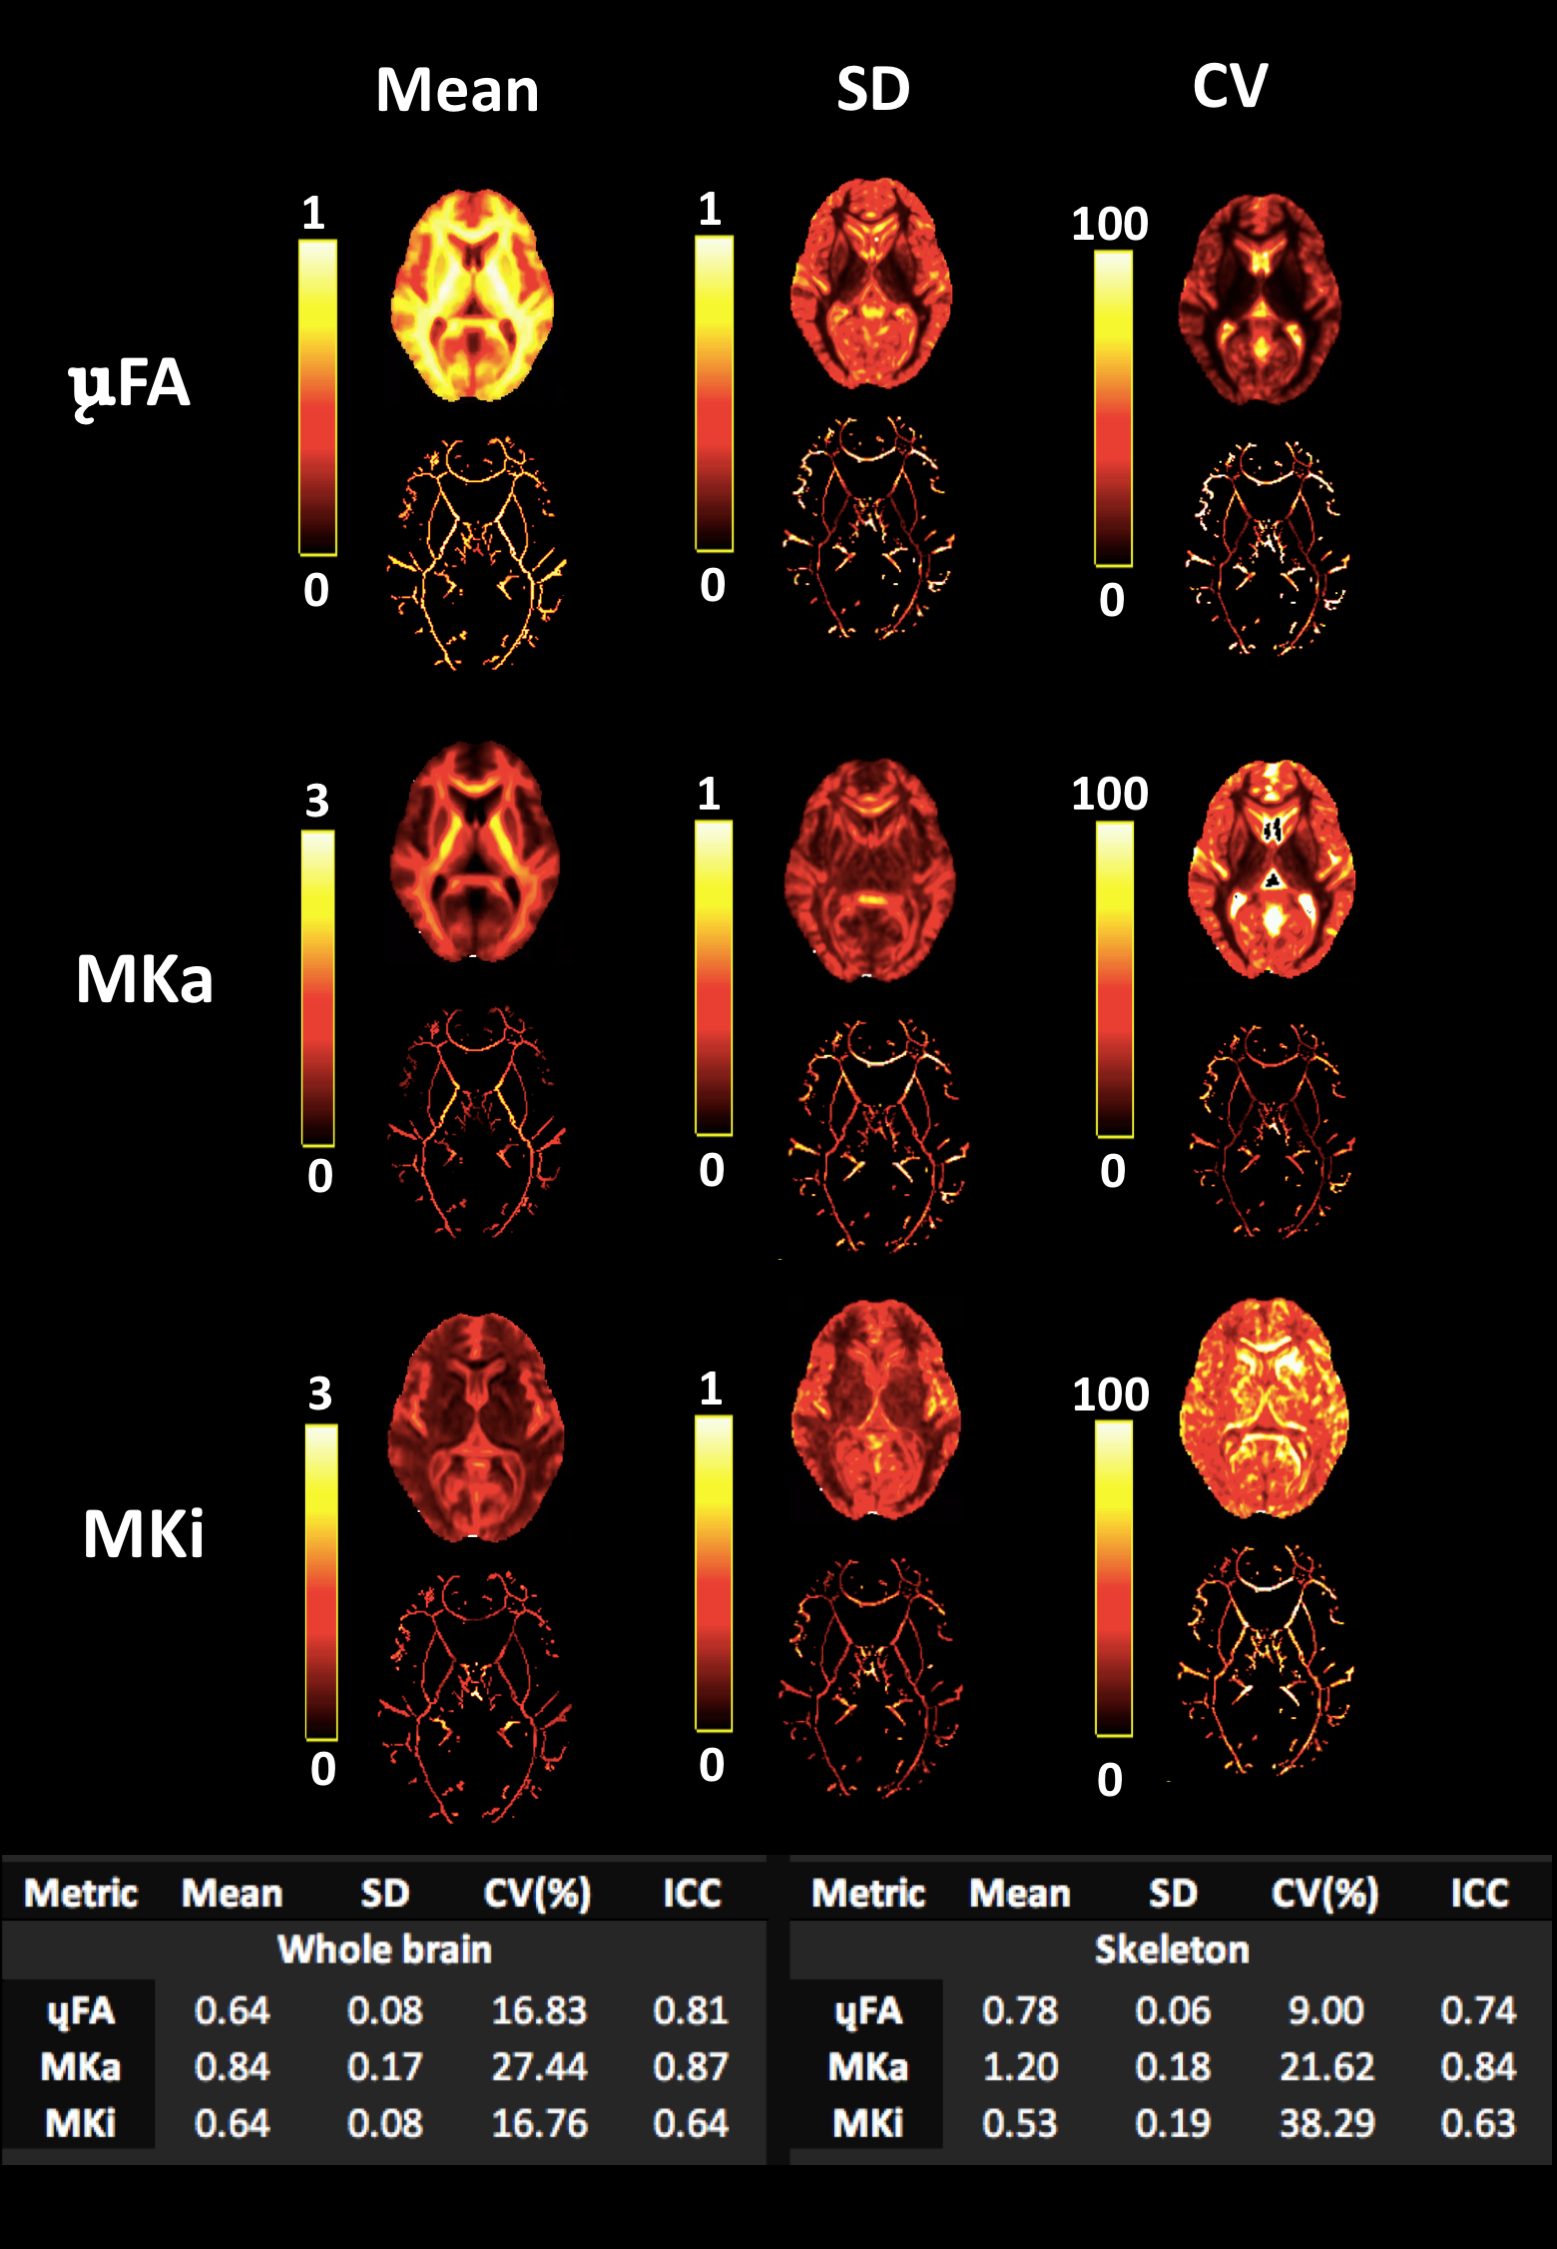
Summary statistical maps including averaged voxel-wise mean, standard deviation (SD), coefficient of variation (COV) and intra-class correlation coefficient (ICC two-way mixed effects, absolute agreement, single measurements10) were computed for each whole brain and skeletonised map.
Results
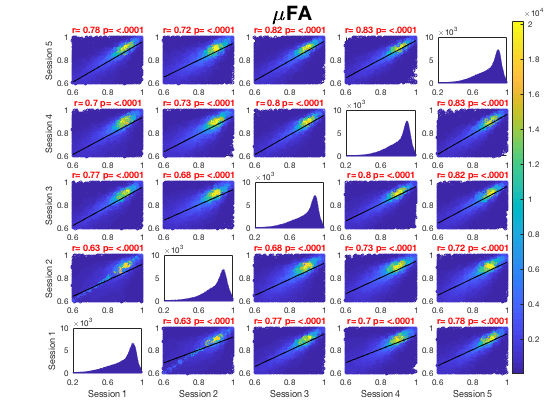
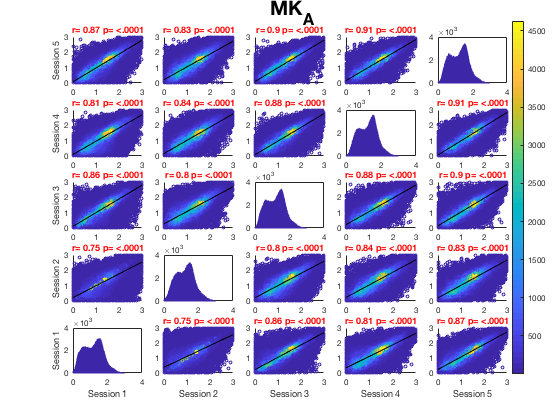
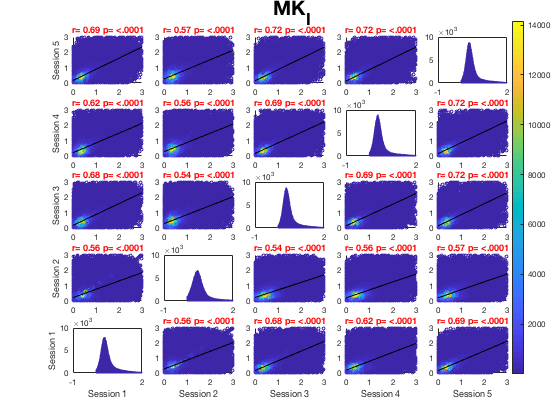
Whole brain voxel-wise Pearson correlation coefficients ranged between .63 and .83 (Fig. 2A) for μFA maps pooled across all participants for each session suggesting high statistical reliability across participants and sessions. While higher correlation coefficients were observed for MKa (Fig. 2B) ranging between .75 and .91, MKi (Fig. 2C) demonstrated lower coefficients ranging between .64 and .73.Figure 3 presents summary voxel-wise averaged maps for each microstructure metric. The average ICC across all voxels for μFA suggested high statistical repeatability (skeleton .74, whole brain .81). While MKa demonstrated even higher repeatability (skeleton .84, whole brain .87), MKi showed the lowest repeatability (skeleton .63, whole brain .64). Coefficient of variation was the lowest for μFA (9%) and the highest for MKi (38.29%). Reasonable variability was demonstrated by a wide range of CV across maps.
Discussion
Voxel-wise whole brain assessment of statistical reliability pooled across all participants and sessions consistently demonstrated test-retest reliability of μFA maps as demonstrated by Pearson correlation coefficients and ICC. MKa demonstrated the highest statistical repeatability, while MKi the lowest, suggesting that isotropic diffusion generated from spherical diffusion encoding likely induced higher variation across voxels compared to MKa. Although other microstructure metrics in the same participants previously demonstrated higher repeatability in some cases (e.g. FA, restricted signal fraction9), our results show that μFA is still highly repeatable.Conclusion
High whole-brain test-retest reliability of microstructure maps including microscopic FA, MKa and MKi derived from free gradient waveforms was demonstrated across 5 repeated sessions in 6 human participants.Acknowledgements
The data were acquired at the UK National Facility for In Vivo MR Imaging of Human Tissue Microstructure funded by the EPSRC (grant EP/M029778/1), and The Wolfson Foundation. DKJ, KK and CMW were supported in part by a Wellcome Trust Investigator Award (096646/Z/11/Z) and DKJ by a Wellcome Trust Strategic Award (104943/Z/14/Z). CMWT was supported by a Sir Henry Wellcome Fellowship (215944/Z/19/Z) and a Veni grant (17331) from the Dutch Research Council (NWO). Finally, we would like to thank each participant for their contribution provided by taking part in this study.
References
1.Szczepankiewicz, F., Sjölund, J., Ståhlberg, F., Lätt, J., & Nilsson, M. (2019). Tensor-valued diffusion encoding for diffusional variance decomposition (DIVIDE): Technical feasibility in clinical MRI systems. PLOS ONE, 14(3), e0214238. https://doi.org/10.1371/journal.pone.0214238
2. Sjölund, J., Szczepankiewicz, F., Nilsson, M., Topgaard, D., Westin, C. F., & Knutsson, H. (2015). Constrained optimization of gradient waveforms for generalized diffusion encoding. Journal of Magnetic Resonance, 261, 157–168. https://doi.org/10.1016/j.jmr.2015.10.012
3.Caruyer, E., Lenglet, C., Sapiro, G., & Deriche, R. (2013). Design of multishell sampling schemes with uniform coverage in diffusion MRI. Magnetic Resonance in Medicine : Official Journal of the Society of Magnetic Resonance in Medicine / Society of Magnetic Resonance in Medicine, 69(6), 1534–1540. https://doi.org/10.1002/mrm.24736
4.Vos, S. B., Tax, C. M. W., Luijten, P. R., Ourselin, S., Leemans, A., & Froeling, M. (2017). The importance of correcting for signal drift in diffusion MRI. Magnetic Resonance in Medicine, 77(1), 285–299. https://doi.org/10.1002/mrm.26124
5. Nilsson, M., Szczepankiewicz, F., van Westen, D., & Hansson, O. (2015). Extrapolation-Based References Improve Motion and Eddy-Current Correction of High B-Value DWI Data: Application in Parkinson’s Disease Dementia. PLOS ONE, 10(11), e0141825. https://doi.org/10.1371/journal.pone.0141825
6. Andersson, J. L. R., Skare, S., & Ashburner, J. (2003). How to correct susceptibility distortions in spin-echo echo-planar images: application to diffusion tensor imaging. NeuroImage, 20(2), 870–888. https://doi.org/10.1016/S1053-8119(03)00336-7
7. Kellner, E., Dhital, B., Kiselev, V. G., & Reisert, M. (2016). Gibbs-ringing artifact removal based on local subvoxel-shifts. Magnetic Resonance in Medicine, 76(5), 1574–1581. https://doi.org/10.1002/mrm.26054
8. Smith, S. M., Jenkinson, M., Johansen-Berg, H., Rueckert, D., Nichols, T. E., Mackay, C. E., … Behrens, T. E. J. (2006). Tract-based spatial statistics: Voxelwise analysis of multi-subject diffusion data. NeuroImage, 31(4), 1487–1505. https://doi.org/10.1016/j.neuroimage.2006.02.024
9. Koller, K., Rudrapatna, S. U., Chamberland, M., Raven, E. P., Parker, G. D., Tax, C. M. W., … Jones, D. K. (2020). MICRA: Microstructural Image Compilation with Repeated Acquisitions. NeuroImage, 117406. https://doi.org/10.1016/j.neuroimage.2020.117406
10. McGraw, K. O., & Wong, S. P. (1996). Forming Inferences about Some Intraclass Correlation Coefficients. Psychological Methods, 1(1), 30–46. https://doi.org/10.1037/1082-989X.1.1.30
Figures