2456
High-resolution microstructural imaging in the human hippocampus with b-tensor encoding and zoomed imaging1UCL Great Ormond Street Institute of Child Health, London, United Kingdom, 2Siemens Healthcare Ltd, Frimley, United Kingdom
Synopsis
In this work, our protocol leverages the most recent advances in the b-tensor diffusion encoding, and also uses a zoomed imaging technique, to specifically scan the hippocampus. Our sequence is able to acquire high-resolution images which enable direct delineation of hippocampal structures and allows estimation of advanced diffusion metrics, as well as parameters that can be measured from a standard multi-shell diffusion data set. Therefore, our acquisition can be used as an all-in-one sequence for microstructural imaging of the hippocampus. We also defined a subsampled acquisition protocol that is feasible for a clinical setting.
Introduction
The human hippocampus is a key target in many neuroimaging studies. Previous studies using diffusion tensor imaging (DTI) in the hippocampus have reported microstructural abnormalities associated with various disorders using mean diffusivity (MD) and fractional anisotropy (FA)[1–4]. However, FA conflates microscopic anisotropy and orientation dispersion, making its interpretation ambiguous[5,6]. Also, these studies have used whole-brain acquisitions with a low spatial resolution and have extracted the hippocampus through registration with anatomical images.In this work, we combine two novel techniques to image the hippocampus. First, we use b-tensor diffusion encoding which separates the effects of microscopic diffusion anisotropy (μFA), orientation dispersion, and isotropic size variance (CMD), providing more detailed information about the hippocampus microstructure[6,7]. Second, we use a selective field-of-view (FOV), zoomed imaging technique. This uses two-channel parallel transmission (pTx) that results in a focused excitation only in the selected volume of interest[8,9]. This becomes especially useful in hippocampus imaging, where the hippocampus is a small but complex structure further divided into distinct subregions. Therefore, we applied an optimised protocol for b-tensor encoding with selective FOV, designed explicitly for high-resolution microstructural imaging in the human hippocampus.
Methods
ImagingA healthy adult was scanned on a 3T Siemens Prisma system with 80mT/m gradients and a 20-channel head coil. A T1-MPRAGE acquisition was first performed, followed by an in-plane high-resolution ZOOMit b-tensor encoding diffusion sequence to image the hippocampus specifically.
T1-MPRAGE was acquired to plan twenty 3 mm coronal-oblique slices for the diffusion-weighted scan which lie parallel to the long axis of the hippocampus in the sagittal plane[10].
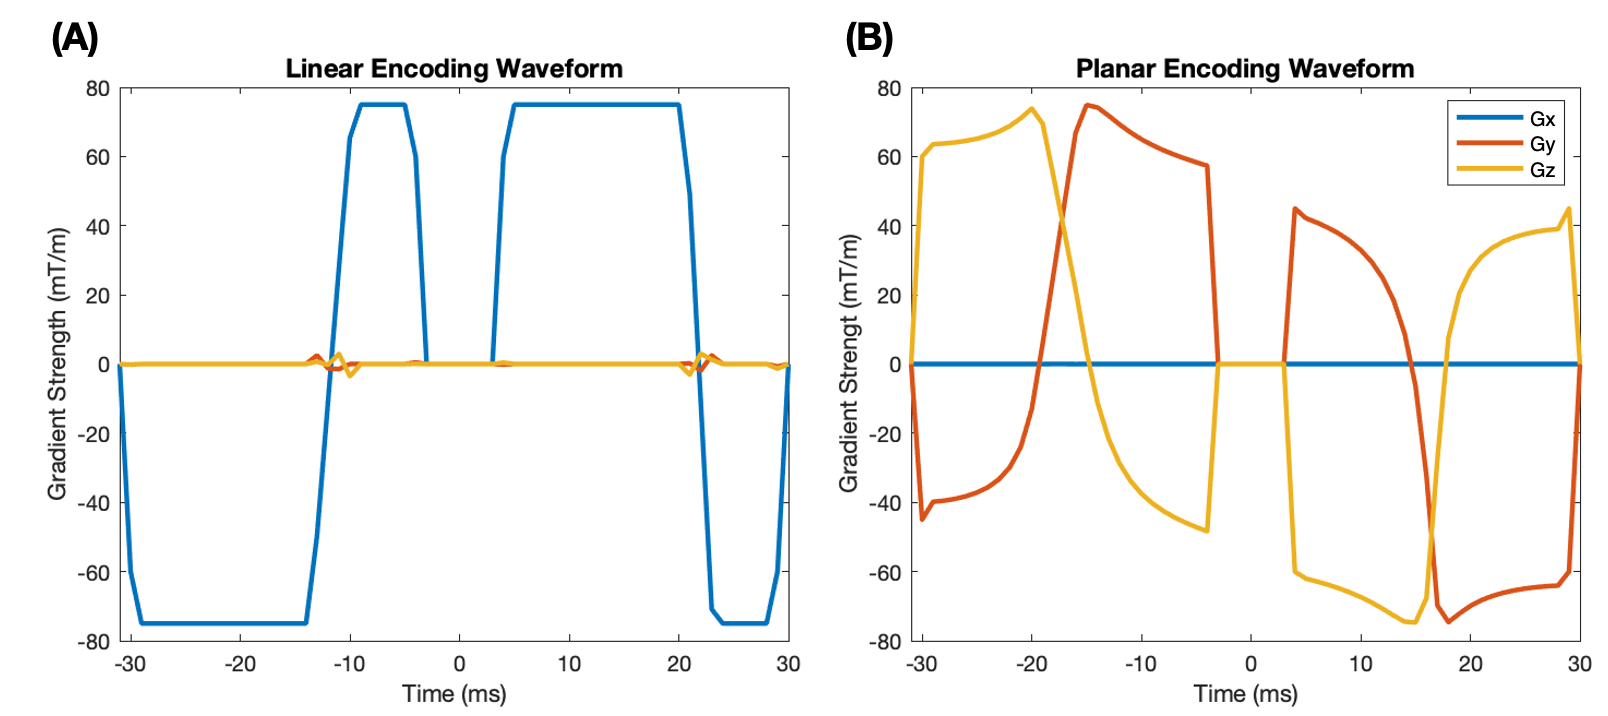
ZOOMit b-tensor encoding consisted of a bespoke in-house developed diffusion-weighted EPI sequence with arbitrary gradient waveforms that were optimised[11], Maxwell-compensated[12] and eddy current supressed[13] (Figure 1). Linear tensor encoding (LTE) and planar tensor encoding (PTE) waveforms were interleaved with b-values / directions = [200,750,1000,1250,1500,1750,2000 s/mm2] / [12,12,12,12,32,32,32] and 4 averages were acquired (each acquisition time was 15:24min). The following imaging parameters were used; TR=3s, TE=93ms, resolution=1x1x3mm3, FOV=160x48mm2, partial-Fourier=6/8. The overall scan time was 1 hour and 8 minutes.
Analysis
Data was denoised using Patch2Self[14] and Gibbs ringing was reduced using a sub-voxel shift algorithm[15]. Even though eddy distortions were minimal, eddy in FSL[16] was used to correct for subject motion.
MD and FA were extracted from data acquired with linear b-tensors using a combined diffusion tensor and diffusion kurtosis tensor fit from DIPY[17]. Q-space trajectory imaging (QTI)[7] was used to estimate μFA and CMD.
The hippocampus and its subregions were manually segmented in the average LTE image at b=1000 s/mm2.
Results
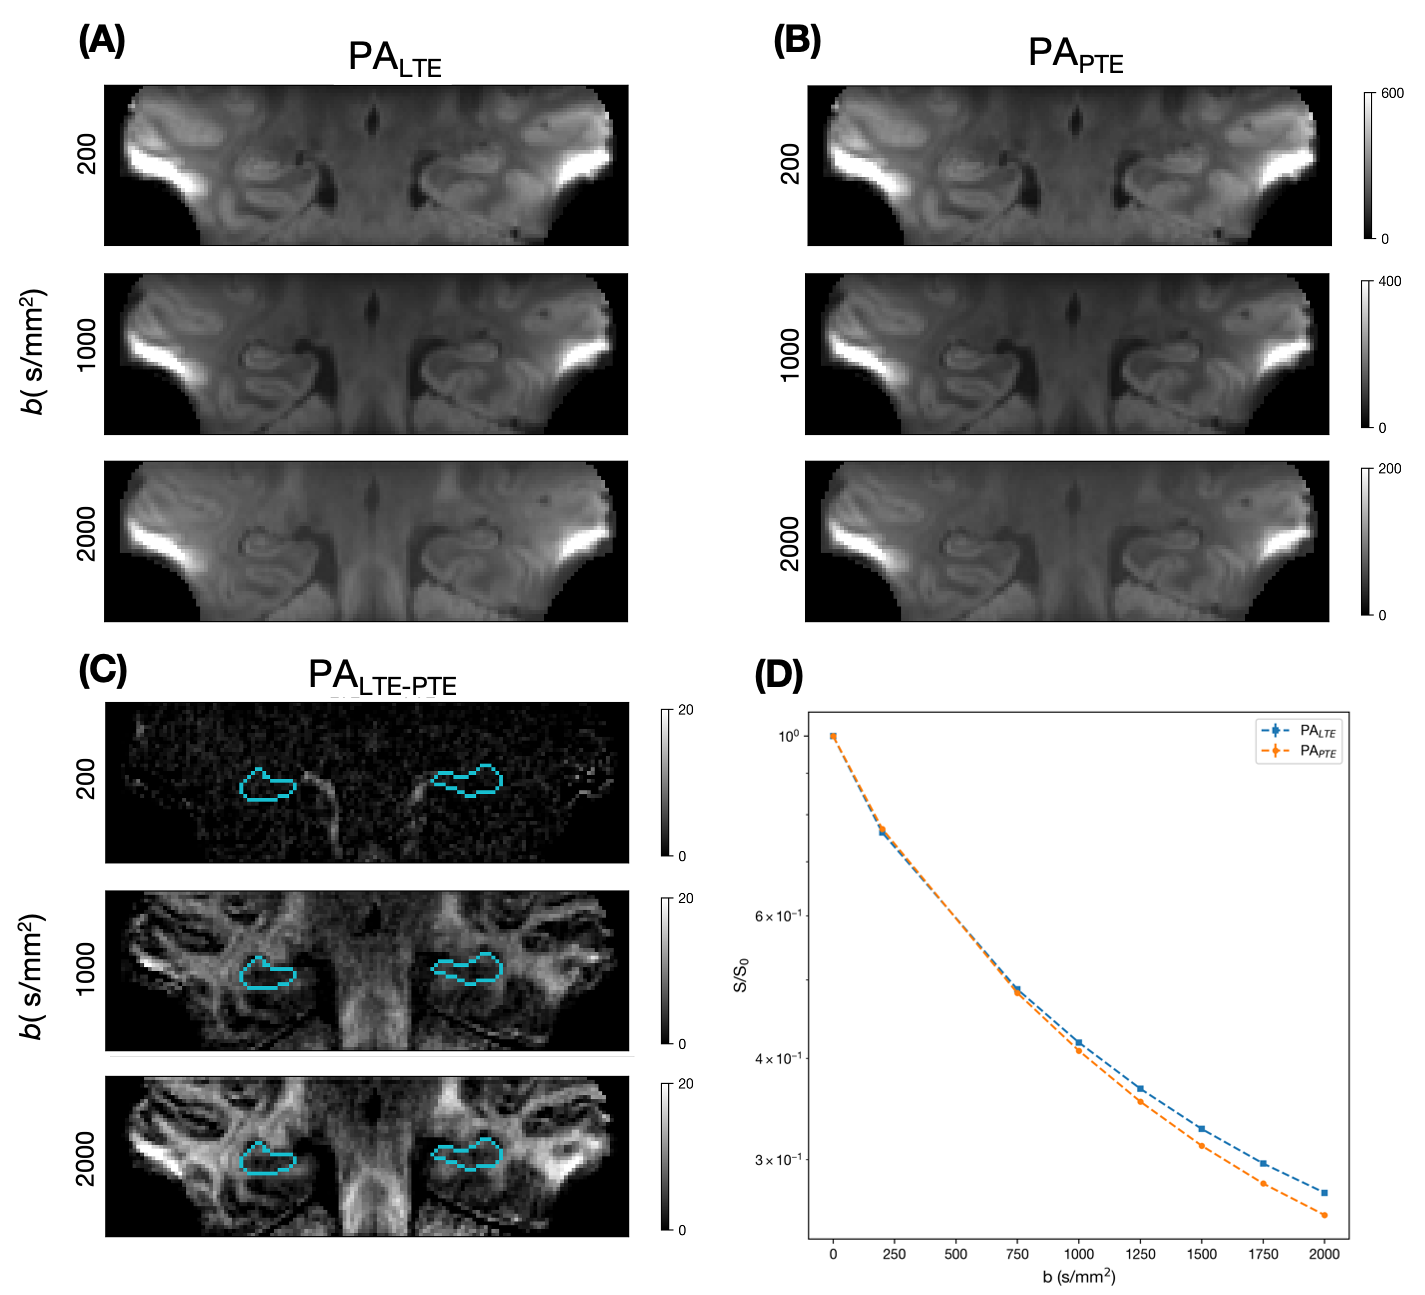
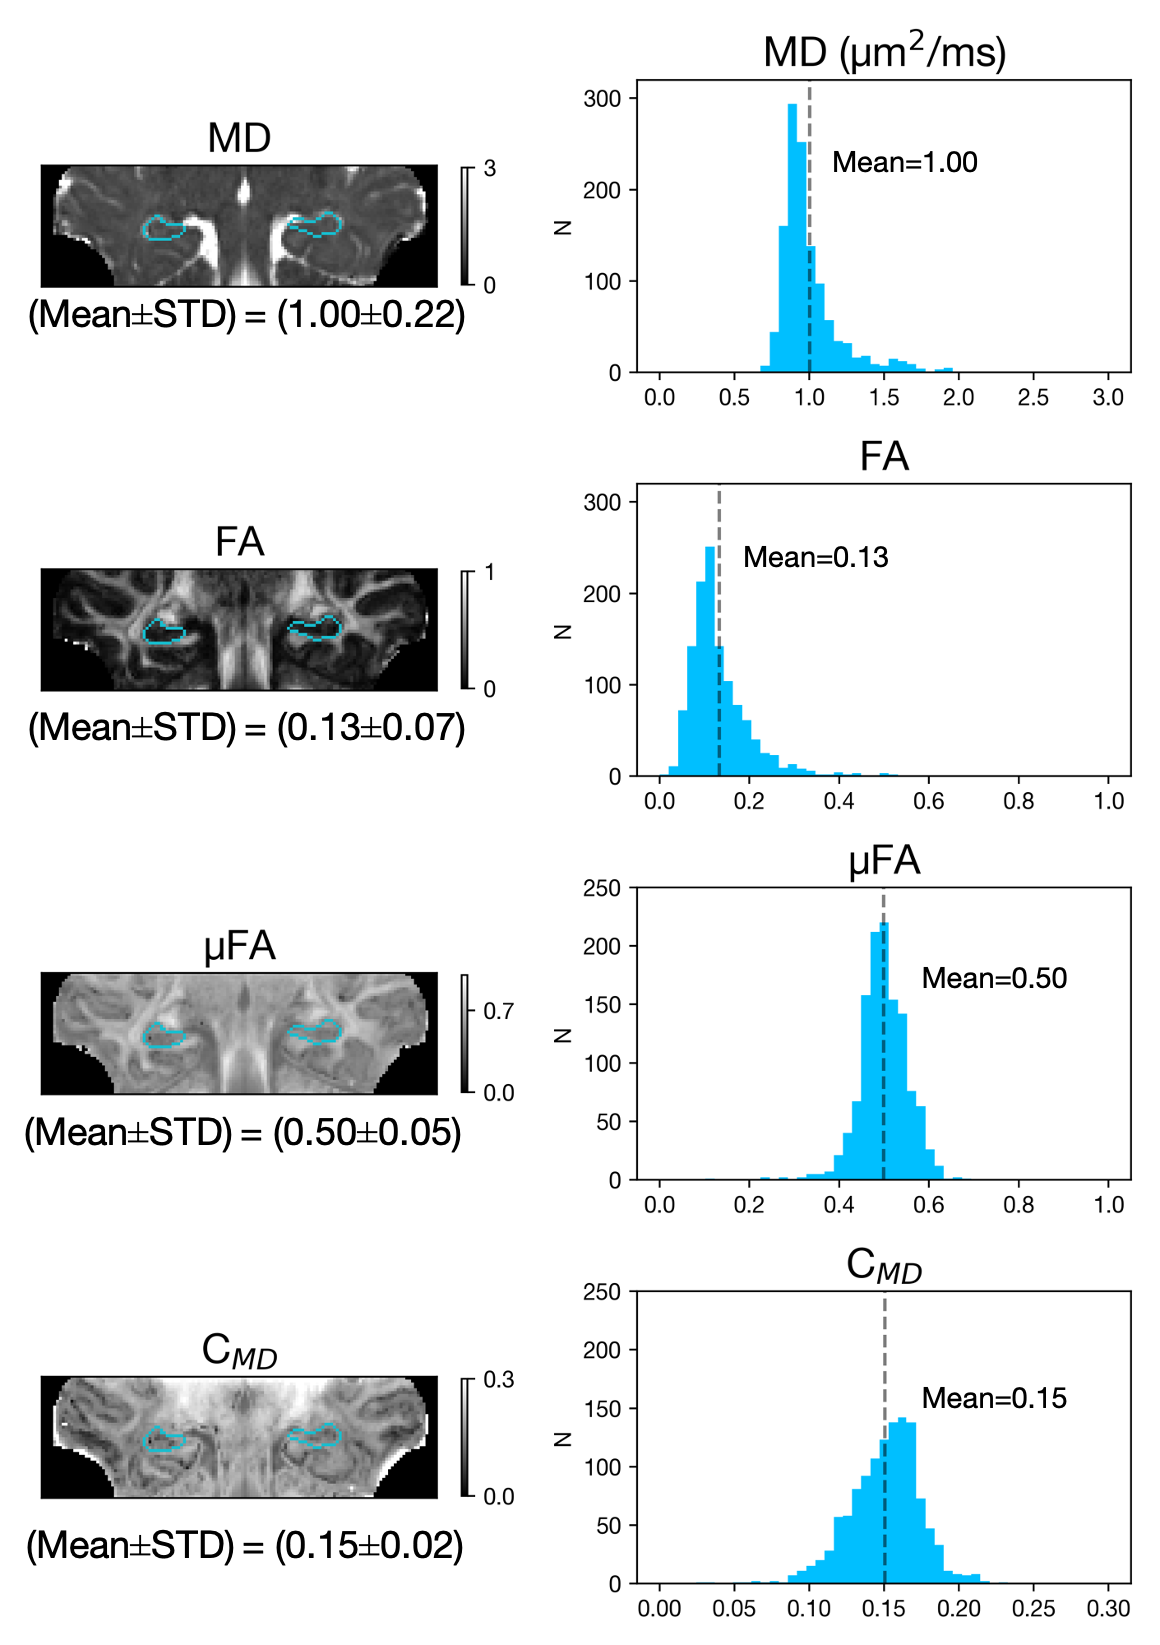
Powder-averaged data (mean of all diffusion-weighted images for a given shell) for linear and planar b-tensor shapes and their difference for selected b-values are shown (Figure 2). Figure 2D illustrates the normalised LTE and PTE in the hippocampus signal across b-values, where the divergence between the signal decay curves depends on μFA.Figure 3 shows the microstructural maps and histogram of microstructural parameters. The magnitude of μFA (0.50±0.05) was shown to be much larger than conventional FA (0.13±0.07), indicating a significant degree of orientation dispersion in the microscopic diffusion environments of the hippocampus.
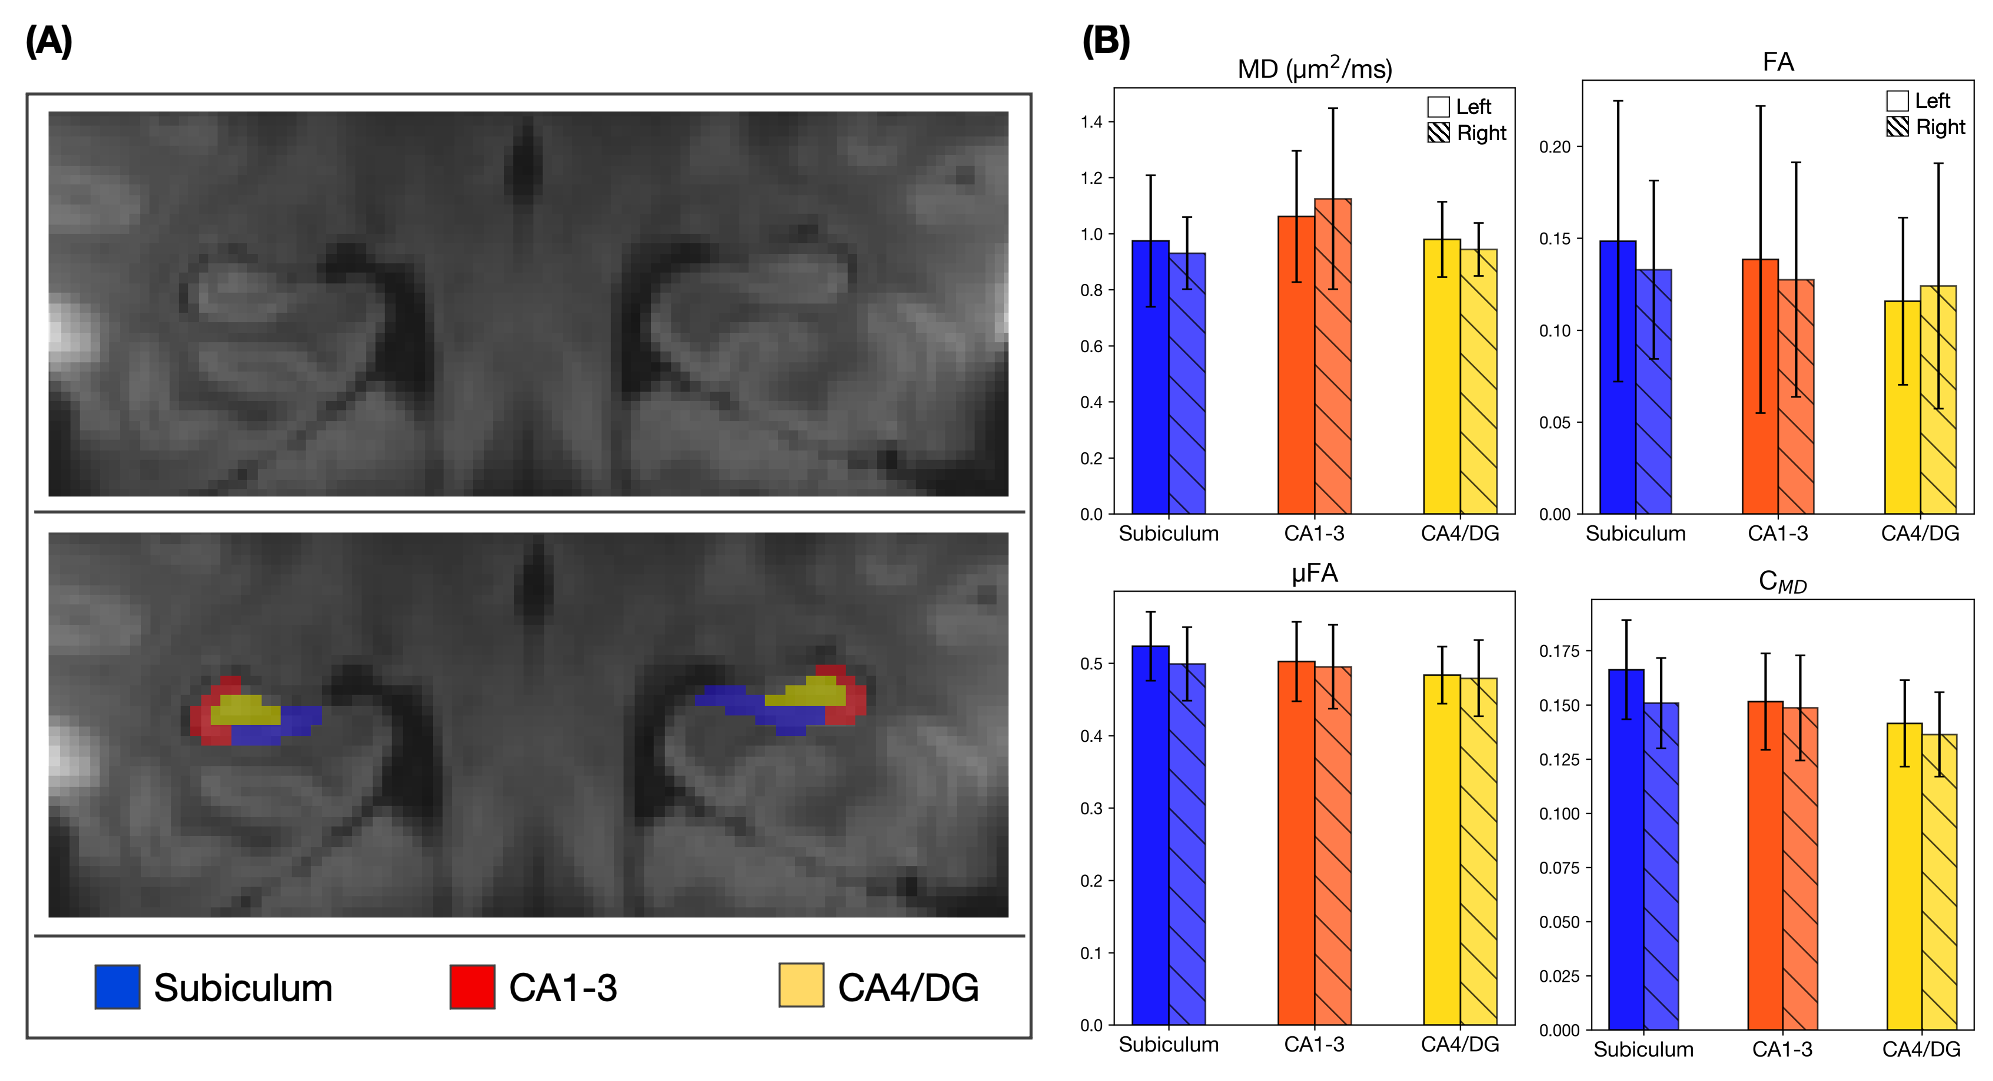
The average LTE image at b=1000 s/mm2 showed excellent detail of the hippocampal architecture where subregions, subiculum, Cornu Ammonis (CA) regions CA1-3 and CA4/dentate gyrus (DG) were manually segmented (Figure 4A). Microstructural information calculated in these subregions showed relatively homogenous diffusion parameters across left and right, and across subregions of the hippocampus (Figure 4B).
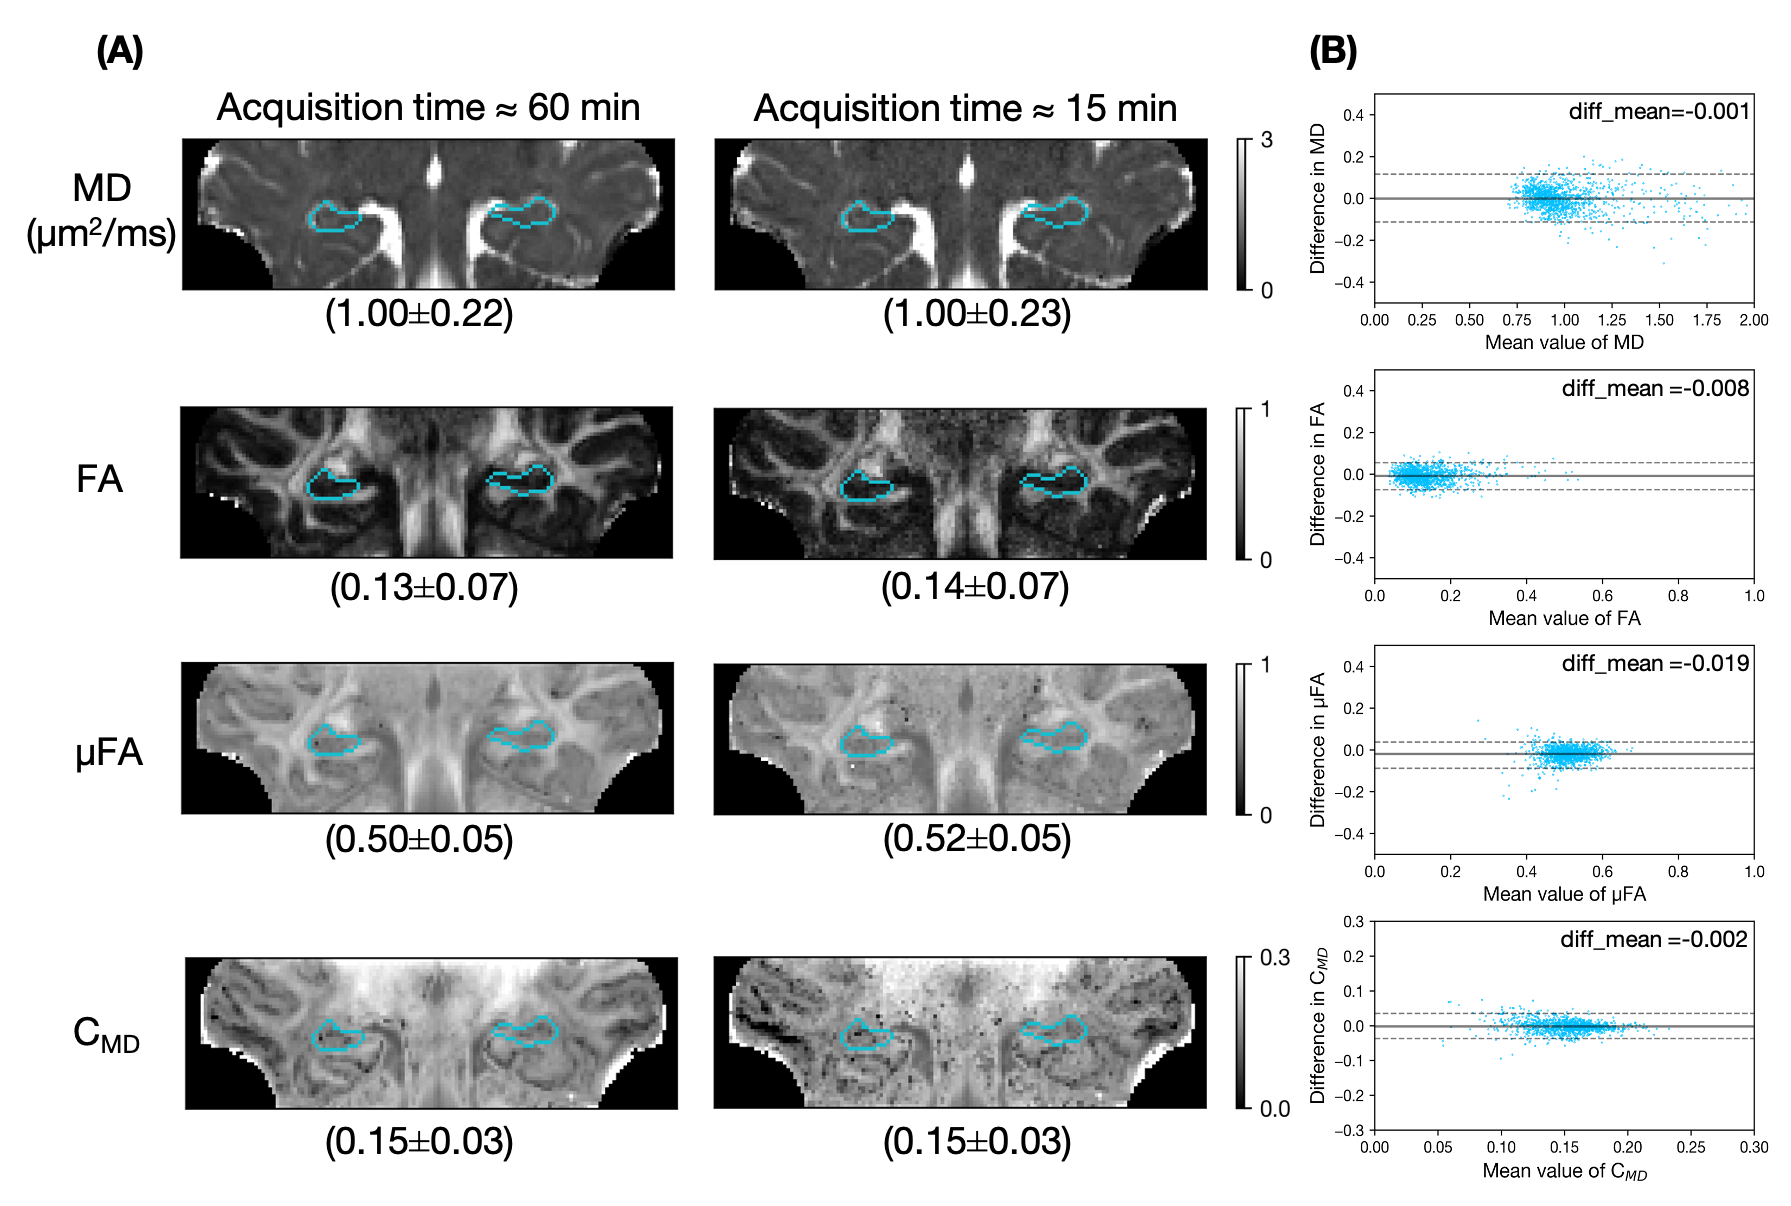
In Figure 5, the maps from a full dataset of 4 averages (~60 minutes) were compared with maps from just one average (~15 minutes). The denoised subsampled data yielded similar microstructural maps to the full acquisition, and the small mean difference and low variance demonstrated that these methods show promise for clinically feasible acquisition times.
Discussion
Our reduced FOV b-tensor encoding imaging protocol is able to provide advanced diffusion metrics such as μFA and high-quality images allowing visualisation of the hippocampal substructure. Locating a specific FOV allowed significant savings in scan time and the acquisition of higher-resolution images than would have been possible with whole-brain coverage. In the healthy hippocampus, diffusion parameters were shown to be consistent across its substructures. However, previous studies have demonstrated the clinical value of these parameters associated with various disorders[18,19]. We have defined a reduced protocol for clinical applications, and our proposed protocol may be used as an all-in-one microstructural imaging protocol to facilitate a localised detection of hippocampal pathology, as well as measuring more detailed characterisation of tissue microstructure. Future research will focus on scanning more healthy volunteers as baseline data, optimisation of image processing, particularly with regard to motion artefacts before acquiring patient data.Conclusion
We have developed a microstructural imaging protocol explicitly designed for the hippocampus. This method provides high-resolution (1 mm in-plane) images to measure advanced diffusion metrics in different hippocampal subregions.Acknowledgements
This study was funded by BBSRC with the London Interdisciplinary Doctoral Training Programme and NIHR GOSH BRC. Special thanks to Tina Banks at GOSH for her help with the scans.References
[1] M. R. Nazem-Zadeh et al., “Lateralization of temporal lobe epilepsy using a novel uncertainty analysis of MR diffusion in hippocampus, cingulum, and fornix, and hippocampal volume and FLAIR intensity,” J. Neurol. Sci., vol. 342, no. 1–2, pp. 152–161, 2014, doi: 10.1016/j.jns.2014.05.019.
[2] A. Nazeri et al., “Gray Matter Neuritic Microstructure Deficits in Schizophrenia and Bipolar Disorder,” Biol. Psychiatry, vol. 82, no. 10, pp. 726–736, 2017, doi: 10.1016/j.biopsych.2016.12.005.
[3] M. W. W. Y. Zhang, N. Schuff, G. -H. Jahng, W. Bayne, S. Mori, L. Schad, S. Mueller, A. -T. Du, J. H. Kramer, K. Yaffe, H. Chui, W. J. Jagust, B. L. Miller, “Diffusion tensor imaging of cingulum fibers in mild cognitive impairment and Alzheimer disease,” Neurology, vol. 68, 2007, doi: https://doi.org/10.1212/01.wnl.0000250326.77323.01.
[4] R. Cappellani et al., “Subcortical deep gray matter pathology in patients with multiple sclerosis is associated with white matter lesion burden and atrophy but not with cortical atrophy: A diffusion tensor MRI study,” Am. J. Neuroradiol., vol. 39, no. 5, pp. 912–919, 2014, doi: 10.3174/ajnr.A3788.
[5] F. Szczepankiewicz, S. Eriksson, M. Nilsson, D. Topgaard, and S. Lasi, “Microanisotropy imaging : quantification of microscopic diffusion anisotropy and orientational order parameter by diffusion MRI with magic-angle spinning of the q-vector,” vol. 2, no. February, pp. 1–14, 2014, doi: 10.3389/fphy.2014.00011.
[6] F. Szczepankiewicz et al., “Quantification of microscopic diffusion anisotropy disentangles effects of orientation dispersion from microstructure: Applications in healthy volunteers and in brain tumors,” Neuroimage, 2015, doi: 10.1016/j.neuroimage.2014.09.057.
[7] C. Westin et al., “NeuroImage Q-space trajectory imaging for multidimensional diffusion MRI of the human brain,” Neuroimage, vol. 135, pp. 345–362, 2016, doi: 10.1016/j.neuroimage.2016.02.039.
[8] P. Riffel et al., “Zoomed EPI-DWI of the pancreas using two-dimensional spatially-selective radiofrequency excitation pulses,” PLoS One, vol. 9, no. 3, pp. 1–5, 2014, doi: 10.1371/journal.pone.0089468.
[9] M. Blasche, P. Riffel, and M. Lichy, “TimTX TrueShape and syngo ZOOMit Technical and Practical Aspects Background – from parallel receive to parallel transmit,” MAGNETOM Flash, pp. 74–84, 2012.
[10] S. Treit, T. Steve, D. W. Gross, and C. Beaulieu, “High resolution in-vivo diffusion imaging of the human hippocampus,” Neuroimage, no. August 2017, pp. 1–9, 2018, doi: 10.1016/j.neuroimage.2018.01.034.
[11] J. Sjölund, F. Szczepankiewicz, M. Nilsson, D. Topgaard, C.-F. Westin, and H. Knutsson, “Constrained optimization of gradient waveforms for generalized diffusion encoding,” J. Magn. Reson., vol. 261, p. 157—168, Dec. 2015, doi: 10.1016/j.jmr.2015.10.012.
[12] F. Szczepankiewicz, C. F. Westin, and M. Nilsson, “Maxwell-compensated design of asymmetric gradient waveforms for tensor-valued diffusion encoding,” Magn. Reson. Med., vol. 82, no. 4, pp. 1424–1437, 2019, doi: 10.1002/mrm.27828.
[13] G. Yang and J. A. McNab, “Eddy current nulled constrained optimization of isotropic diffusion encoding gradient waveforms,” Magn. Reson. Med., vol. 81, no. 3, pp. 1818–1832, 2019, doi: 10.1002/mrm.27539.
[14] S. Learning, S. Fadnavis, J. Batson, and E. Garyfallidis, “Patch2Self : Denoising Diffusion MRI with,” no. NeurIPS, pp. 1–11, 2020.
[15] E. Kellner, B. Dhital, V. G. Kiselev, and M. Reisert, “Gibbs-ringing artifact removal based on local subvoxel-shifts,” Magn. Reson. Med., vol. 76, no. 5, pp. 1574–1581, 2016, doi: 10.1002/mrm.26054.
[16] S. M. Smith et al., “Advances in functional and structural MR image analysis and implementation as FSL,” in NeuroImage, 2004, doi: 10.1016/j.neuroimage.2004.07.051.
[17] E. Garyfallidis et al., “Dipy, a library for the analysis of diffusion MRI data,” Front. Neuroinform., vol. 8, p. 8, 2014, doi: 10.3389/fninf.2014.00008.
[18] C. A. Elliott, D. W. Gross, B. M. Wheatley, C. Beaulieu, and T. Sankar, “Longitudinal hippocampal and extra-hippocampal microstructural and macrostructural changes following temporal lobe epilepsy surgery,” Epilepsy Res., vol. 140, no. December 2017, pp. 128–137, 2018, doi: 10.1016/j.eplepsyres.2018.01.008.
[19] B. C. Bernhardt et al., “The spectrum of structural and functional imaging abnormalities in temporal lobe epilepsy,” Ann. Neurol., vol. 80, no. 1, pp. 142–153, 2016, doi: 10.1002/ana.24691.
Figures