2451
Multi-band in Diffusion MRI: Can we go too fast?1Physics and Astronomy, University of Rochester, Rochester, NY, United States, 2Biostatistics and Bioinformatics, Emory University, Atlanta, GA, United States, 3Radiology and Imaging Sciences, Emory University School of Medicine, Atlanta, GA, United States, 4Biomedical Engineering, Emory University, Atlanta, GA, United States, 5Imaging Sciences, University of Rochester Medical Center, Rochester, NY, United States, 6Biostatistics and Computational Biology, University of Rochester Medical Center, Rochester, NY, United States
Synopsis
In this study, we sought to better understand the effect of multiband and phase acceleration on diffusion image reconstruction. As part of an on-going study on SMS in dMRI, 10 test-retest scans from 5 young, healthy subjects were scanned. We found that g-factor, reflecting noise amplification, increased with higher acceleration factors, the g-factor was also higher in frontal regions compared to occipital regions. We also found that the DTI fitting performed worse where we saw increased g-factor. Finally, we found that streamlines were stable as a function of acceleration in the occipital areas, but not frontal areas.
Background
Diffusion MRI (dMRI) is an advanced MRI modality that is used to probe white matter (WM) integrity of the brain. Simultaneous multi-slice (SMS), also called multiband, allows for acceleration of dMRI scans to acquire high-resolution scans in a fraction of the time of the corresponding non-accelerated scan [1, 2]. It is known that SMS alters the underlying noise profile of acquired data. This is commonly reported via a g-factor measurement, describing how much SNR is decreased compared to a non-accelerated scan [3]. Despite increases in g-factor (e.g. higher noise levels) in accelerated scans, previous research suggests increased test-retest reliability of diffusion tensor metrics and tractography data using SMS [4, 5]. Despite previous research, more study on advanced reconstruction algorithms (e.g. constrained spherical deconvolution; CSD [6]) are needed, as many of the previous studies focus on the diffusion tensor (DT) reconstruction. In this study, we seek to understand how the g-factor is influenced by SMS as well as the impact of this noise amplification on dMRI metrics and tractography.Methods
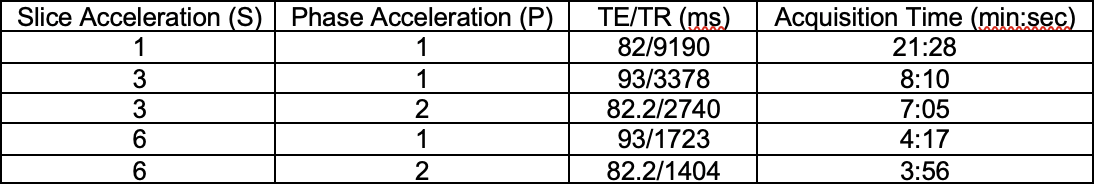
As part of an on-going study on SMS in dMRI, 10 test-retest scans from 5 young, healthy subjects (average age 26.5 yrs, 50% female) with no history of neurologic illness were scanned.MRI protocol included T1-MPRAGE anatomical image (TE/TR = 2.34/2530 ms, TI = 1100 ms, 1x1x1 mm3 resolution, 192 slices/slab) and dMRI consisting of various SMS and in-plane (phase, also called GRAPPA) acceleration factors (Table 1). All dMRI sequences consisted of 142 identical diffusion weighting directions (b-values: 14 interspersed b=0, 26 b=1000, 102 b=2000). We will refer to acceleration factors using S(n)P(m) notation, where n refers to SMS factor, and m to GRAPPA factor (e.g., S1P1 = no acceleration, and S3P2 = SMS factor of 3 and GRAPPA factor of 2). TE were matched for S3P1 and S6P1, S3P2 and S6P2. All dMRI data had a corresponding b0 image acquired with reverse phase-encoding map for distortion correction.
FSL topup [7] was used for susceptibility distortion correction of dMRI data. FSL eddy [8] was used to further preprocess all dMRI data to correct for motion and eddy currents. For SMS data, the slice order was further used to correct for motion, as motion affects multiple slices. In addition, outliers were replaced using a Gaussian Process algorithm [9]. Signal to noise ratio (SNR) was calculated using FSL eddy from the b=0 data and used to calculate the g-factor [10]:
$$g_{SnPm} = \frac{SNR_{S1P1}}{SNR_{SnPm} x \sqrt{m}}$$
Here, the factor of $$$\sqrt{m}$$$ is included as phase acceleration reduces the number of k-space lines acquired [11].
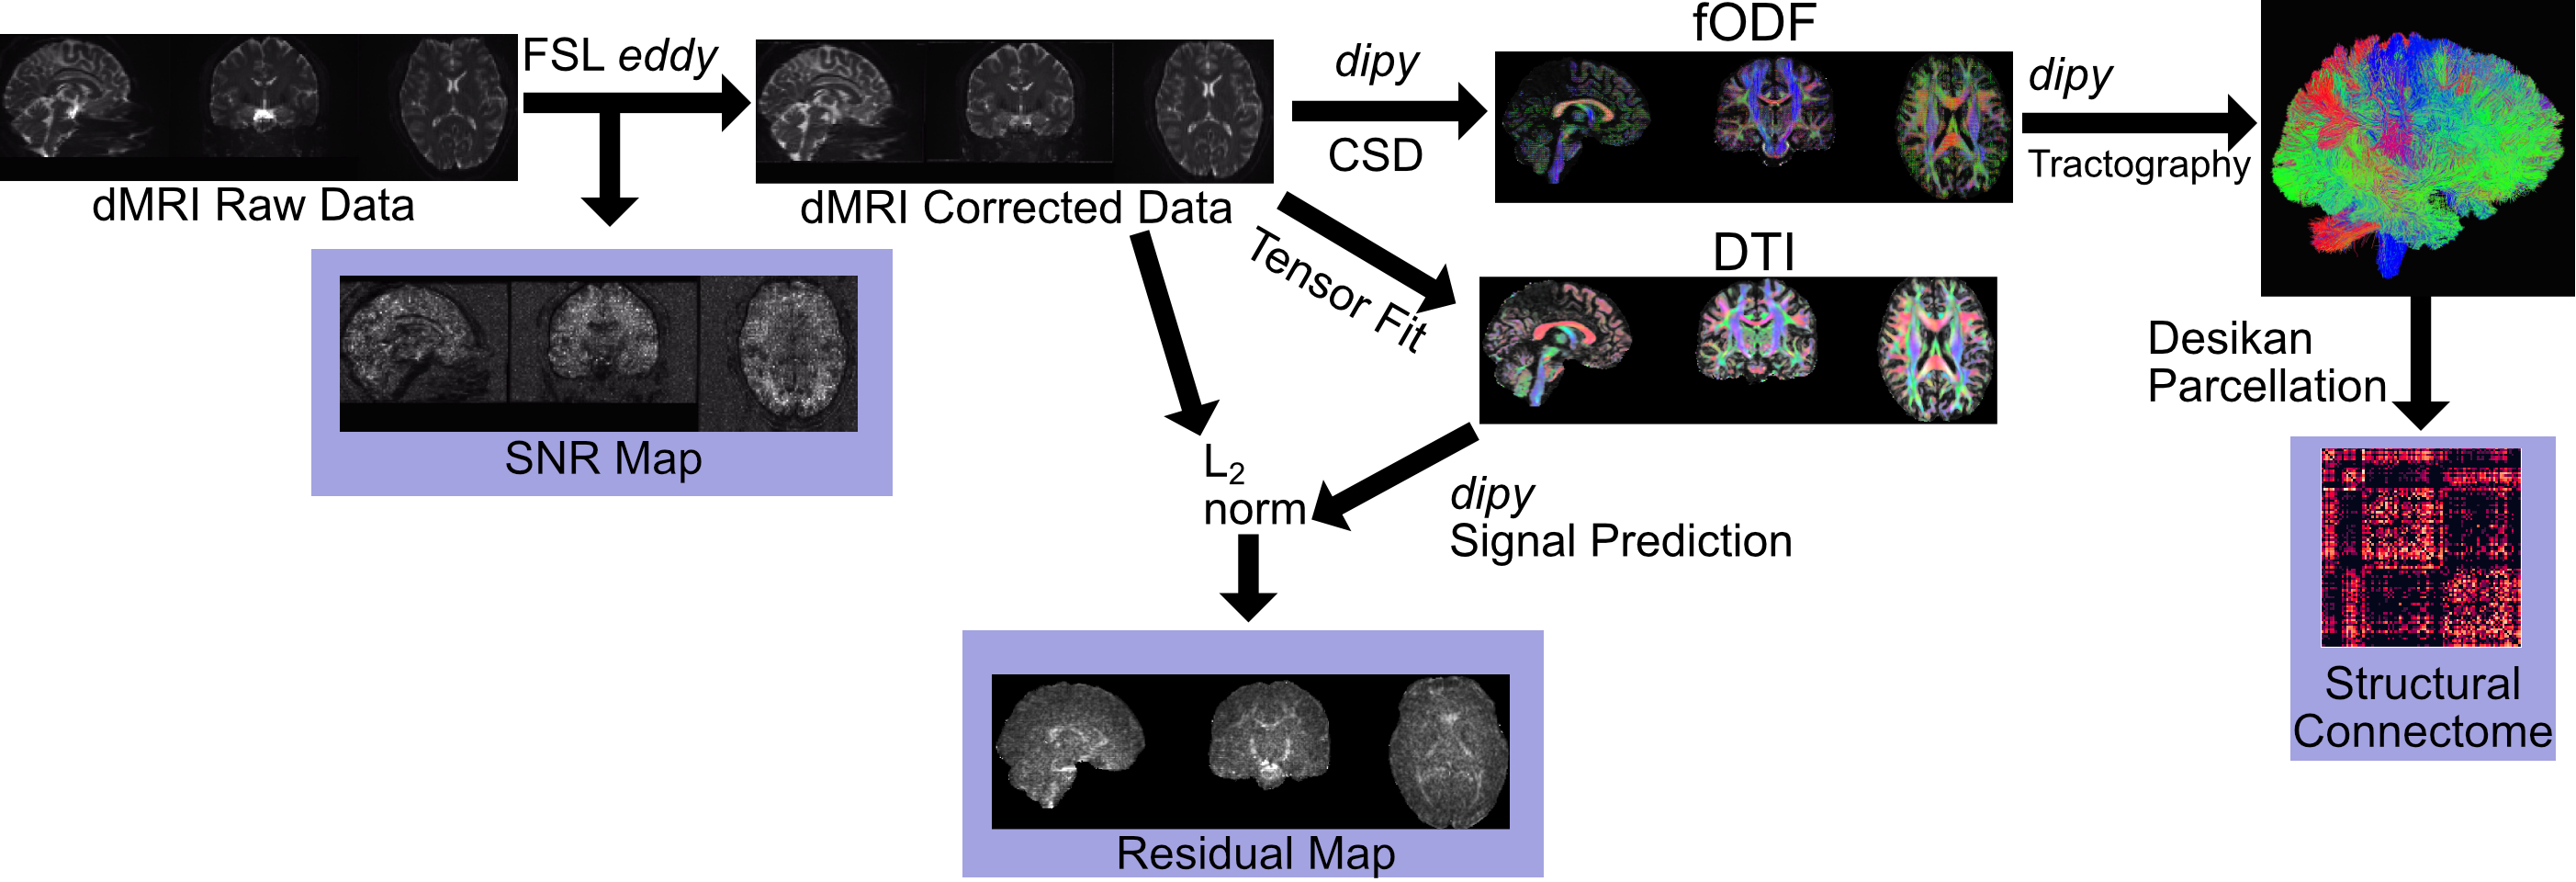
The diffusion tensor and fODF were reconstructed using the tensor model and CSD, respectively, which are implemented in dipy [12]. This was used to calculate the residual of fitting by estimating the diffusion signal from each quantity and calculating the L2 norm between the estimated and real signals. The g-factor and residuals were calculated in the frontal and occipital lobes by registering the Talairach atlas [13] to the T1 space that the dMRI were also registered to; all registration was done using ANTs (http://stnava.github.io/ANTs/). These two regions were chosen in order to understand how spatial positioning affects all measures. In addition, tractography was derived using dipy’s particle filter algorithm [14] and structural connectivity was calculated using the Desikan parcellation [15] implemented in FreeSurfer [16]. The processing pipeline is shown in Figure 1, which was followed for all acquired dMRI (Table 1).
Results
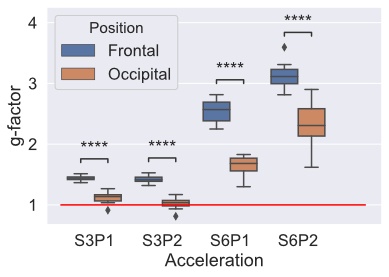
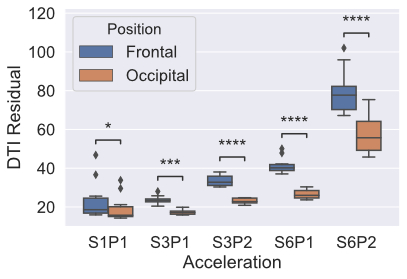
Figure 2 shows the result of calculating g-factor across different acceleration schemes. Significant differences were seen between the frontal and occipital areas in all acceleration schemes, with higher g-factors in the frontal areas. Higher acceleration factors had higher g-factors.Figure 3 shows the results of residual map analysis. We saw the same pattern as in g-factor, with occipital areas having lower residuals (better fit) compared to frontal areas. In the S1P1 data, there is a significant, but small, difference in the residuals.
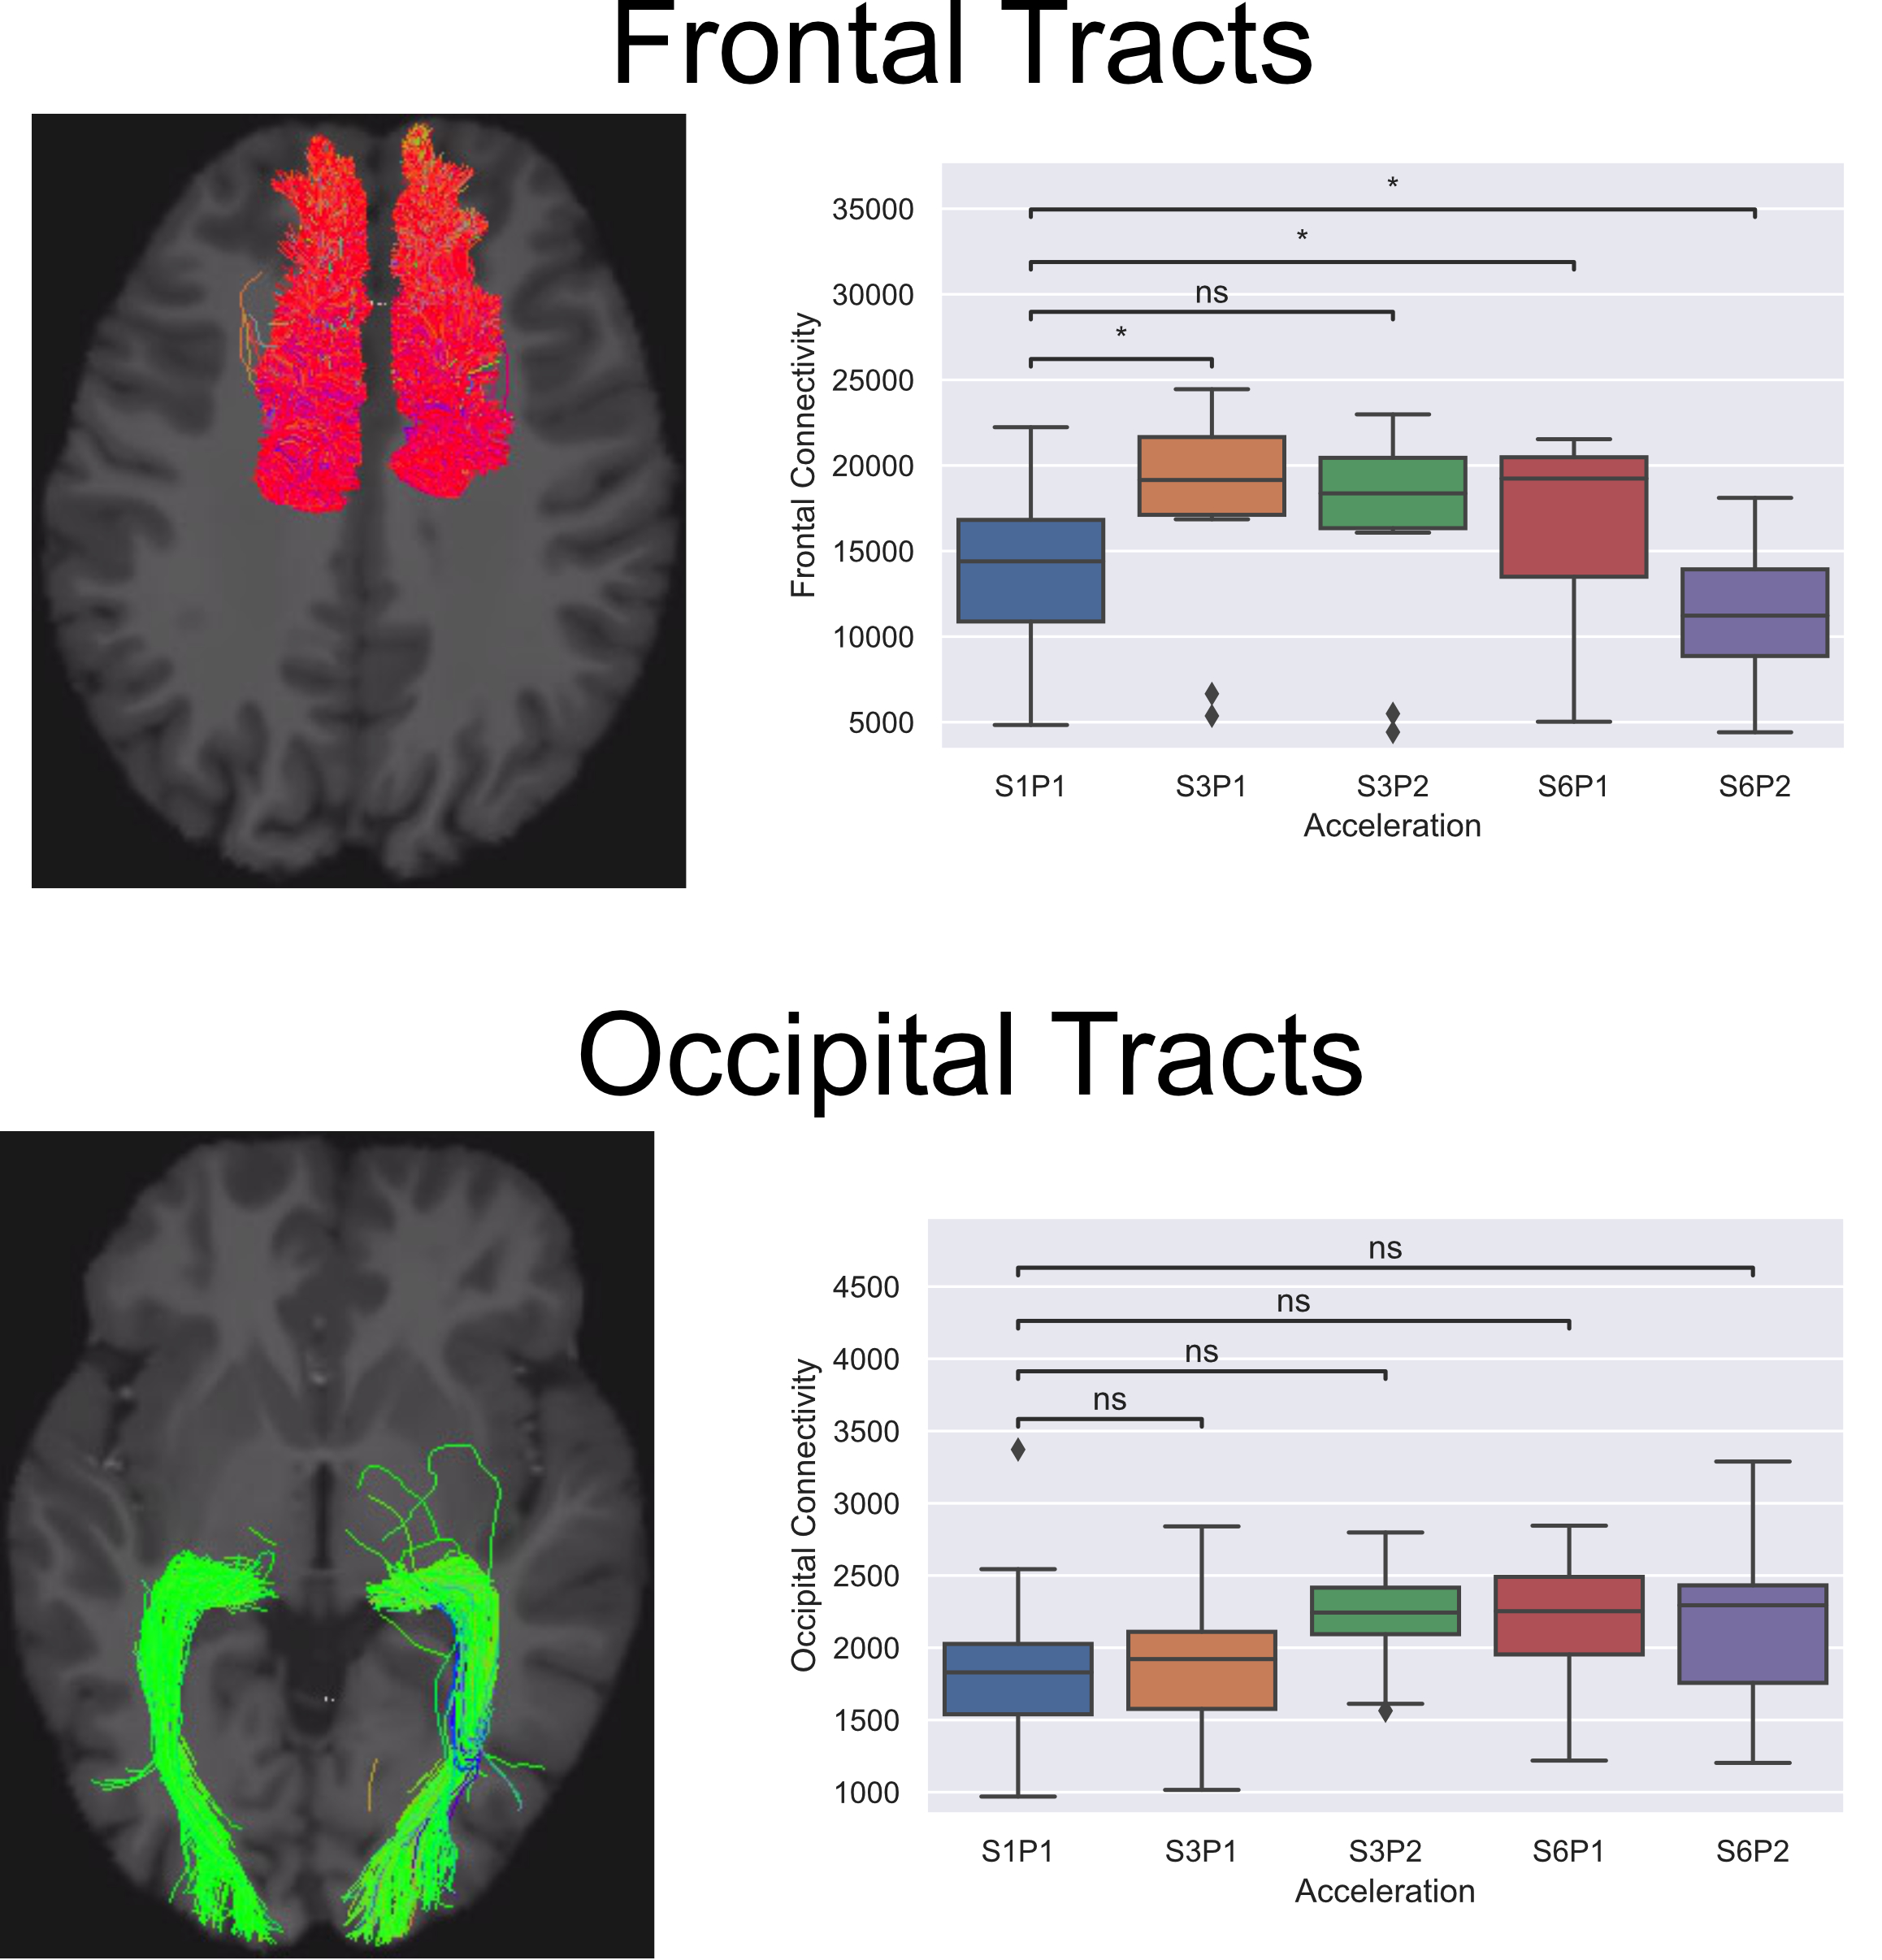
Figure 4 shows the results of structural connectome analysis. The number of streamlines is displayed on the y-axis, all accelerated acquisitions were compared to the S1P1 acquisition. One can see that there are changes in the number of streamlines only in the frontal tracts as a function of acceleration, while the occipital tracts are more stable.
Discussion
In this work, we sought to understand how SMS and phase acceleration factors influence g-factor, and consequently influence DTI and fODF processing. We found that frontal areas had lower SNR compared to occipital areas across all dMRI acquisitions, and g-factor of both areas increased with higher acceleration factors. The magnitude and spatial distribution of g-factor itself is a complex function of coil design and MRI sequence [17]. The lower g-factor in the occipital region leads to more accurate tensor fitting (lower residual), and more stable streamlines over acceleration factors. In the frontal areas, we saw that the residual was higher, and there was a corresponding influence of acceleration factor on the number of reconstructed streamlines. Further work should go into better understanding the spatial distribution of g-factor and potentially updating tensor/fODF fitting algorithms to account for spatially dependent g-factor fluctuations, such as implementing a weighted-least squares penalty based on g-factor.Acknowledgements
We would like to thank all participants in this study. This study was funded by NIH grant AG066970 and an intramural pilot grant provided by the Center for Advanced Brain Imaging and Neurophysiology (CABIN) at the University of Rochester.References
1. Lee, K.J., et al., Simultaneous multislice imaging with slice-multiplexed RF pulses. Magn Reson Med, 2005. 54(4): p. 755-60.
2. Larkman, D.J., et al., Use of multicoil arrays for separation of signal from multiple slices simultaneously excited. J Magn Reson Imaging, 2001. 13(2): p. 313-7.
3. Xu, J., et al., Evaluation of slice accelerations using multiband echo planar imaging at 3 T. Neuroimage, 2013. 83: p. 991-1001.
4. Zhao, T., et al., Test-retest reliability of white matter structural brain networks: a multiband diffusion MRI study. Front Hum Neurosci, 2015. 9: p. 59.
5. Duan, F., et al., Test-retest reliability of diffusion measures in cerebral white matter: A multiband diffusion MRI study. J Magn Reson Imaging, 2015. 42(4): p. 1106-16.
6. Tournier, J.D., et al., Resolving crossing fibres using constrained spherical deconvolution: validation using diffusion-weighted imaging phantom data. Neuroimage, 2008. 42(2): p. 617-25.
7. Andersson, J.L., S. Skare, and J. Ashburner, How to correct susceptibility distortions in spin-echo echo-planar images: application to diffusion tensor imaging. Neuroimage, 2003. 20(2): p. 870-88.
8. Andersson, J.L.R. and S.N. Sotiropoulos, An integrated approach to correction for off-resonance effects and subject movement in diffusion MR imaging. Neuroimage, 2016. 125: p. 1063-1078.
9. Andersson, J.L.R., et al., Incorporating outlier detection and replacement into a non-parametric framework for movement and distortion correction of diffusion MR images. Neuroimage, 2016. 141: p. 556-572.
10. Robson, P.M., et al., Comprehensive quantification of signal-to-noise ratio and g-factor for image-based and k-space-based parallel imaging reconstructions. Magn Reson Med, 2008. 60(4): p. 895-907.
11. Breuer, F.A., et al., General formulation for quantitative G-factor calculation in GRAPPA reconstructions. Magn Reson Med, 2009. 62(3): p. 739-46.
12. Garyfallidis, E., et al., Dipy, a library for the analysis of diffusion MRI data. Front Neuroinform, 2014. 8: p. 8.
13. Lancaster, J.L., et al., Automated Talairach atlas labels for functional brain mapping. Hum Brain Mapp, 2000. 10(3): p. 120-31.
14. Girard, G., et al., Towards quantitative connectivity analysis: reducing tractography biases. Neuroimage, 2014. 98: p. 266-78.
15. Desikan, R.S., et al., An automated labeling system for subdividing the human cerebral cortex on MRI scans into gyral based regions of interest. Neuroimage, 2006. 31(3): p. 968-80.
16. Fischl, B., FreeSurfer. Neuroimage, 2012. 62(2): p. 774-81.
17. Larkman, D.J. and R.G. Nunes, Parallel magnetic resonance imaging. Phys Med Biol, 2007. 52(7): p. R15-55.
Figures