2444
Accelerating Diffusion Tensor Imaging of the Rat Brain using Deep Learning1Biomedical Engineering, University of Arizona, Tucson, AZ, United States, 2Electrical and Computer Engineering, University of Arizona, Tucson, AZ, United States, 3Medical Imaging, University of Arizona, Tucson, AZ, United States, 4Program in Applied Mathematics, University of Arizona, Tucson, AZ, United States, 5Evelyn F. McKnight Brain Institute, University of Arizona, Tucson, AZ, United States, 6Departments of Psychology and Psychiatry, University of Arizona, Tucson, AZ, United States, 7Division of Neural System, Memory & Aging, University of Arizona, Tucson, AZ, United States, 8Departments of Psychology, Neurology and Neuroscience, University of Arizona, Tucson, AZ, United States
Synopsis
The aim of this work is to accelerate analysis of diffusion weighted MRI (dMRI) of the rat brain using deep learning. The proposed approach allows prediction of unacquired diffusion-weighted images (DWIs) from a small set of acquired DWIs. By combining the acquired and predicted DWIs, accurate and reliable diffusion tensor metrics can be obtained with up to ten-fold reduction in scan time.
Introduction
dMRI is an important tool for characterization of the microstructural architecture of tissues. dMRI techniques such as diffusion tensor imaging (DTI)1 have been employed in rodents to study a wide range of structural and pathological processes such as neuronal connectivity2, ischemia3, tumor growth and response to therapy4. One of the major challenges when incorporating dMRI in rodent imaging protocols is the long data acquisition times required to obtain a large number of DWIs to ensure accurate estimation of the diffusion tensor. Recently, deep learning (DL) techniques have been proposed to accelerate dMRI5,6,7. In this work, we present a novel DL technique for accelerating DTI of the rat brain.Methods
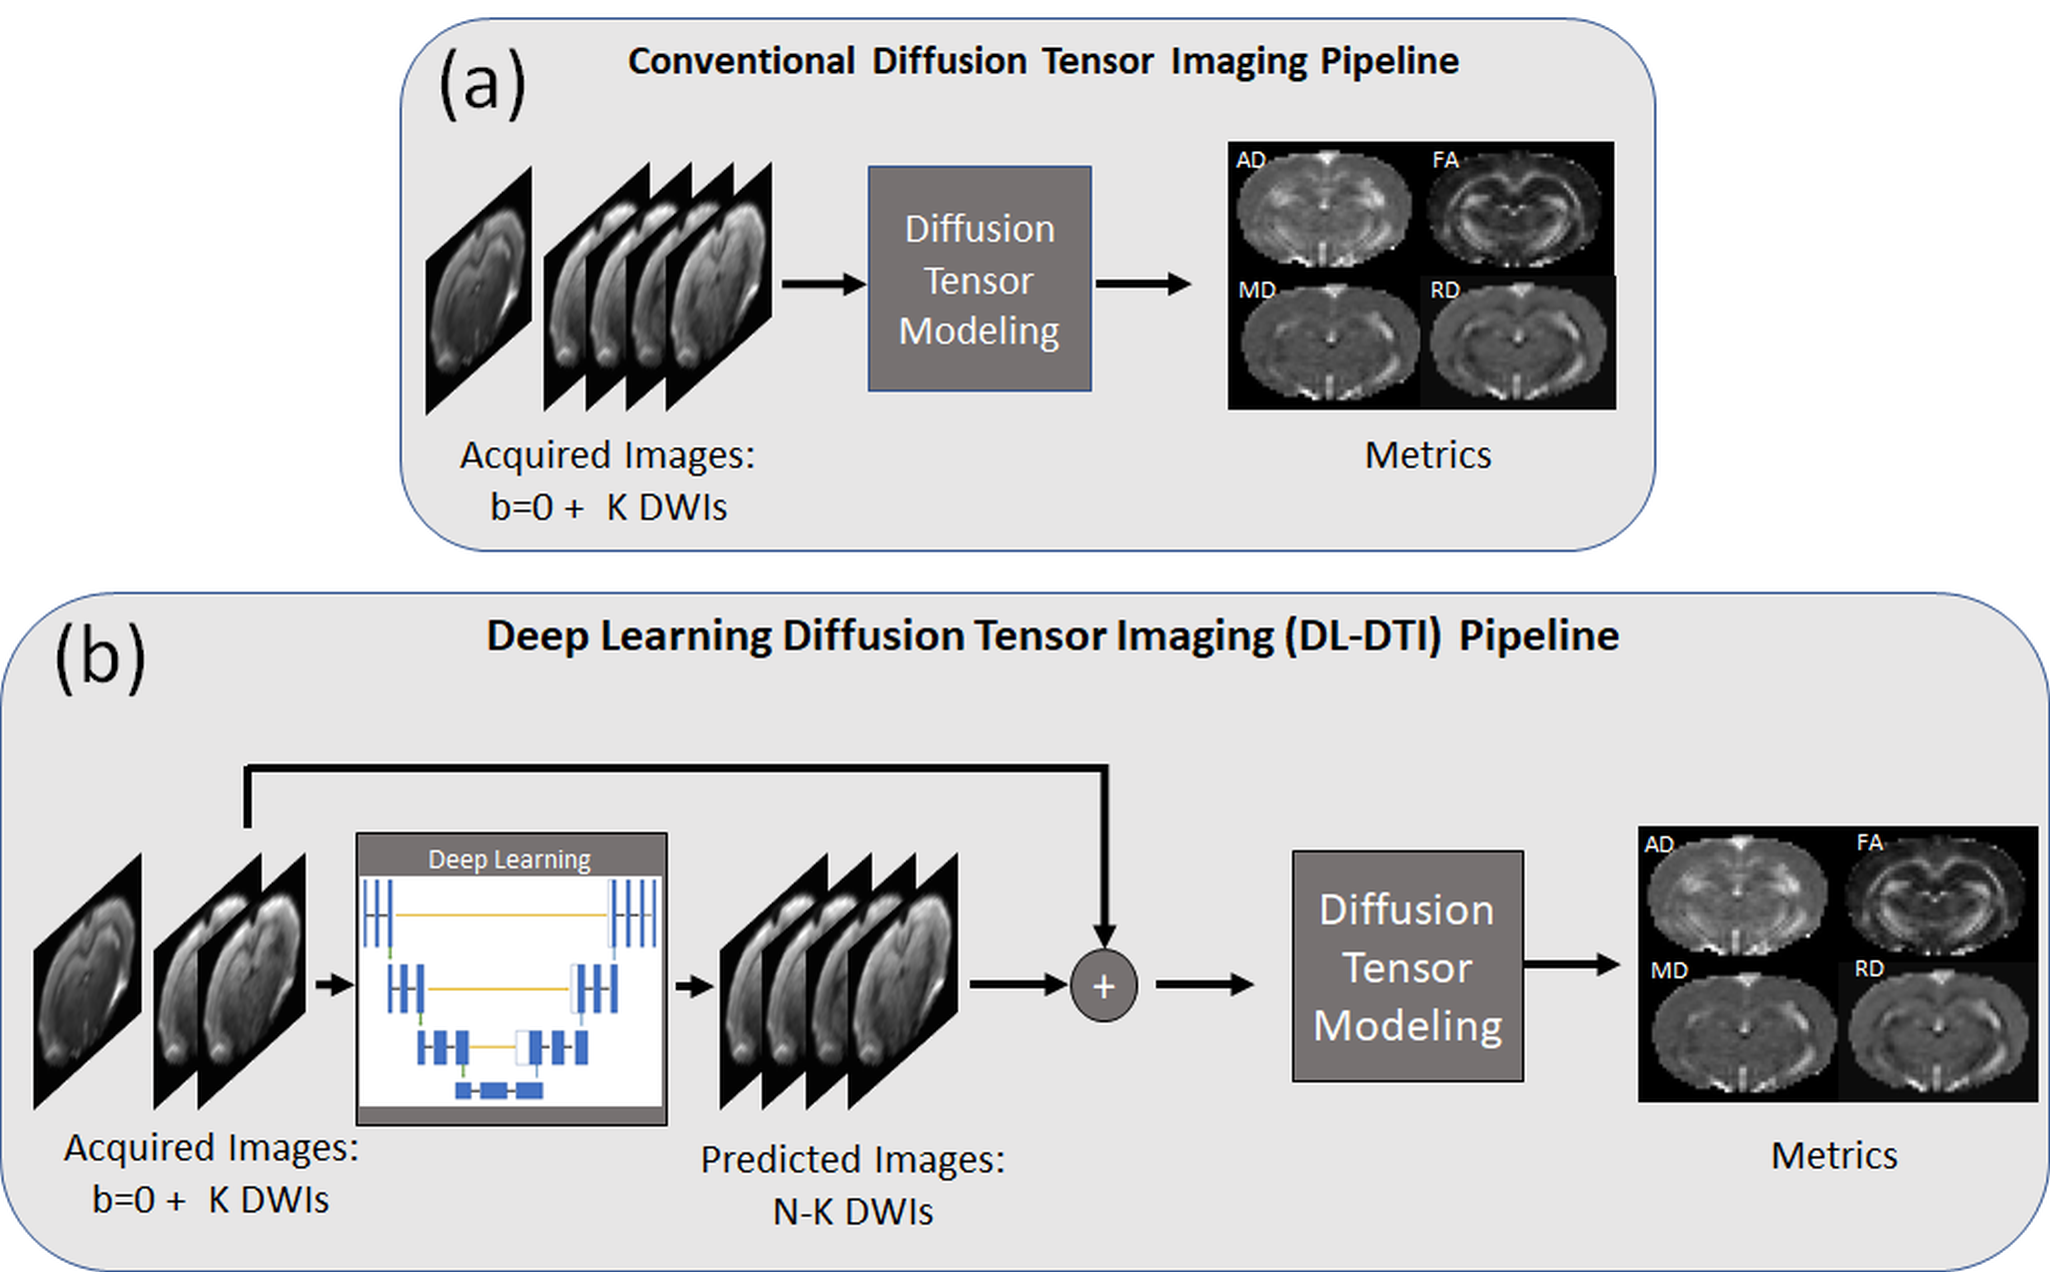
Ninety-seven male Fischer 344 rats were used in this experiment. Brain MRI was collected using a 7T Bruker Biospec (Bruker, Billerica, MA). A volume coil was used for excitation and a 4-channel phased array surface coil for reception. Single-shot spin-echo diffusion-weighted echo planar imaging was carried out with an in-plane resolution of 300μm and slice thickness of 900μm. This sequence was carried out with b=1000 s/mm2, using 64 directions with 4 b=0 s/mm2 acquisitions. TORTOISE software8 was used for eddy current and motion correction, and for denoising. These DWIs were then used to estimate the diffusion tensor. Tensor-derived metrics of Fractional Anisotropy (FA), Mean Diffusivity (MD), Axial Diffusivity and Radial Diffusivity (RD), were calculated as illustrated in Figure 1(a). The metrics derived from N=64 DWIs were used as reference values in subsequent analysis. Datasets to simulate accelerated data acquisition with K=6,8,10 and 12 DWIs were generated by subsampling the full set using the first K DWIs of the reference dataset. The proposed DL-DTI pipeline is illustrated in Figure 1(b). The first step in this pipeline is to predict the DWIs corresponding to the N-K unacquired diffusion directions given the K acquired DWIs using DL. The N-K predicted DWIs are then combined with the K acquired DWIs to estimate the diffusion tensor. The DTI metrics are then computed using this tensor. The DL inference process is carried out using a convolution neural network (CNN), which has contracting and expansive paths connected with skip connections (similar to Unet9), residual layers, and channel attention. Deconvolution was used for upsampling. The CNN input tensor dimensions are 96 X 96 X 5 X (K+1) and the output tensor dimensions are 96 X 96 X 5 X (N-K), where N=64 represents the total number of DWIs and K represents the number of acquired (input) DWIs. The b=0 s/mm2 image is also used as input to the CNN. The network was implemented in Python using Keras with Tensorflow backend and executed on an NVIDIA Tesla P100 GPU with 16GB vRAM. Overlapping patches from 50 randomly selected datasets were used for training, 3 other datasets were used for validation, and the remaining 44 datasets were used for testing. Experiments were conducted with K=6,8,10, and 12 to represent different acceleration ratios. The Adam optimizer with batch size = 16 was used to train each network for up to 50 epochs with initial learning weight = 10-3, which was reduced by half when the metric stopped improving. An early stopping was adopted when the mean absolute error loss improvement fell below 10-5. Although network training took roughly 10 hours for each case, predictions using a trained network can be obtained in roughly 11s for each subject. Normalized Root Mean Squared Error (NRMSE) between the acquired DWIs and predicted DWIs were evaluated. MRtrix software9 was used for tensor and DTI metric calculations. DTI metrics from accelerated acquisitions were calculated and compared to the DTI metrics obtained from the reference datasets with N=64 DWIs.Results and Discussion
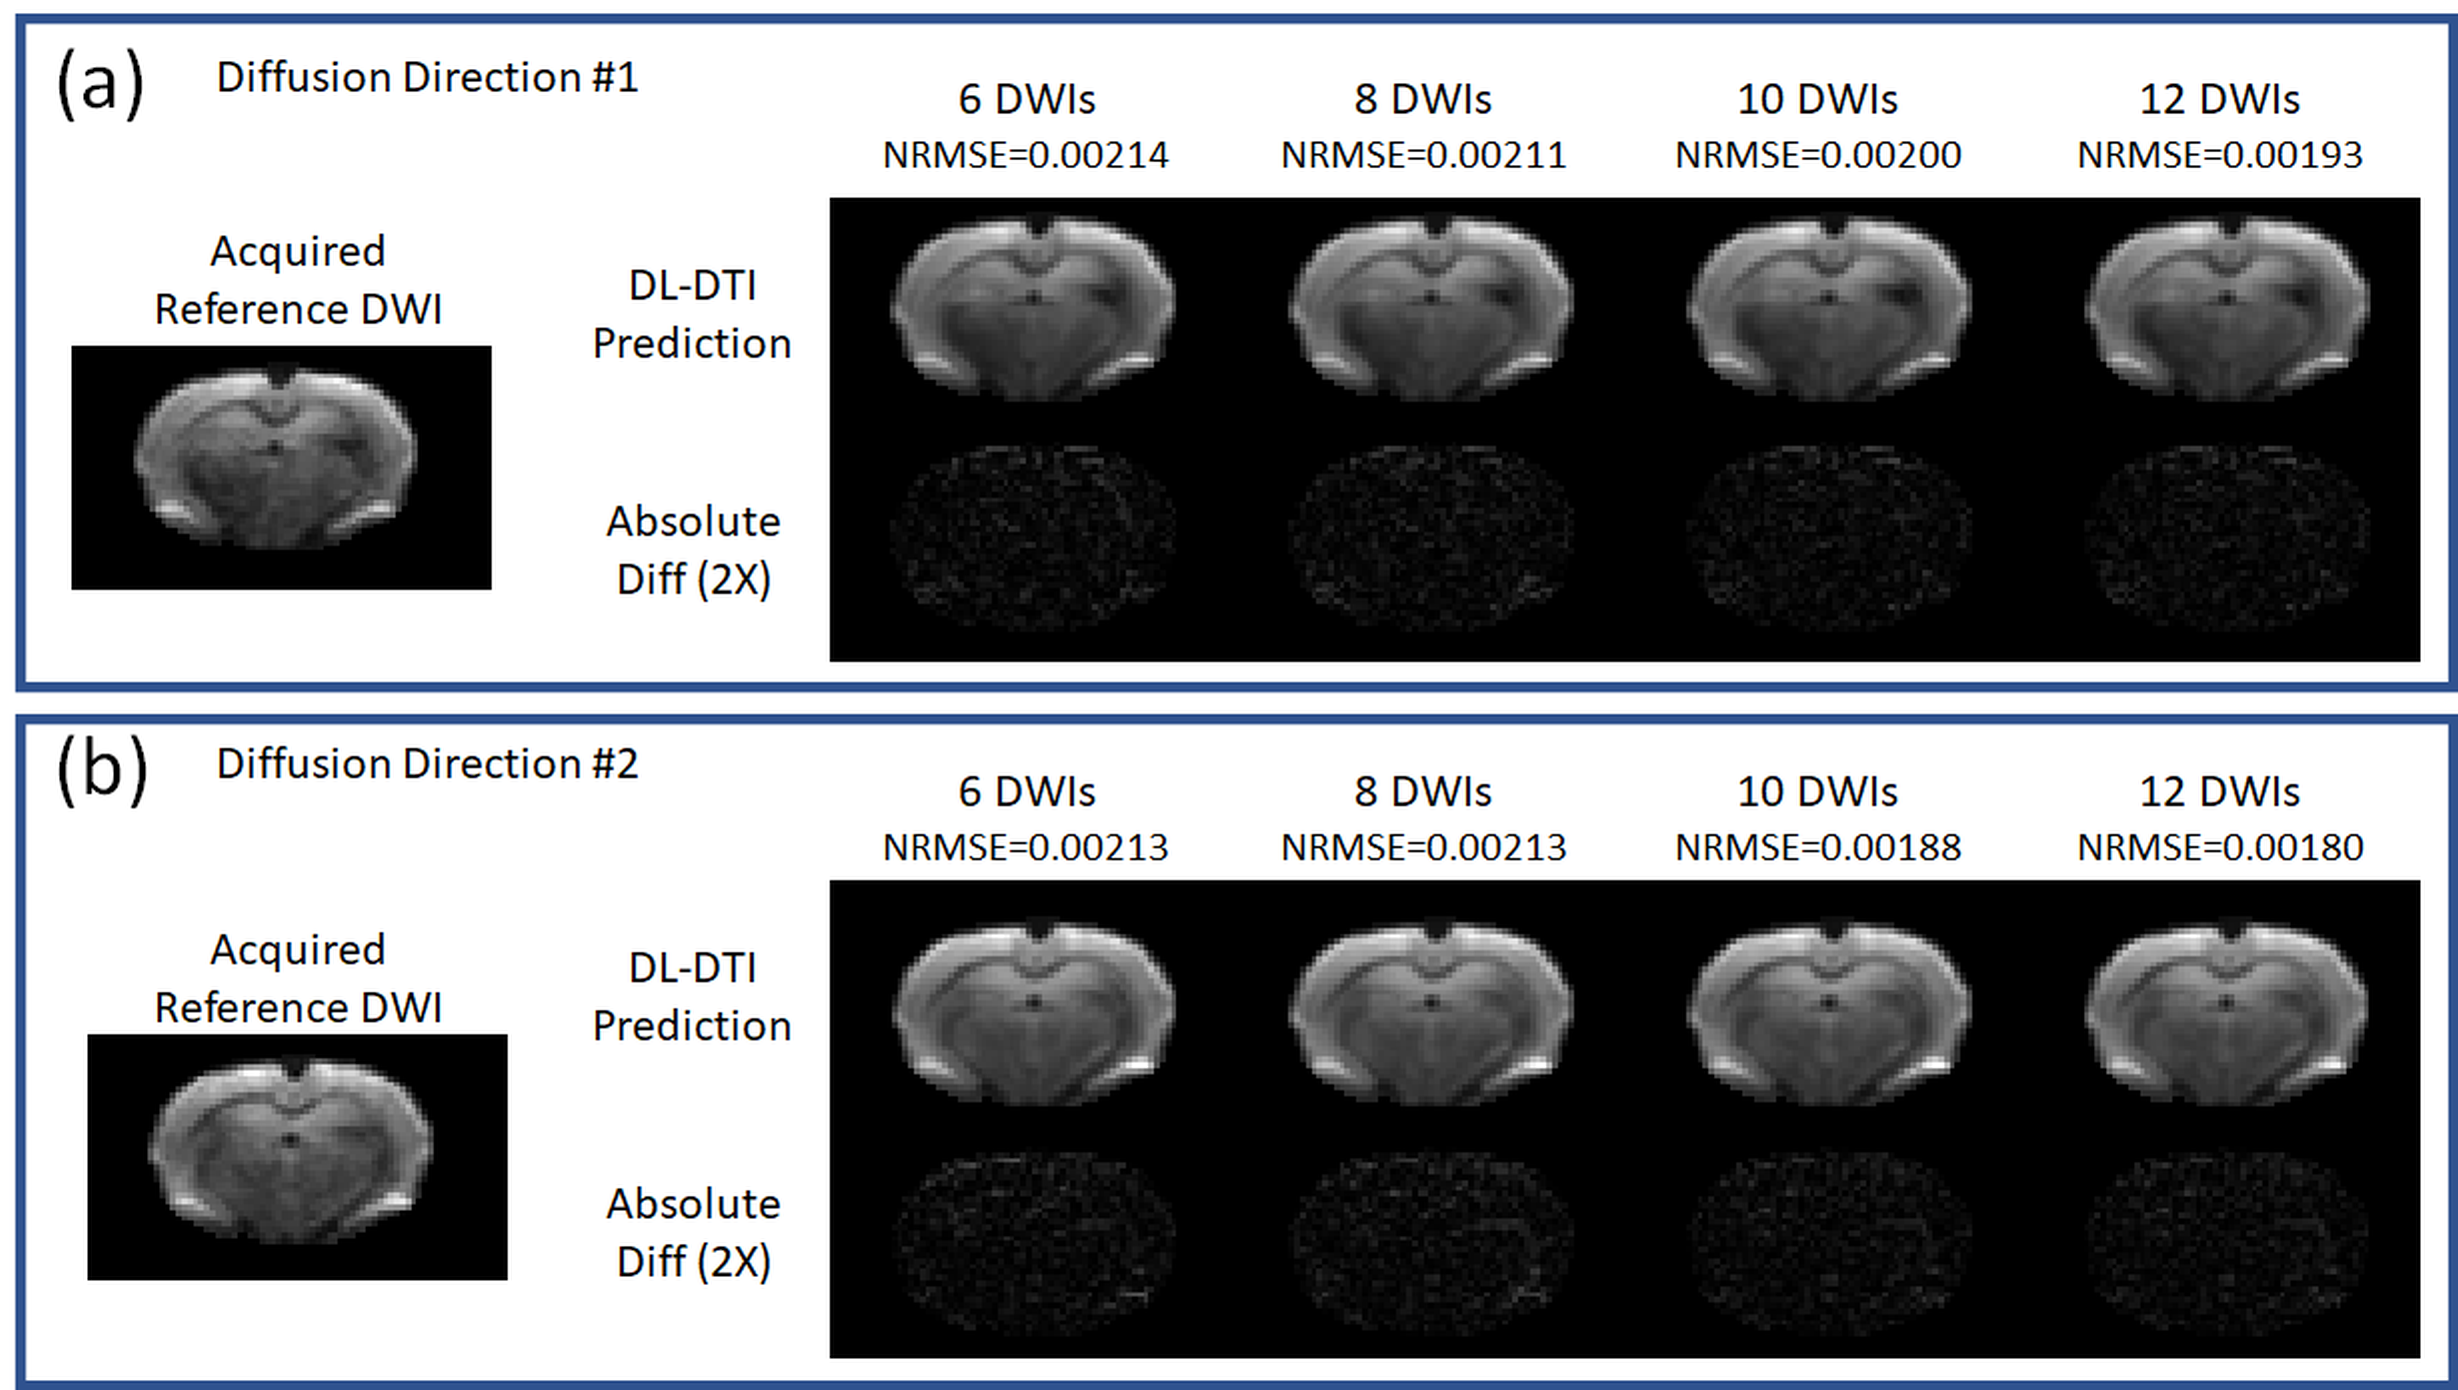
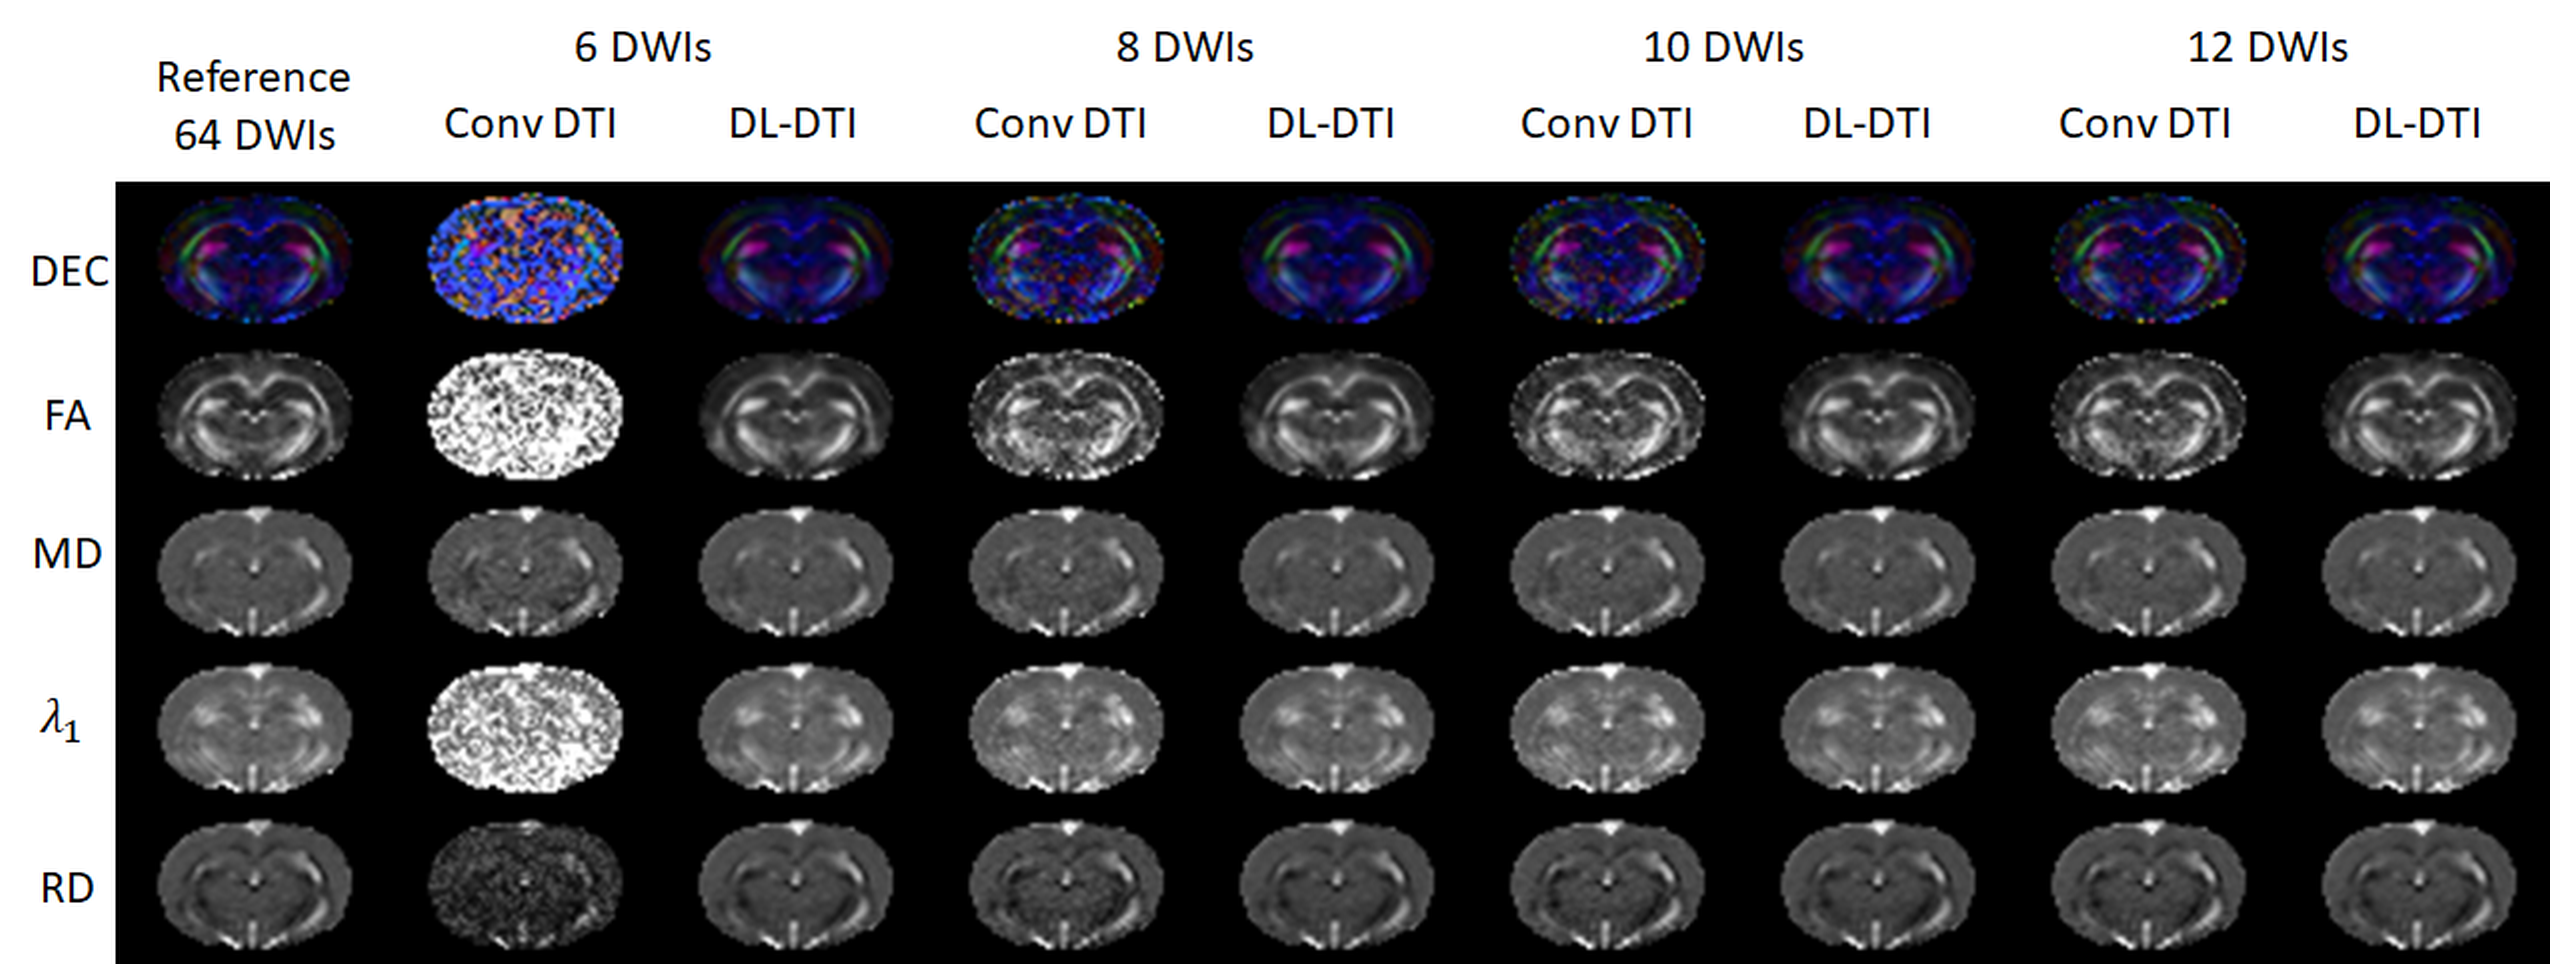
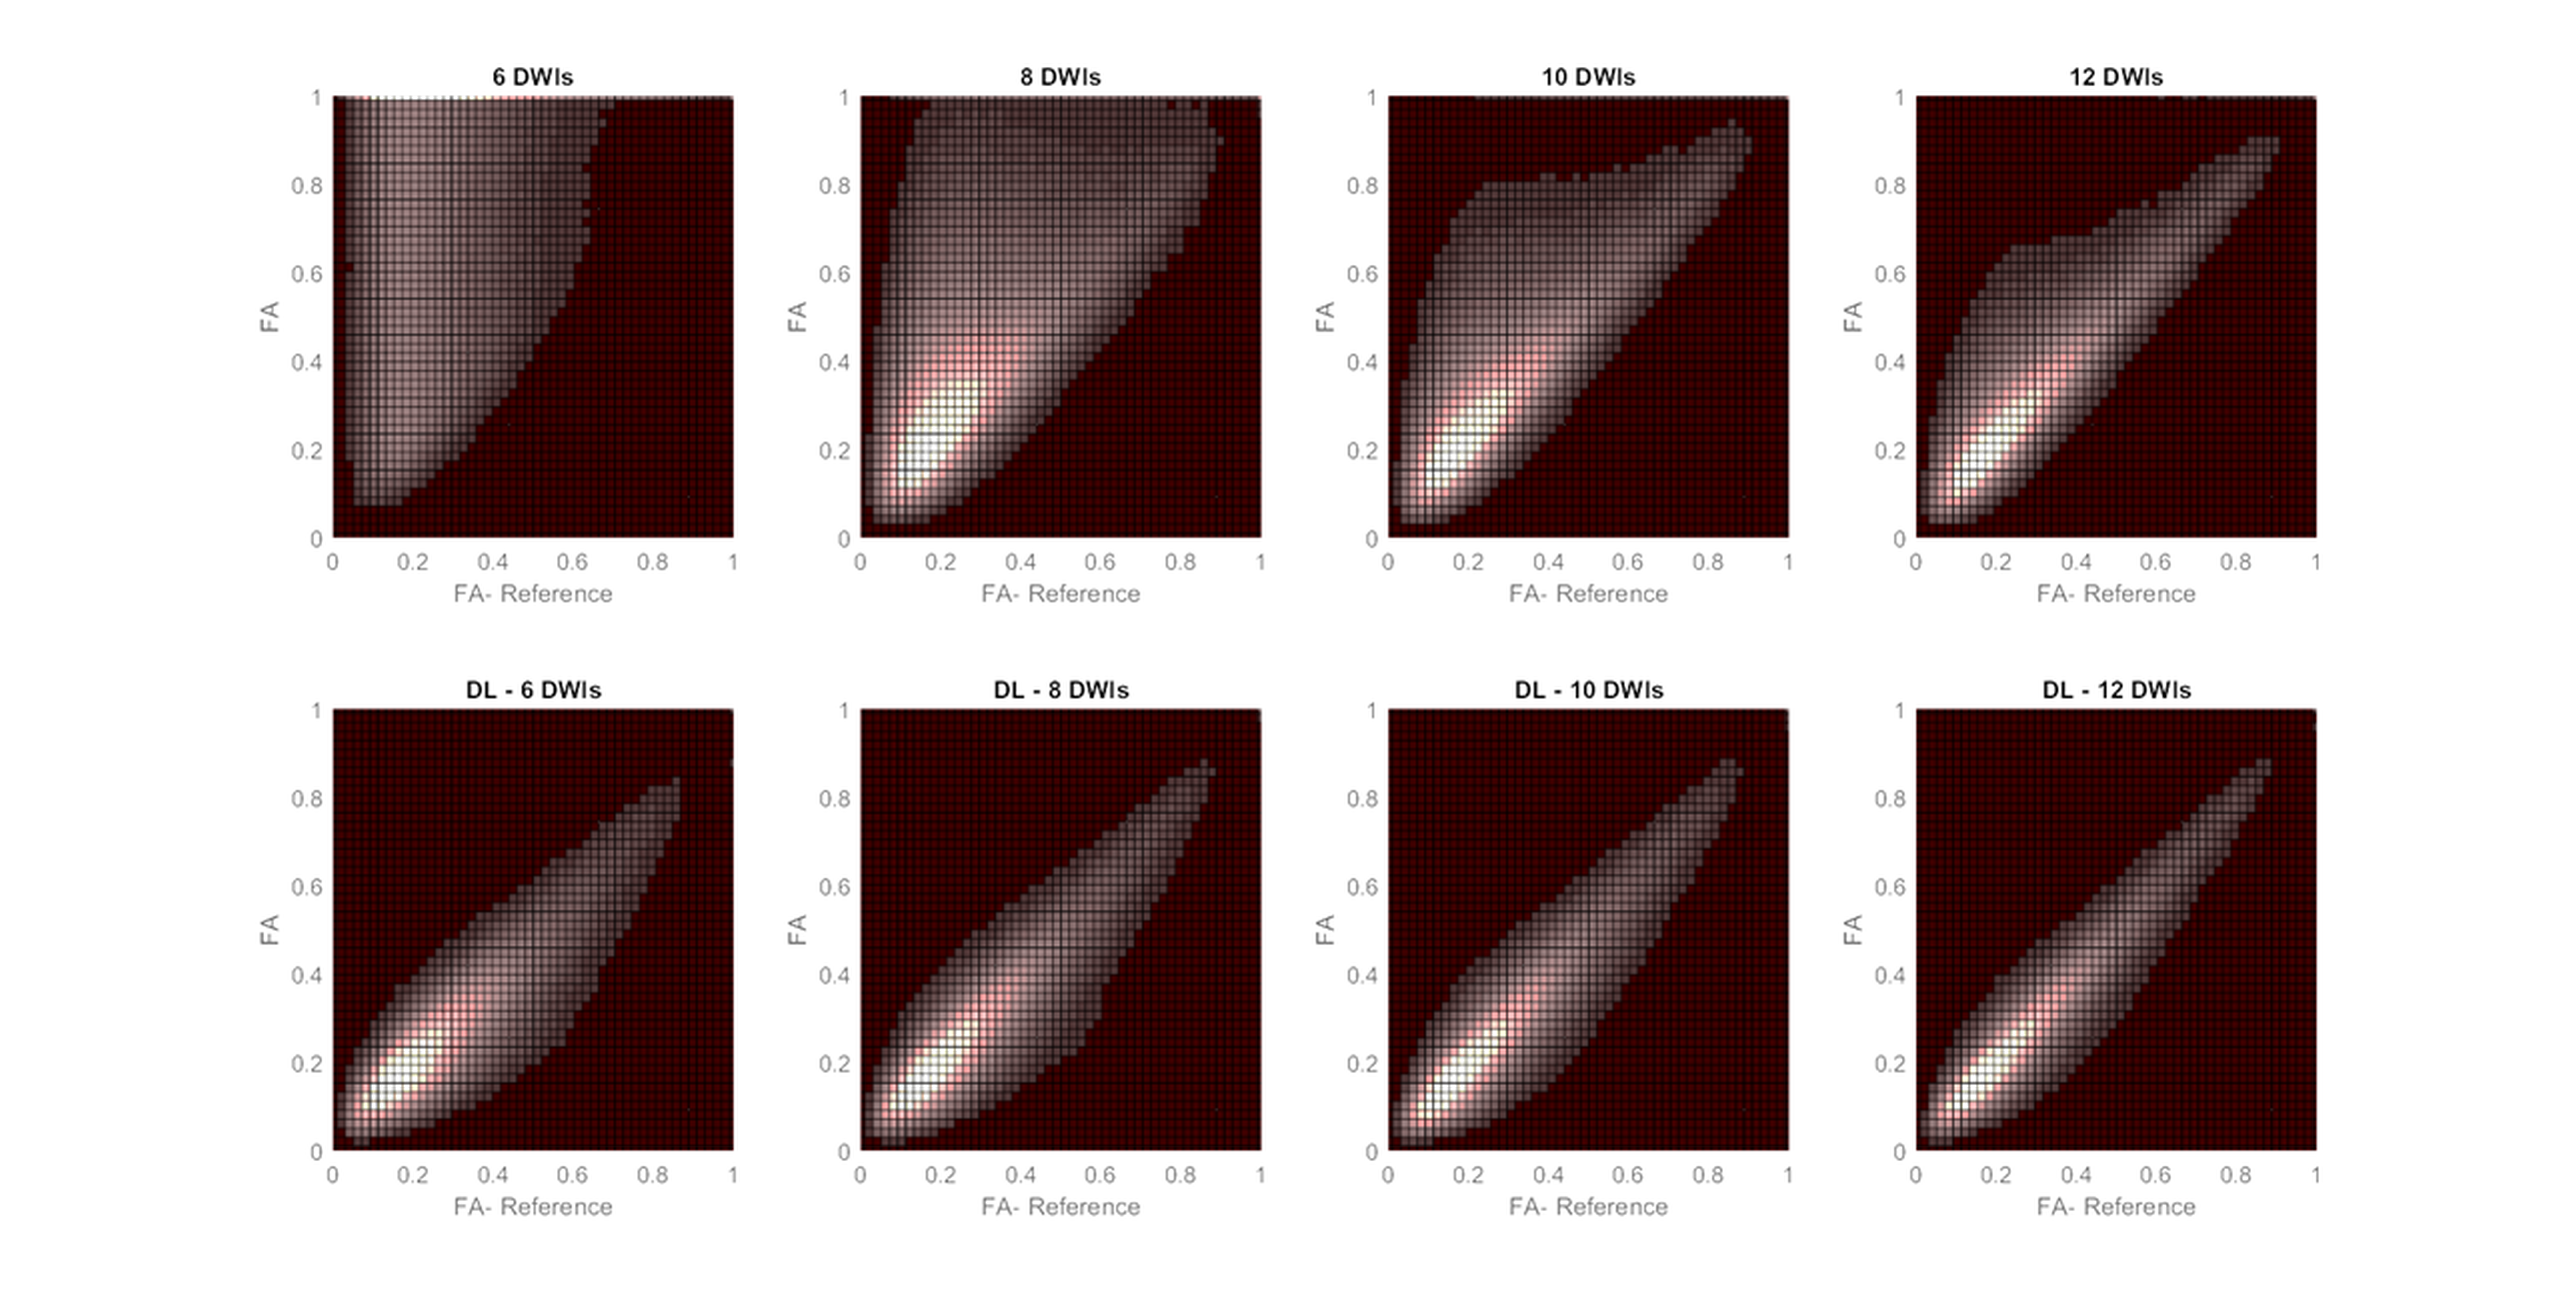
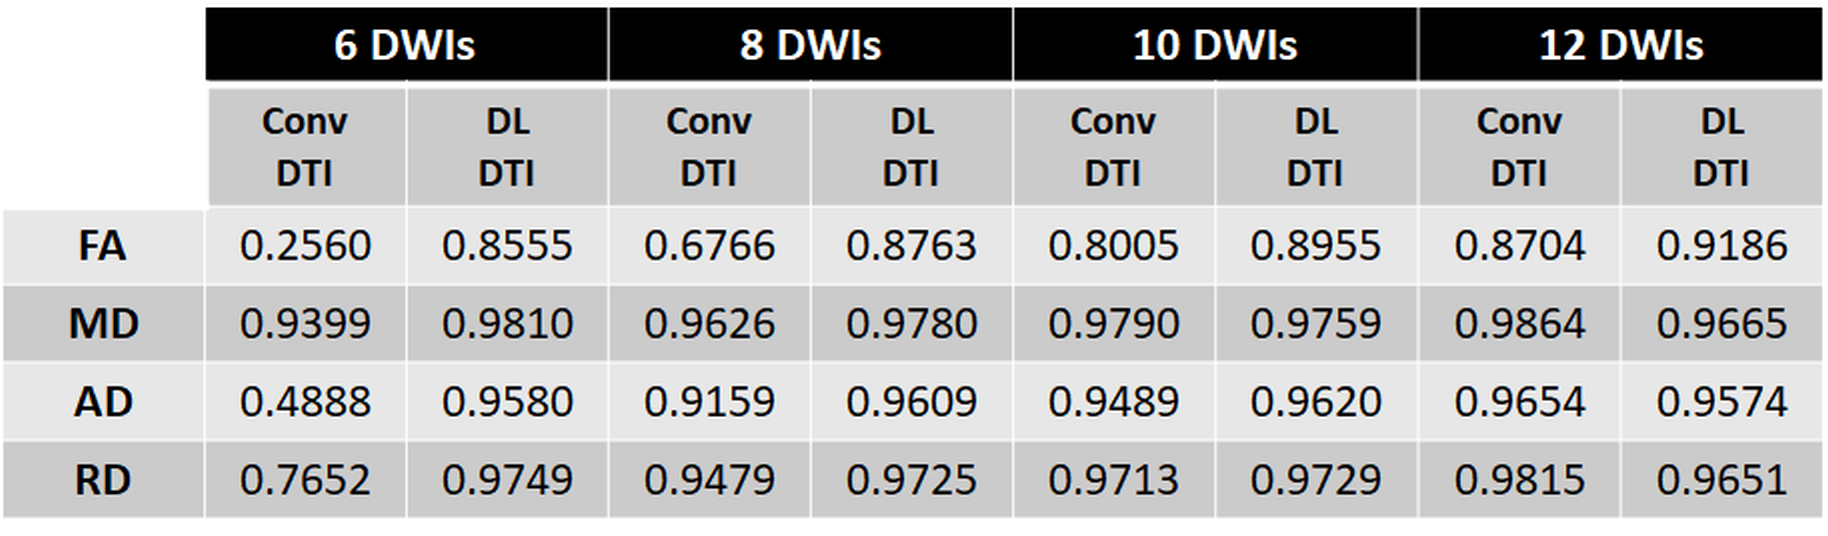
Figure 2 demonstrates predicted DWIs produced by the DL-DTI technique for two different diffusion directions. The NRMSE values demonstrate that the performance of the network improves with increasing number of input DWIs. Figure 3 shows DTI metrics obtained using conventional DTI and DL-DTI at different acceleration ratios. While the DL-DTI provides high quality maps with as few as 6 acquired DWIs, the conventional approach yields noisy maps even with 12 DWIs. Figure 4 shows two-dimensional histograms obtained using the test cohort (n=44) demonstrating the correlation between the reference FA values obtained using 64 DWIs and the FA values from the accelerated techniques. These histograms demonstrate that the FA values are overestimated in the conventional DTI pipeline and the overestimation increases with the acceleration ratio. However, the DL-DTI pipeline produces FA values that are highly correlated with the reference values and the DL-DTI FA values are mostly symmetrically distributed around the reference values (no significant over/under estimation). Table 1 provides the Pearson Correlation Coefficient (PCC) between accelerated and reference DTI metrics over the entire test cohort. While the conventional DTI pipeline results in noticeable reduction of PCC with increasing acceleration, the DL-DTI pipeline provides consistently high PCCs, even at very high acceleration ratios.Conclusions
We have introduced a novel DL approach to accelerate dMRI of the rat brain. The proposed approach allows prediction of unacquired DWIs and yields DTI metrics that are highly correlated with those obtained using acquisitions that are an order of magnitude longer.Acknowledgements
The authors would like to acknowledge support from Technology and Research Initiative Fund (TRIF) Improving Health Initiative, NIH Grants RO1 AG049464, RO1 AG049465, P30 AG019610, McKnight Brain Research Foundation, state of Arizona and Arizona DHS, and Biomedical Imaging and Spectroscopy Training Grant.References
1. Basser PJ, Mattiello J, LeBihan D. Estimation of the effective self-diffusion tensor from the NMR spin echo. J Magn Reson B 1994;103:247–254.
2. Xue, R., van Zijl, P.C., Crain, B.J., Solaiyappan, M. and Mori, S. (1999), In vivo three‐dimensional reconstruction of rat brain axonal projections by diffusion tensor imaging. Magn. Reson. Med., 42: 1123-1127.
3. Bockhorst KH, Narayana PA, Liu R, Ahobila-Vijjula P, Ramu J, Kamel M, Wosik J, Bockhorst T, Hahn K, Hasan KM, Perez-Polo JR. Early postnatal development of rat brain: in vivo diffusion tensor imaging. J Neurosci Res. 2008 May 15;86(7):1520-8. doi: 10.1002/jnr.21607. PMID: 18189320.
4. Lope-Piedrafita S, Garcia-Martin ML, Galons JP, Gillies RJ, Trouard TP. Longitudinal diffusion tensor imaging in a rat brain glioma model. NMR Biomed. 2008 Oct;21(8):799-808. doi: 10.1002/nbm.1256. PMID: 18470959; PMCID: PMC2857329.
5. Golkov, V., et al., 2016. q-Space deep learning: twelve-fold shorter and model-free diffusion MRI scans. IEEE Trans. Med. Imag. 35, 1344–1351.
6. Aliotta, E., Nourzadeh, H., Sanders, J., Muller, D., Ennis, D.B., 2019. Highly accelerated, model-free diffusion tensor MRI reconstruction using neural networks. Med. Phys. 46, 1581–1591.
7. Tian Q, Bilgic B, Fan Q, Liao C, Ngamsombat C, Hu Y, Witzel T, Setsompop K, Polimeni JR, Huang SY. DeepDTI: High-fidelity six-direction diffusion tensor imaging using deep learning. NeuroImage, Volume 219: 117017, 2020.
8. Ronneberger O, Fischer P, Brox T. U-Net: Convolutional Networks for Biomedical Image Segmentation. Medical Image Computing and Computer-Assisted Intervention (MICCAI), Springer, LNCS, Vol.9351: 234--241, 2015.
9. Pierpaoli C, Walker L, Irfanoglu MO, Barnett A, Basser P, Chang L-C., Koay C, Pajevic S, Rohde G, Sarlls J, and Wu M, TORTOISE: an integrated software package for processing of diffusion MRI data, ISMRM 18th annual meeting, Stockholm, Sweden, abstract #1597, 2010.
10. Tournier JD, Smith RE, Raffelt D, Tabbara R, Dhollander T, Pietsch M, Christiaens D, Jeurissen B, Yeh C-H, and Connelly A. MRtrix3: A fast, flexible and open software framework for medical image processing and visualisation. NeuroImage, 202 (2019), pp. 116–37.
Figures