2442
Deep learning-based DWI Denoising method that suppressed the "instability" problem1Department of Radiology, Graduate School of Medicine, Juntendo University, Tokyo, Japan, 2Graduate School of Human Health Sciences, Tokyo Metropolitan University, Tokyo, Japan, 3Department of Molecular Imaging and Theranostics National Institute of Radiological Sciences National Institutes for Quantum and Radiological Science and Technology, Chiba, Japan, 4Miliman, Tokyo, Japan
Synopsis
Deep learning-based noise reduction technique for DWI contains a risk of outputting values that are greatly deviating from what it should be because of the instability problem of deep learning. The neural network model was designed in this study to suppress this risk which can fix the generated value for each pixel within the range of values of neighboring pixels in the original image. The results of the volunteer study suggested that the proposed method has potential to provide effective denoising beside suppressing the instability risk.
Introduction
The deep learning-based noise reduction for diffusion-weighted images is a topic that has been well discussed. 1-3 However, due to the instability problem in deep learning, 4 it was difficult to exclude the risk that some of the obtained values deviate greatly from what they should be. To solve this problem, we have developed a neural network model which can limit the range of the value of each pixel to the range of values of the neighboring pixels in the original data. The purpose of this study was to conduct an initial investigation whether the proposed model can reduce noise appropriately.Method
Data acquisitionTen healthy volunteers (man 6, woman 4, age 21-33 year) were included as subjects, and their brain DWI was acquired using a clinical 3T scanner equipped with a 64-channel head coil. The major parameters were, echo-planner imaging, TR /TE: 3900 /7 ms, matrix: 116x116 (2x2 mm), thickness: 2 mm, b-values: 0, 1000, and 2000 s/mm2, diffusion encoding directions: 30, and number of excitation (NEX): 8.
Network architecture, and training and testing
The proposed neural network model was designed to convert a NEX1 image to an image equivalent to NEX8 image (deep learning-based noise reduction image: dNR) (Figure 1). The training was performed for each b-value separately using NEX1 and NEX8 images as inputs and targets, respectively. The loss to be minimized were, 1. Mean absolute error between the output and target images, and 2. Euclid distance between the diffusion tensors calculated from those images. The training and testing were performed by leave-one-out cross validation. Optimization was performed by Adam algorithm (initial learning rate: 0.0001). 5
ROI-based analysis
Isotropic DWI, and diffusional parameters related to DTI, 6 DKI, 7 and NODDI, 8 were obtained from NEX1, NEX8, and dNR images, respectively (Figure 2). The following ROIs were defined manually for each subject according to the previous study. 9 Additionally, the mean value for each ROI was calculated for isotropic DWI and parameter maps: 1. Corpus callosum, 2. Deep white matter, 3. Periventricular white matter, 4. Deep gray matter, and 5. Cortical gray matter.
Tract analysis
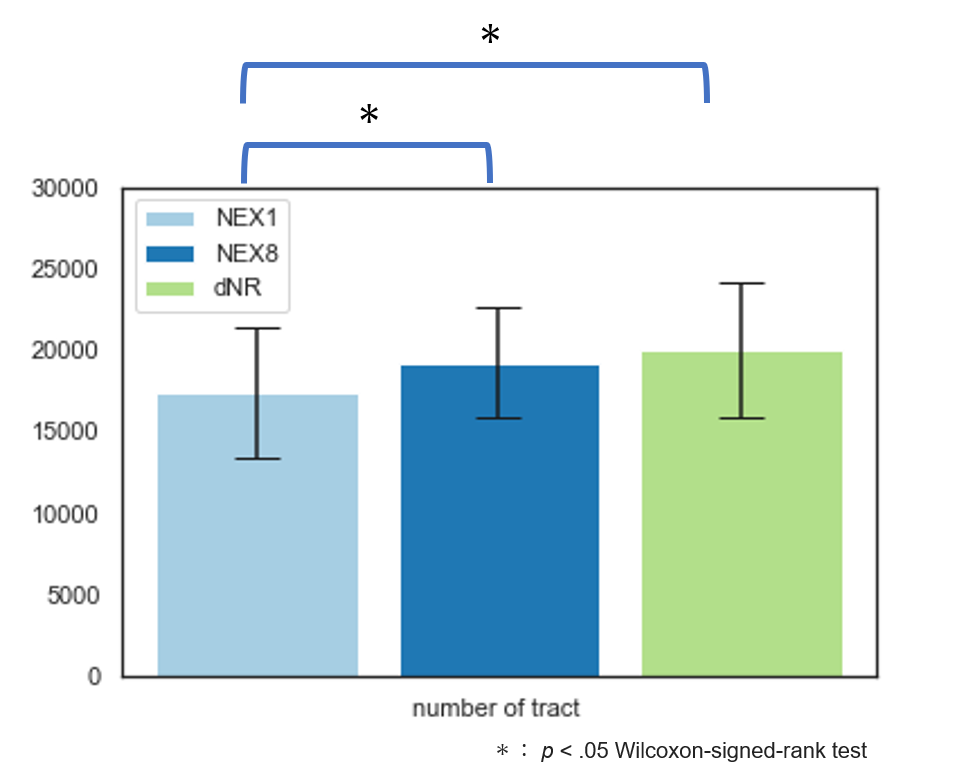
Tractography analysis was performed for NEX1, NEX8, and dNR series of each patient. The seed and target ROIs were defined manually at cerebral peduncle and precentral gyrus, respectively, and 100,000 probabilistic tracts were drawn under the MSMT-CSD algorithm, 10 which employed second-order integration over the FOD (iFOD2) algorithm 11 using: step size, 1.0mm; maximum curvature, 45° per step; length, 4–200mm; and fiber orientation distribution threshold, 0.1. The number of the successfully obtained tracts was recorded.
Statistics
The ROI-based values of isotropic DWI and parameter maps were compared statistically among NEX1, NEX8, and dNR. Wilcoxon signed-rank test was used and P<.05 was considered as significant. The recorded number of tracts in tract analysis was also compared similarly.
Results
Visually, dNR was less noisy than NEX1 in both DWI and parameter maps, which enabled identifying the detailed anatomical structures as well as NEX8 (Figure 3). This merit was particularly noticeable in regions around the center of the brain.In ROI-based analysis, dNR was closer to NEX8 than NEX1 in most regions and parameter maps, and not a few of the significant differences seen between NEX1 and NEX8 became non-significant in between dNR and NEX8 (Figure 4). On the other hand, dNR was particularly not successful in deep white matter and periventricular white matter regions in ODI, because the difference compared to NEX8 was significant in dNR and not in NEX1.
Tract analysis showed that the number of tracts obtained by dNR was significantly larger than that of NEX1 (P<.001) and comparable to that of NEX8 (Figure 5).
Discussion
The proposed method can reduce the risk of outputting an outlying value due to the instability problem, because the value of each pixel in dNR do not exceed the range of the neighboring pixels’ values in the original image, which is advantageous in clinics.The visual evaluation showed that image quality was greatly improved in dNR. Moreover, the results of the ROI-based study which dNR showed advantage to NEX1 in both isotropic DWI and parameter maps suggest that the proposed method not only removes apparent noise but also effectively preserves the functional information contained in NEX1 image. The superiority of dNR for DTI metrics was observed even in the deep gray matter, which is considered to be superior to the previous research. 12
Furthermore, the results of tract analysis suggest that the functional information is retained not only within slices but also across slices, which further supports the effectiveness of the proposed method. On the other hand, ODI value in some regions showed negative results for dNR. The reason is not obvious and further improvement is desirable. However, the reproducibility of NODDI parameters was not evaluated in previous studies, so it is unclear whether the proposed method is inferior in this respect. Another limitation of this study is that it included only 10 healthy subjects. Further validation using larger data including patients is required.
Conclusion
The proposed method reduces the uncertainty problem of Deep Learning and has the potential to provide effective denoising.Acknowledgements
The research was supported by a Grant-in-Aid for Scientific Research (Kakenhi #17K10385, #18H02772) from the Japan Society for the Promotion of Science (JSPS) and Japanese Government , and by AMED (#JP19lk1010025h9902).
References
- Dong-Kyoon H, et al. Development and Application of a Deep Convolutional Neural Network Noise Reduction Algorithm for Diffusion-weighted Magnetic Resonance Imaging. Journal of Magnetics. 2019;24(2):223-229
- Youyong K, et al. Noise reduction of diffusion tensor images by sparse representation and dictionary learning. BioMed Eng OnLine . 2016;15:5
- Vladimir G, et al. q-Space Deep Learning: Twelve-Fold Shorter and Model-Free Diffusion MRI Scans. IEEE Transactions on Medical Imaging. 2016;35(5)
- Vegard A, et al. On instabilities of deep learning in image reconstruction and the potential costs of AI. PNAS. 2020;117(48):30088-30095
- Diederik P. Kingma, et al. Adam: A Method for Stochastic Optimization.2015
- Andrew L. Alexander, et al. Diffusion Tensor Imaging of the Brain. Neurotherapeutics . 2007;4(3):316-29
- Jens H. Jensen, et al. MRI Quantification of Non-Gaussian Water Diffusion by Kurtosis Analysis. NMR Biomed. 2010;23(7):698–710.
- Hui Zhang, et al. NODDI: Practical in vivo neurite orientation dispersion and density imaging of the human brain. Neuroimage.2012;61(4):1000-16.
- Fox RJ, et al. A Validation Study of Multicenter Diffusion Tensor Imaging: Reliability of Fractional Anisotropy and Diffusivity Values. American Journal of Neuroradiology. 2012;33(4);695-700.
- M Horbruegger, et al. Anatomically constrained tractography facilitates biologically plausible fiber reconstruction of the optic radiation in multiple sclerosis. Neuroimage Clin. 2019;22:101740.
- Turnier, J, et al. Improved probabilistic streamlines tractography by 2nd order integration over fibre orientation distributions. Proc. Intl. Soc. Mag. Reson. Med. 2010;18:1670
- Hajima S, et al. Deep Learning-based Noise Reduction for Fast Volume Diffusion Tensor Imaging: Assessing the Noise Reduction Effect and Reliability of Diffusion Metrics. Magn Reson Med Sci. 2020;18:doi:10.2463/mrms.tn.2020-0061.
Figures
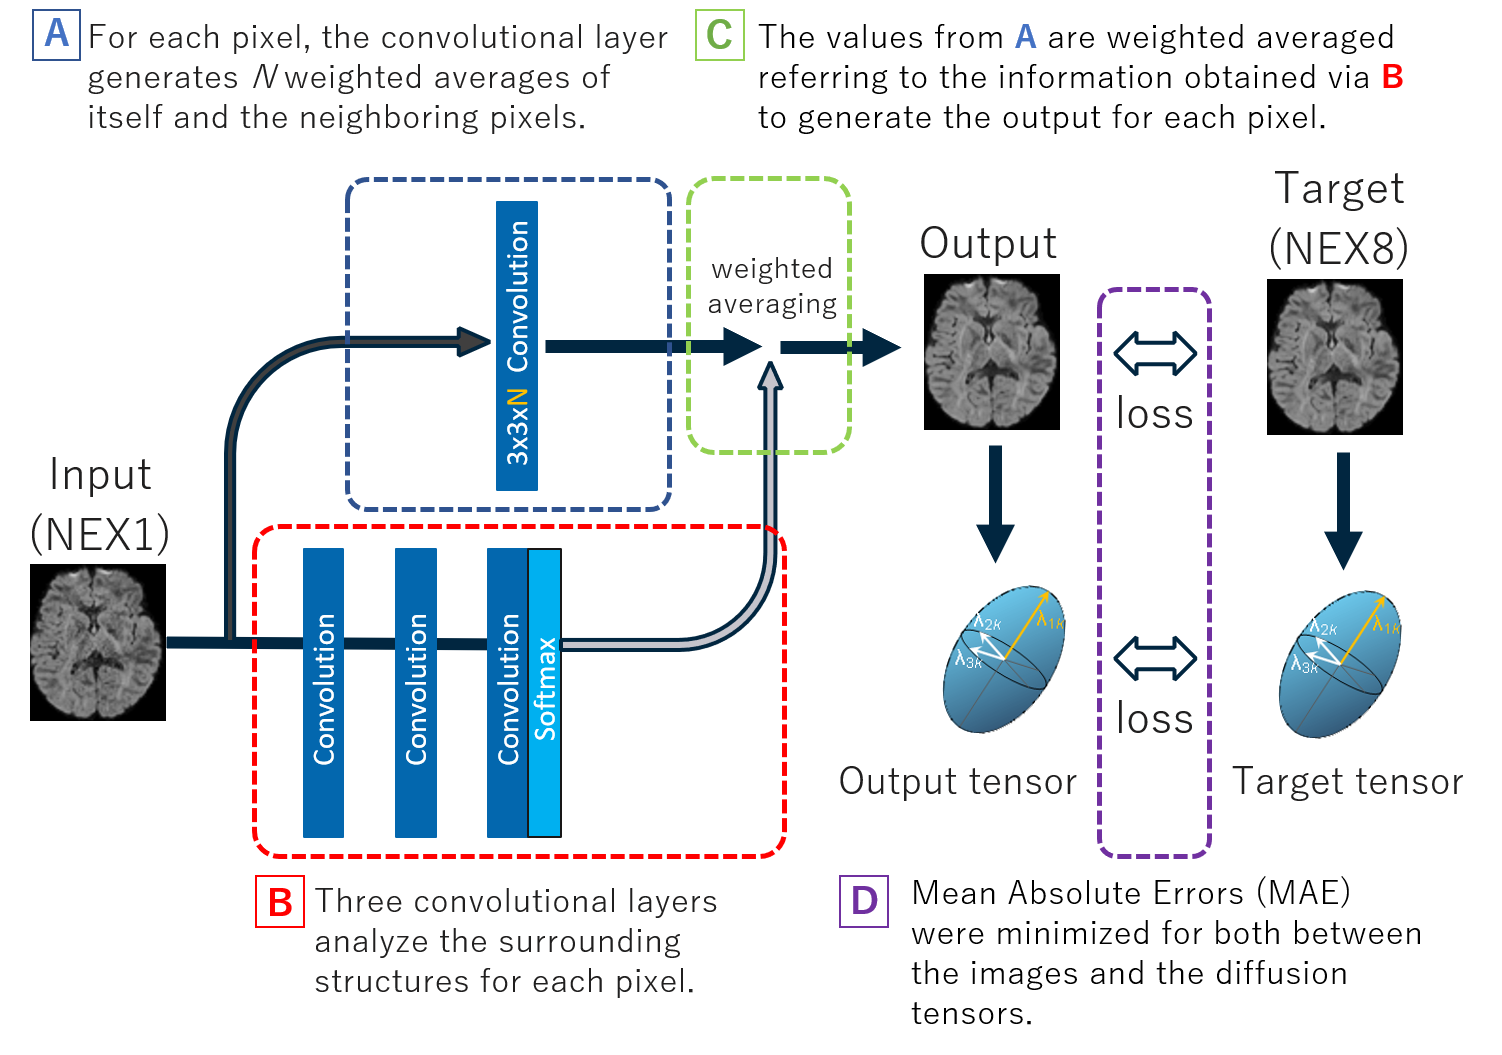
Figure 1. Outline of the neural network architecture.
The output value has small risk to become an outlier because it is generated by the combination of the weighted averages for the neighboring pixels in the original image. The loss to be minimized consists of both the mean absolute error between the output and the target images and the Euclid distance between the derived diffusion tensors for efficient optimization.
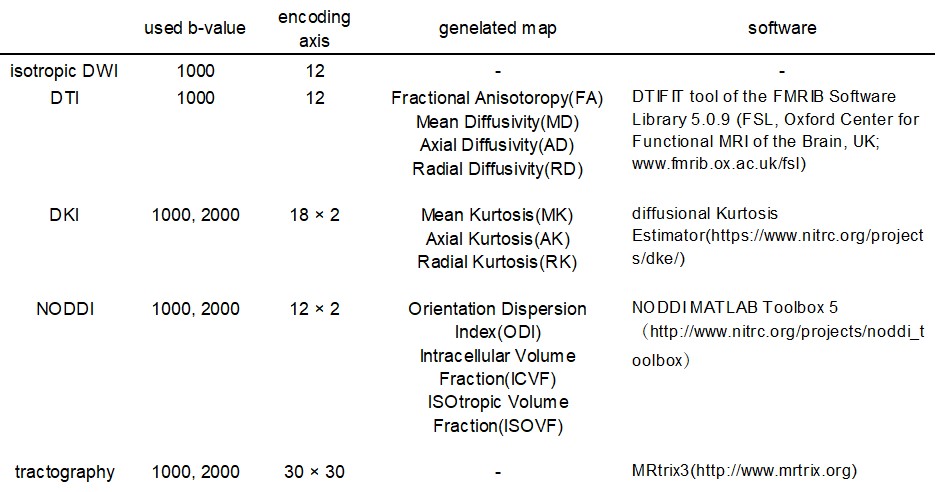
Figure 2. Summary of the methods to obtain isotropic DWI and the diffusional parameter maps.
The original data consisted of 30 diffusion encoding axes, but some of them were excluded evenly before generating the images to make situation similar to the clinic. The number of the remaining axes is indicated as encoding axes.
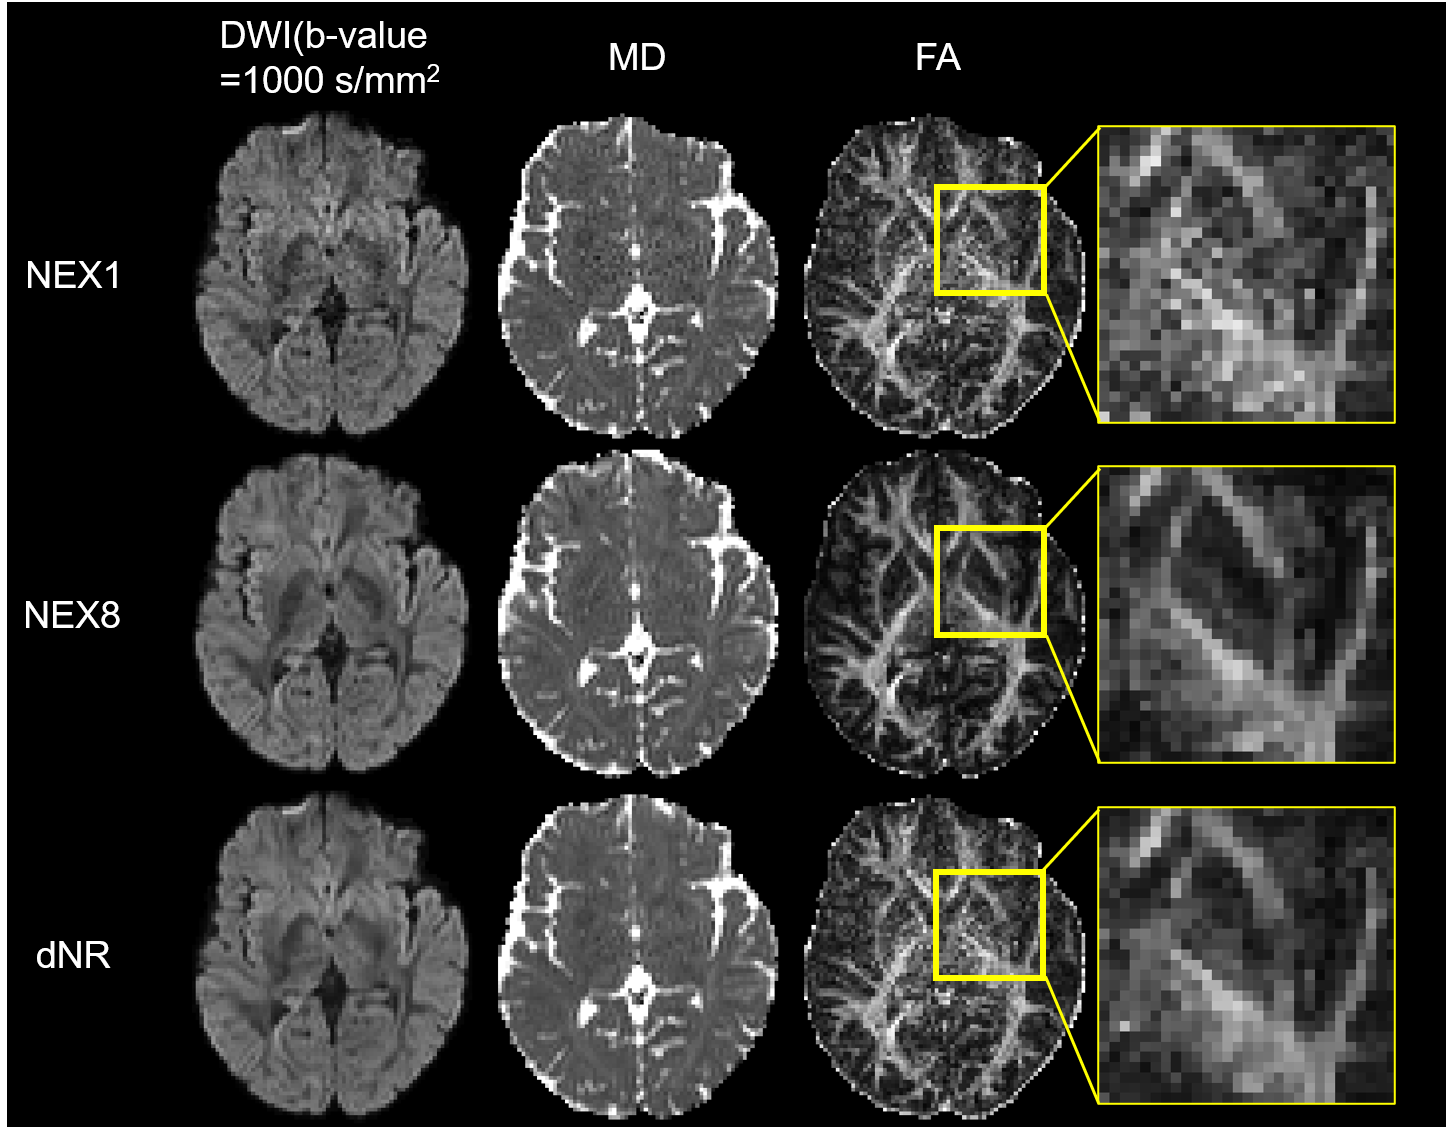
Figure 3. Visual comparison of the NEX1, NEX8, and dNR results.
The MD and FA maps are shown as representative parameter maps. Visually, dNR was less noisy than NEX1 in both DWI and parameter maps, and so the detailed anatomical structures were as visible as in NEX8. This advantage of dNR over NEX1 was obvious especially in around the center area of the brain.
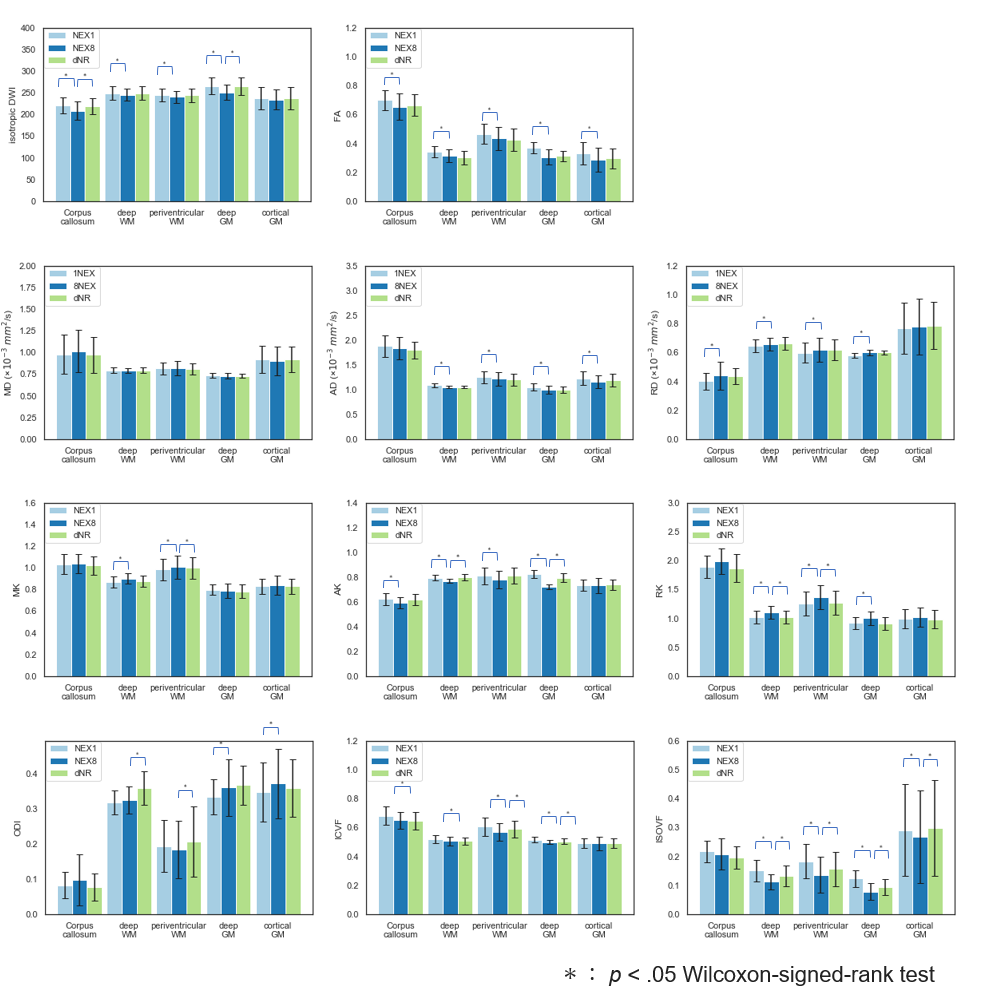
Figure 4. The results of the ROI-based analysis.
dNR was closer to NEX8 than NEX1 in most regions and parameter maps, and some significant differences between NEX1 and NEX8 were resolved in between dNR and NEX8. However, dNR was far from NEX8 than NEX1 in some combinations of the region and the parameter. Especially, in the regions of deep white matter and periventricular white matter in ODI, the difference compared to NEX8 was significant in dNR and not in NEX1.