2440
Deep learning based denoising for high b-value high resolution diffusion imaging1Medical Imaging Research center, Dayananda sagar college of engineering, Bangalore, India, 2Columbia University in the City of New York, Newyork, NY, United States, 3Department of Electronic and Communications, BMS Institute of Technology and Management, Bangalore, India
Synopsis
Deep learning based denoising can improve signal-to-noise ratio in high b-value diffusion imaging. Denoising CNN (DnCNN) model is trained with clean and simulated noisy patches of b=2000 s/mm2 DWI images from Openneuro database. We applied DnCNN to simulated noisy DWI and prospective DWI at b=2000 s/mm2.Unsharp masking used during testing to emphasize medium contrast details. Peak signal-to-noise ratio(>32dB) for simulated noisy DWI and image entropy(>7.17) for prospective DWI obtained after denoising. This denoising can be leveraged to shorten acquisition time by reducing the number of signal averages or increase resolution in through plane by acquiring with smaller slice thickness.
Introduction
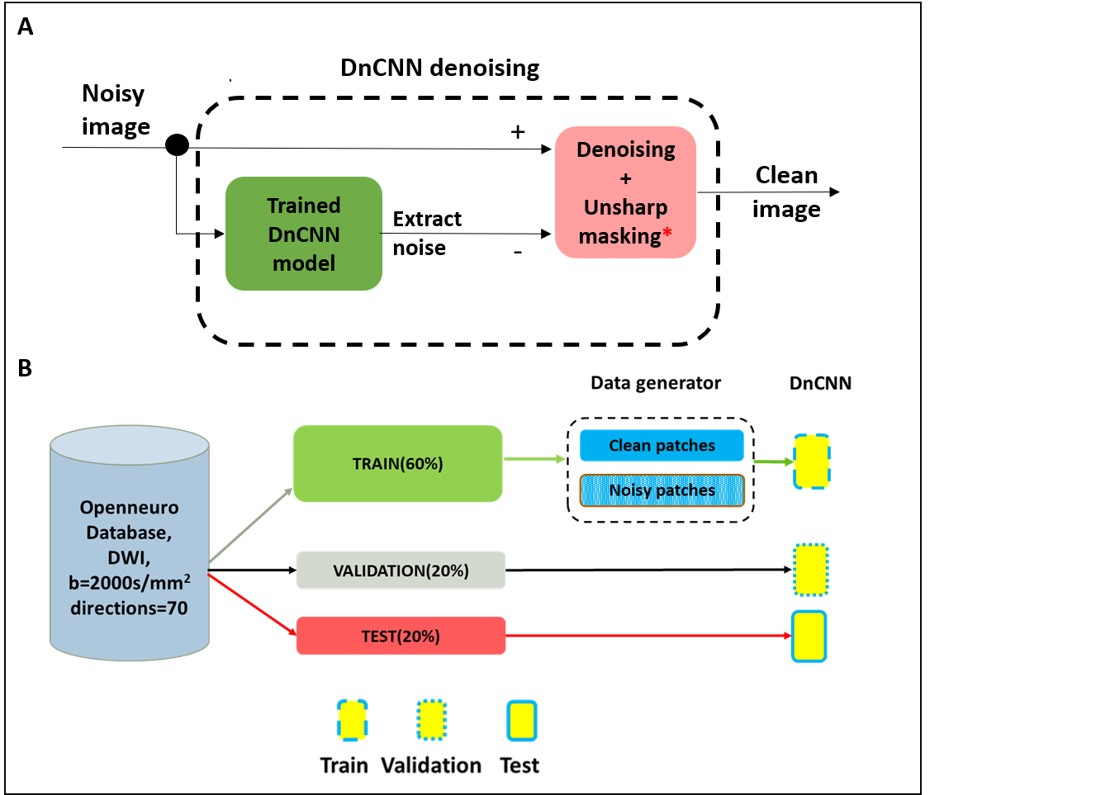
High b-value diffusion weighted image (DWI) provides good contrast, improved tissue diffusivity and less T2 shine-through effect. They often suffer from low signal-to-noise ratio (SNR) and rectified noise floor associated with the Rician noise affects low SNR regions(1). In this work, deep learning based denoising(DnCNN) combined with unsharp masking is used to denoise high b-value DWI (2,3). DnCNN uses residual learning to separate noise from the noisy input and a single residual unit is used to predict the residual image.Methods
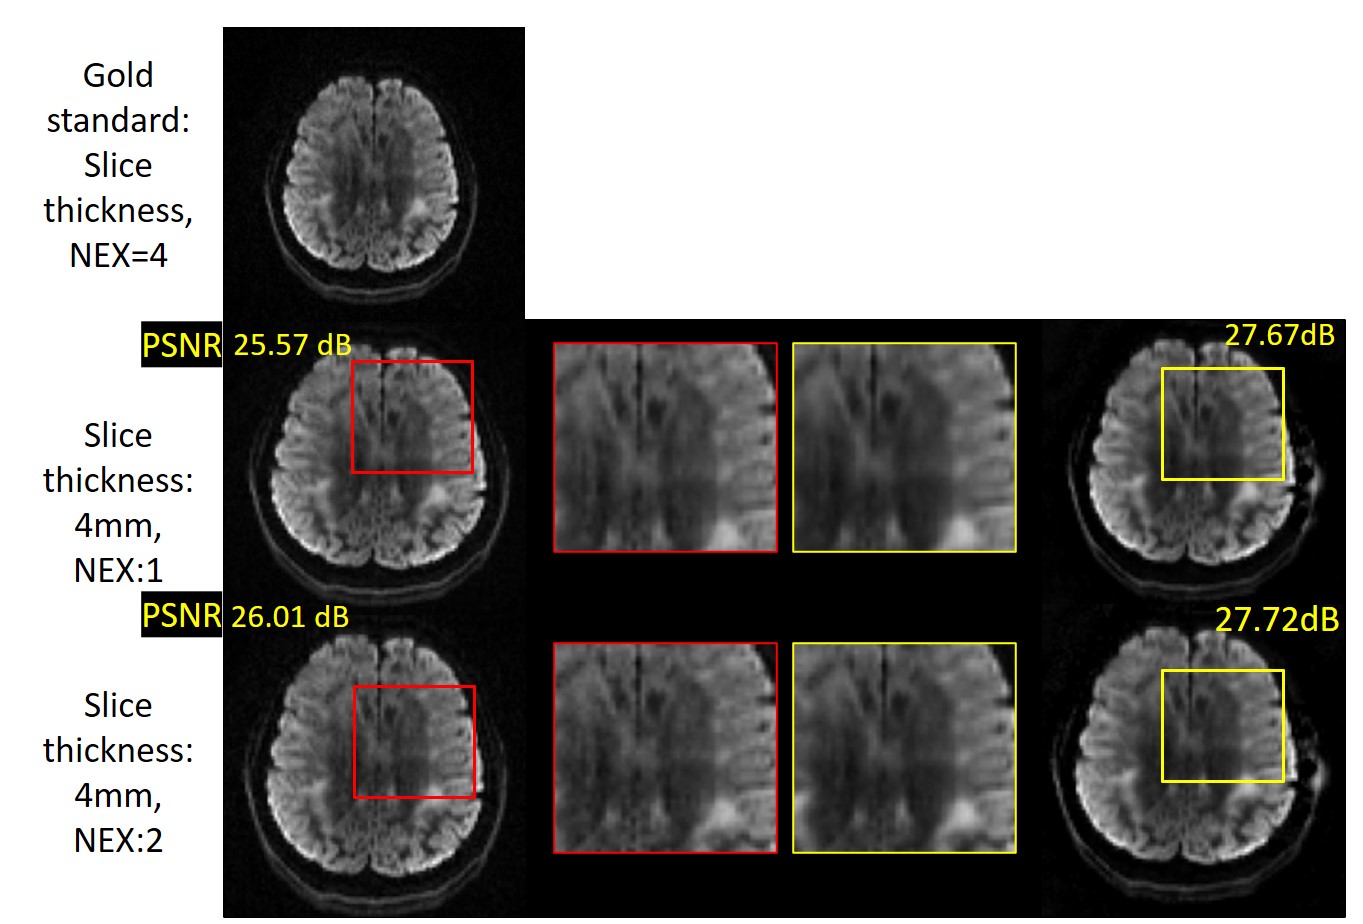
The data included 25 DWI with b=2000 s/mm2 ,60 directions,matrix size:128x104, slice thickness:2mm acquired on Siemens Magnetom Skyra 3T scanner taken from Openneuro public database(4). 60% of the total data were extracted to generate clean and noisy image patch pairs. Noisy patches were generated by adding Rician noise with known noise levels: σ=0.01, 0.03 and 0.05 respectively. Total 52560 clean and noisy image patches of size 40x40 were used for training DnCNN. DnCNN model in the current network can accept input of arbitrary size. The network architecture from ref. (2) was used. Linear unsharp masking was used to increase small scale acutance to emphasize texture and details of the denoised image(3). Training performance of the DnCNN model is visualized through training loss plots for each noise level. 20% of the total images were used for testing. Unsharp masking with a scaling factor of 0.5 was used only during the testing phase to sharpen denoised image. Peak signal-to-noise ratio(PSNR) was calculated for each noise level of the test image after denoising with respect to clean Openneuro DWI.Prospective DW images of a human volunteer were acquired on Siemens Magnetom Prisma 3T scanner at b=2000s/mm2 and six directions in axial plane with a slice thickness of 2mm and 4mm, a matrix size of 128 × 128, TR/TE: 7800/82ms. High b-value DWI acquired with NEX=1 and 2 were denoised using the DnCNN network. Experiment was repeated for two different slice thicknesses. The results were similar to the gold standard DW image of NEX=4 with 4mm slice thickness. Image entropy that reflects the detail in an image was calculated for test and denoised images of 2mm prospective DWI.Results and discussion
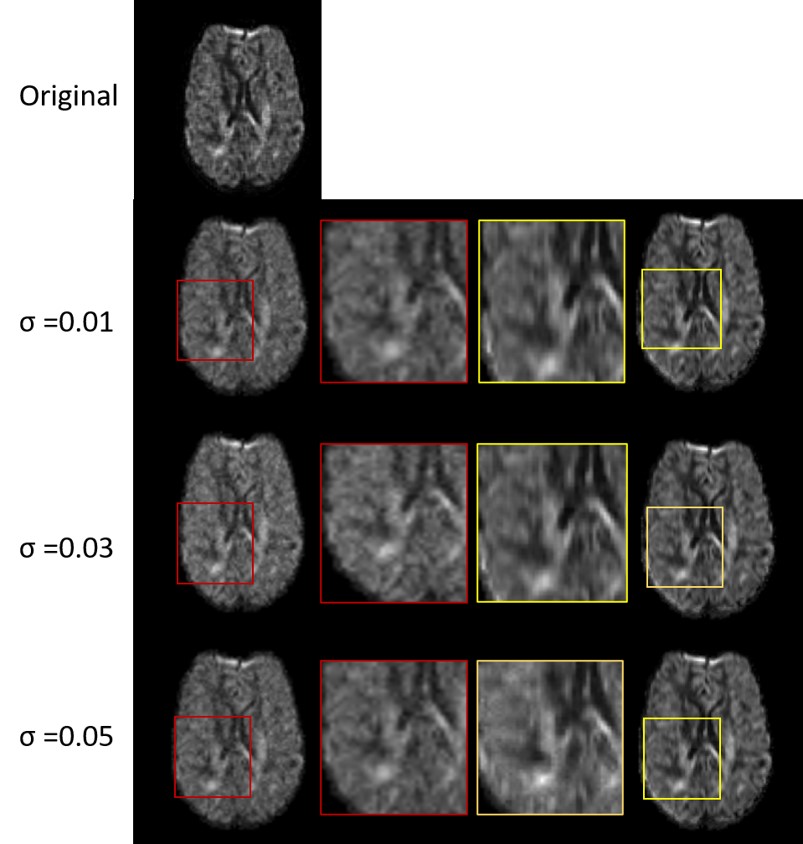
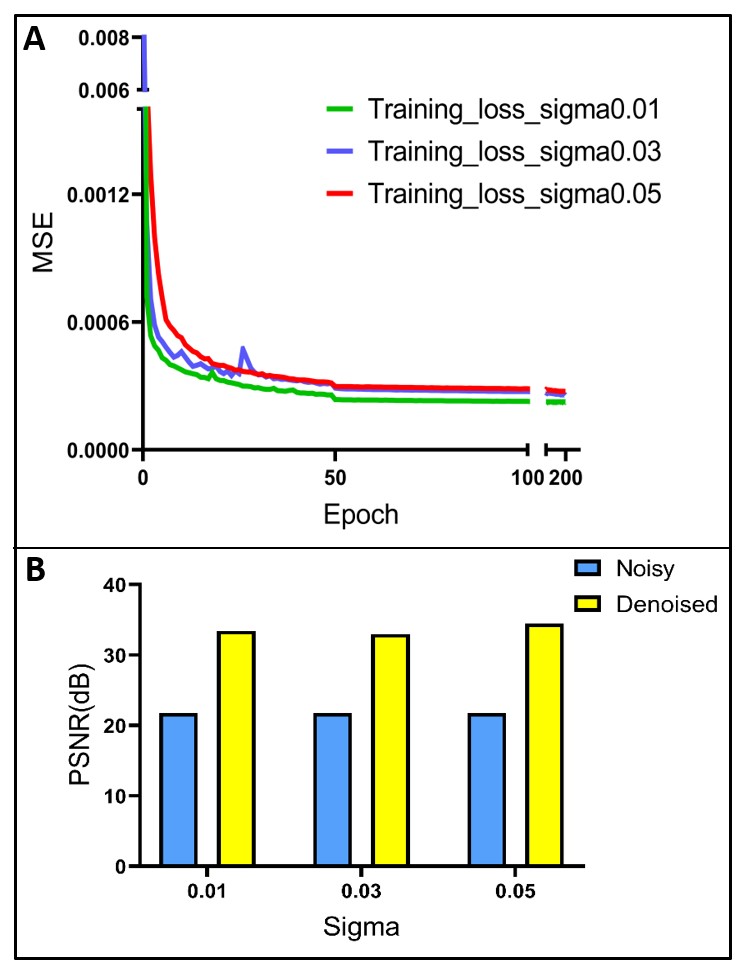
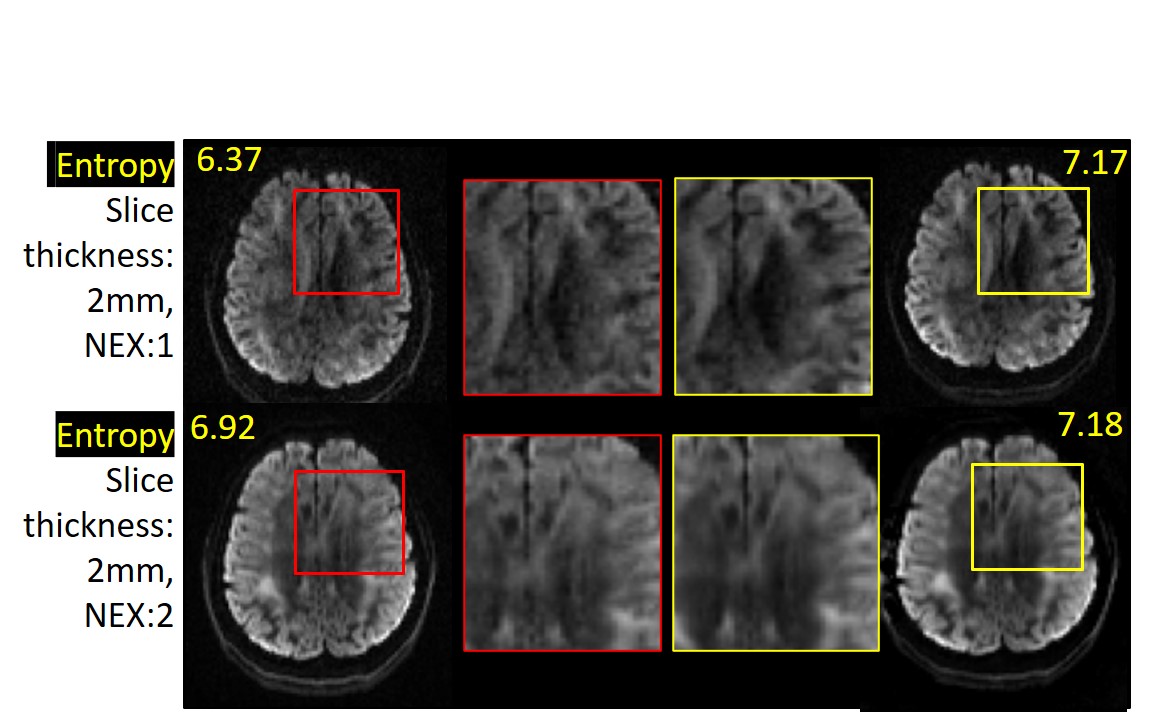
Figure 1A shows the workflow of DnCNN. Training, testing experiment design of DnCNN is shown in figure 1B. Effect of DnCNN denoising with Openneuro DWI data is shown in figure 2. Noisy and denoised image segments are magnified to visualize the significant changes after denoising. First and the last column displays input and denoised images at known noise levels. Figure 3A shows the loss curve during training, indicating high learning rate at different levels of noise. Figure 3B shows improved PSNR values in denoised images compared to their noisy counterparts. We see that the denoised images have increased PSNR as expected and increase with decrease in noise level. Figure 4 shows DnCNN performance on prospective DWI with slice thickness 4mm, NEX=1,2 and compared with gold standard DWI with NEX= 4 after denoising. Noisy & denoised parts are magnified (highlighted with red and yellow square respectively) in second & third columns. Significant noise reduction in NEX=1 & 2 images after denoising can be noted and are similar to gold standard image. Also denoised images have increased PSNR. Figure 5 illustrates denoising of 2mm prospective DWI. As the test image of slice thickness 2mm did not have gold standard reference, image entropy was calculated. An Increase in entropy values is seen after denoising as expected.Conclusion
The current work demonstrates denoising of high b-value prospective DWI and images taken from Openneuro database. Irrespective of slice thickness and signal averages, DnCNN denoising can reduce the noise level in the given input image to the level of clean reference image. This denoising can be leveraged to shorten acquisition time by reducing the number of signal averages or increase resolution in through plane by acquiring with smaller slice thicknessAcknowledgements
This study was funded (in part) by the Seed Grant Program for MR Studies of the Zuckerman Mind Brain Behavior Institute at Columbia University. This work was supported and performed at Zuckerman Mind Brain Behavior Institute MRI Platform, a shared resource.
References
1.Wang, et al., "High‐field mr diffusion‐weighted image denoising using a joint denoising convolutional neural network." Journal of Magnetic Resonance Imaging 50, no. 6 (2019): 1937-1947.
2. Zhang, et al. "Beyond a gaussian denoiser: Residual learning of deep cnn for image denoising." IEEE Transactions on Image Processing 26, no. 7 (2017): 3142-3155.
3. Bilcu,et al., "Constrained Unsharp Masking for Image Enhancement." Image and Signal Processing (2008): 10-19.
4. Gorgolewski et al.,"OpenNeuro—a free online platform for sharing and analysis of neuroimaging data." Organization for human brain mapping. Vancouver, Canada 1677, no. 2 (2017).
Figures