2435
Evaluation of Automated Brain Tumor Localization by Explainable Deep Learning Methods1Akershus University Hospital, Lørenskog, Norway, 2Department of Mathematics, University of Oslo, Oslo, Norway, 3Faculty of Medicine, Institute of Clinical Medicine, University of Oslo, Oslo, Norway
Synopsis
Machine learning approaches provide convenient autonomous object classification in medical imaging domains. This study uses an explainable method to evaluate the high-level features of deep learning methods in tumor localization.
INTRODUCTION
Artificial intelligence (AI) and deep learning-derived approaches provide convenient autonomous image classification in the medical domain. Understanding and explaining machine learning predictions can improve human-machine interaction and eventually translate these new medical imaging tools into clinical applications. This study aims to investigate an explainable method to evaluate the high-level features of deep convolutional neural network in predicting tumor lesions in the brain.METHODS
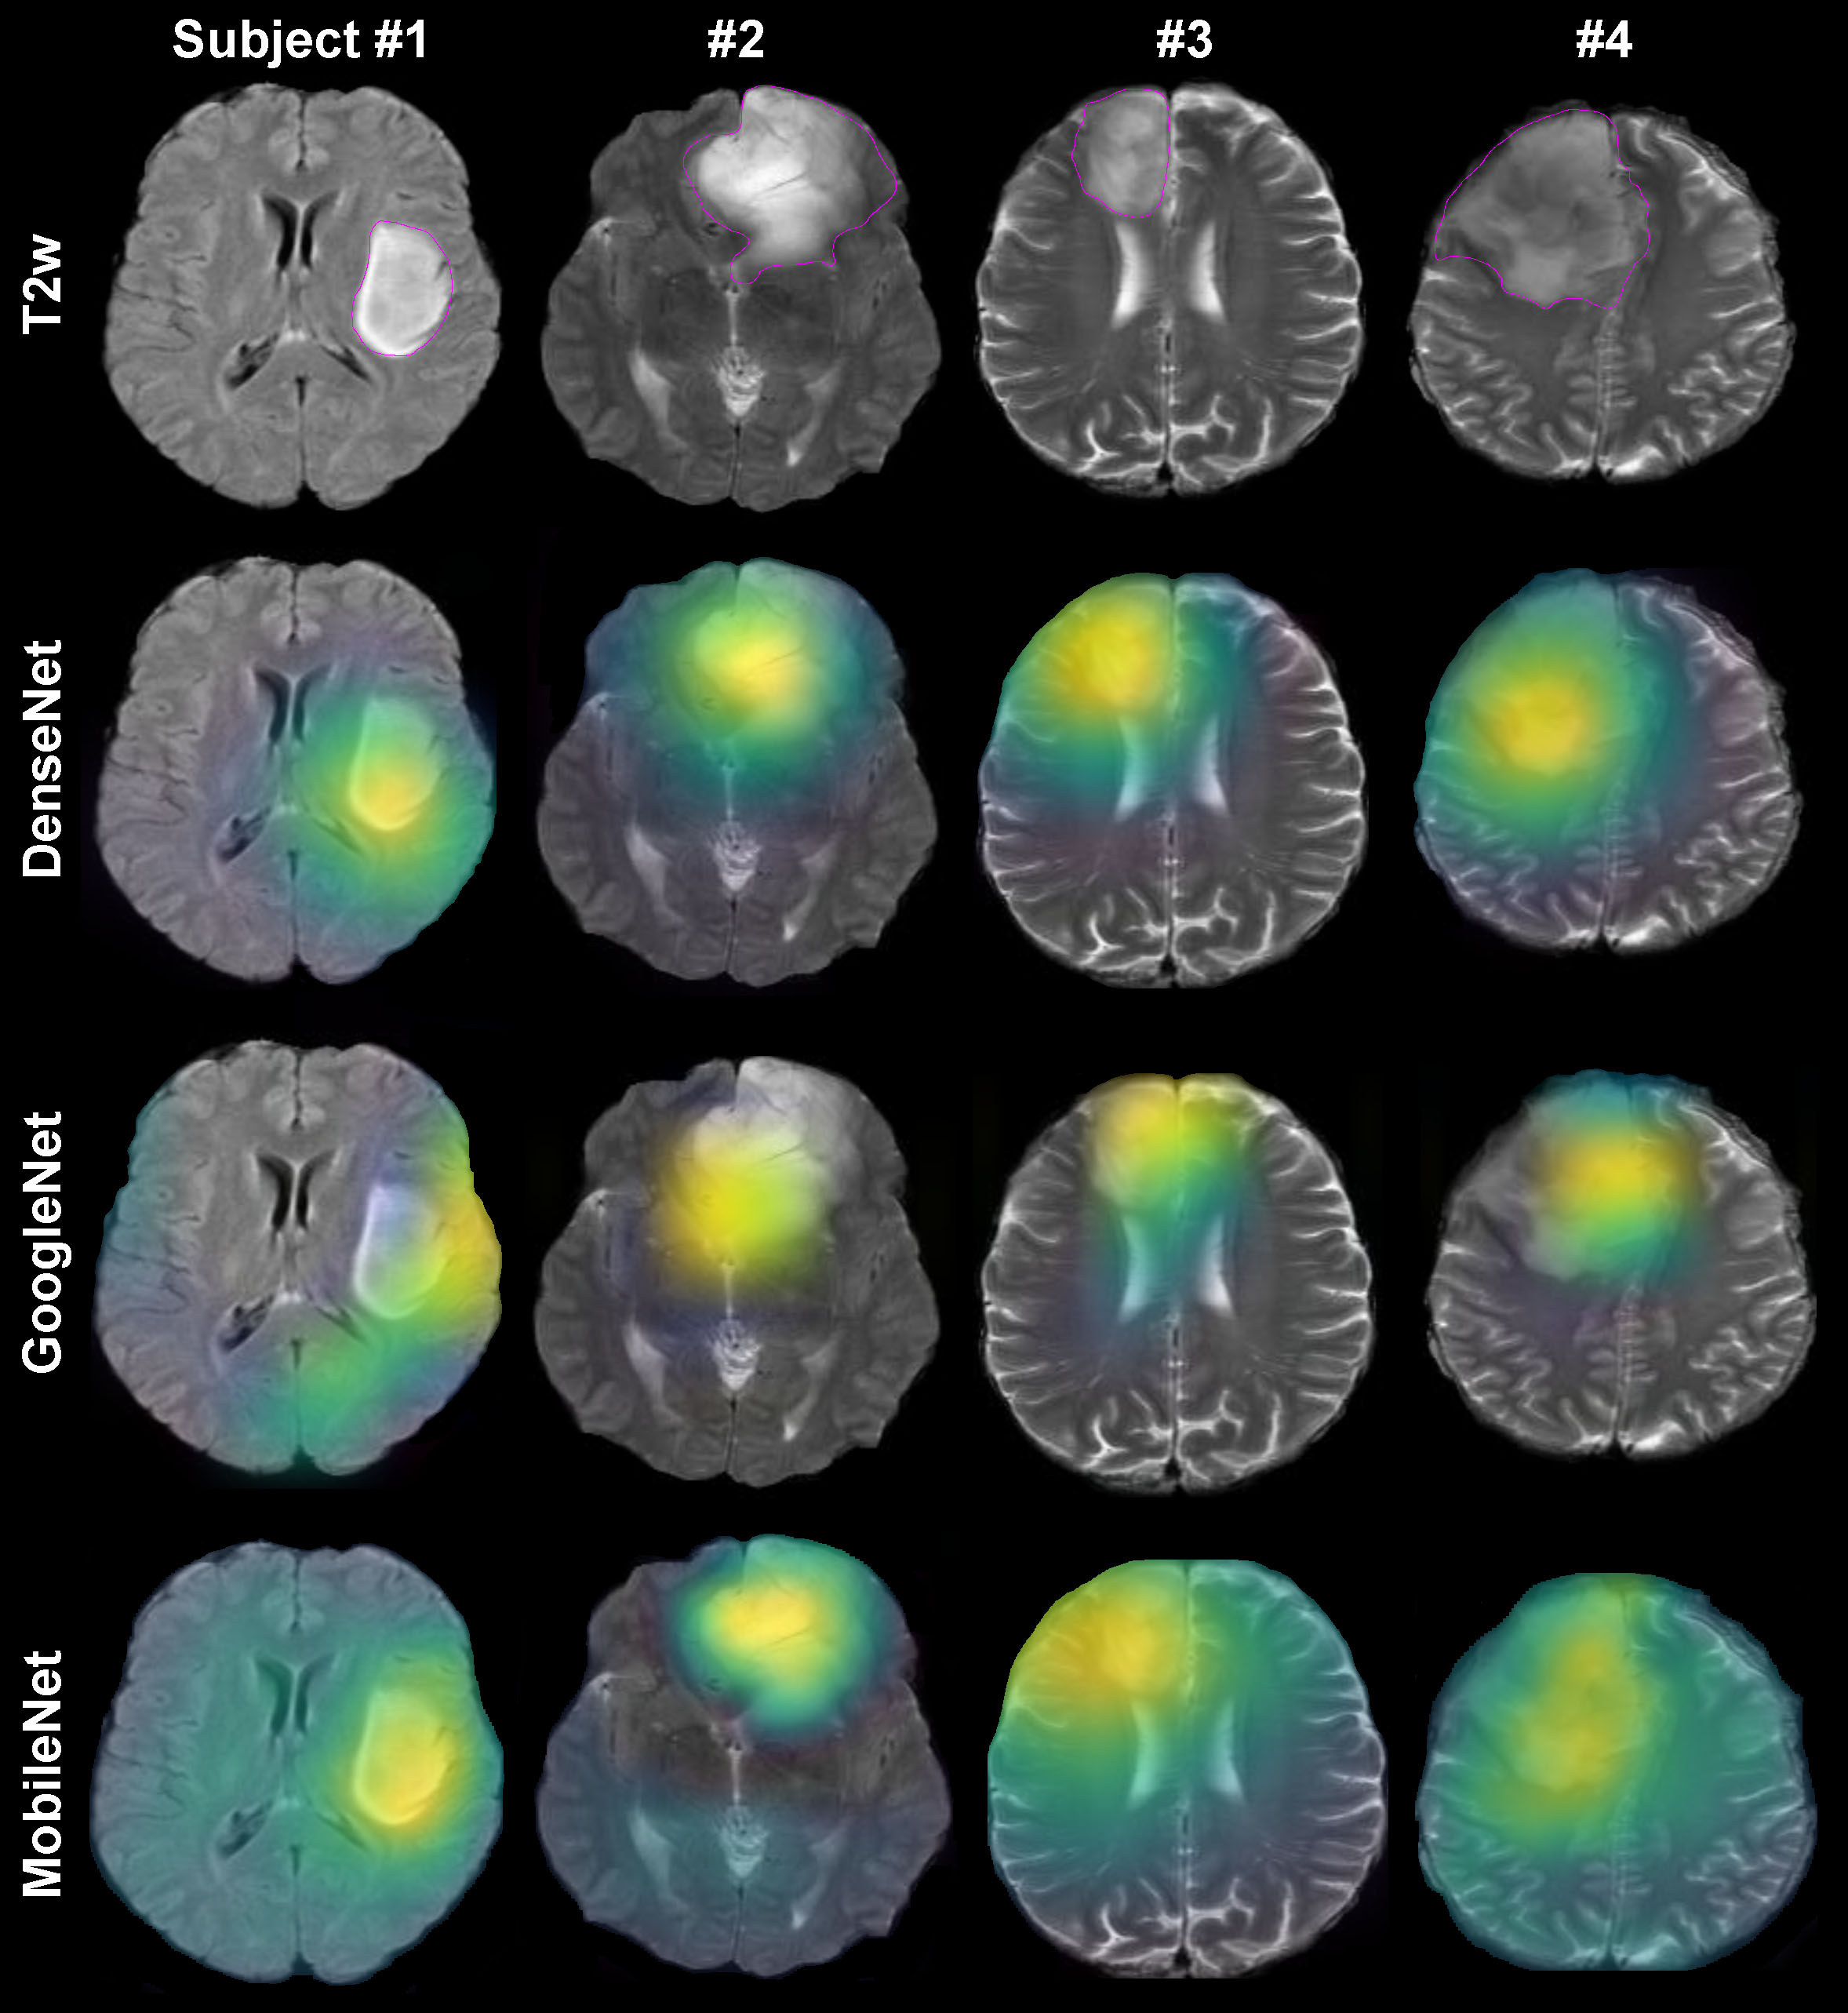
The experiments include TCGA dataset1 retrieved from The Cancer Imaging Archive repositories 2. With inclusion criteria of availability of both T2-weighted (T2w) and fluid attenuated inversion recovery (FLAIR) magnetic resonance (MR) images, we gathered MR data from 184 subjects. We analyzed axial slices of the T2w and FLAIR images following pre-processing steps: (i) N4BiasCorrection to remove RF inhomogeneity, (ii) intensity normalization, (iii) affine registration to MNI space, and (iv) resizing all images to the resolution of 256×256×128 using ANTs scripts 3. A total number of 13,600 and 9,100 brain images with and without tumor lesions, respectively, were prepared for training. We trained different AI networks with three-fold cross-validation by randomly shuffling imaging data for training, validation, and testing patches. Three identical groups with dataset distribution of 55%, 30%, and 15% for training, validation, and testing, respectively, were generated. Each fold of cross-validation and testing was a new training phase based on an identical combination of the three groups. We held out the testing fraction of the dataset from the in-training phase. Thus, the accuracy of models was calculated using the mean value of the network performance on only the testing dataset. The AI networks include DenseNet-121 4, GoogleNet 5, MobileNet 6. All models employed Adam optimizer with a learning rate of 5e – 4 with a decay rate of 0.9. The batch size and number of epochs were 25 and 100, respectively. All experiments were computed on a computer with two Intel Xeon Gold 5120 CPUs, 4 Nvidia GeForce RTX 2080Ti GPUs, and 128 GB of memory. We used the Grad-CAM algorithm to visualize each model's performance on tumor lesion localization 7. The Grad-CAM generates visual explanations of post-processed image space gradients to heatmaps. The overlap of the generated heatmaps and the tumor lesions in one testing group was used to estimate the localization accuracy as $$ %Acc = #hits / #total testing images $$, where #hits was determined as a successful overlap of >50% of pixels of the tumor mask with the Grad-CAM-derived heatmap. The mean difference between the computed localization accuracy of each model was compared using the Mann-Whitney test. Spearman correlation analysis was calculated to investigate relationships between the models’ prediction accuracy and tumor localization. The threshold for statistical significance was defined as P <.05.RESULTS
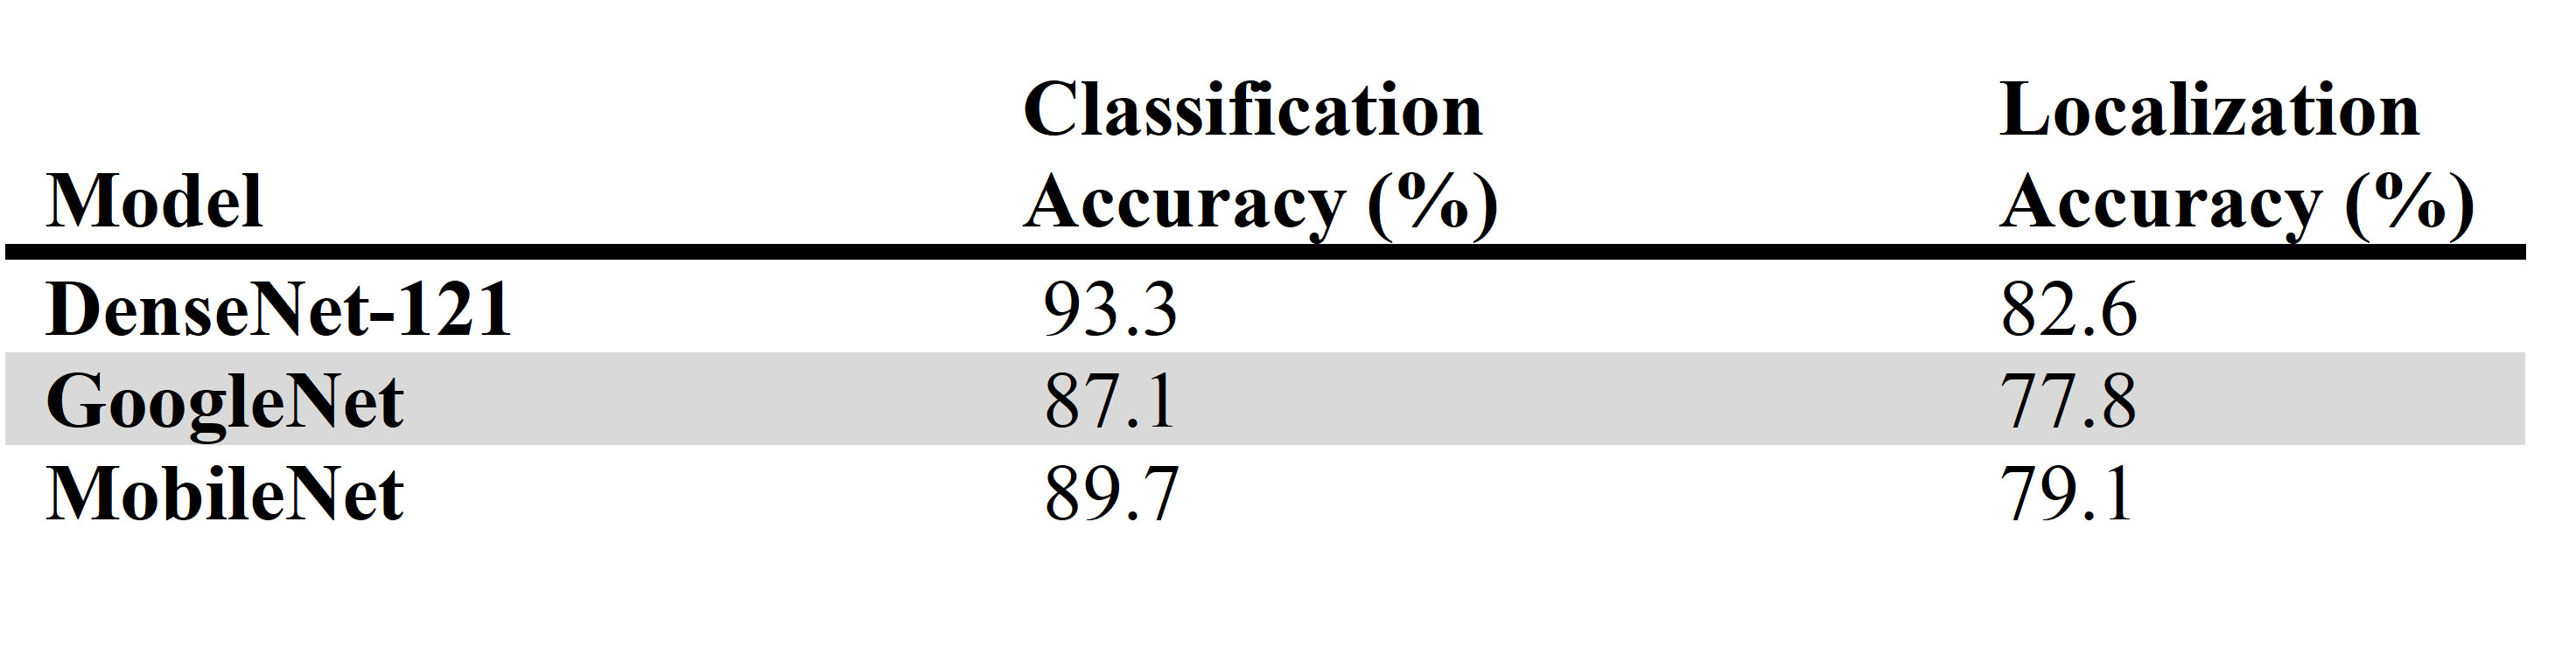
The DenseNet-121, GoogleNet, MobileNet achieved a mean cross-validated prediction accuracy of >87% on the testing dataset (Table 1). DenseNet-121 provided a significantly higher mean localization accuracy of 64% than GoogleNet (P =.01) and MobileNet (P =.02) (Fig. 1). The correlation analysis showed a significant agreement between the models’ prediction accuracy and their specificity in localizing tumor lesions (R =.46, P =.005)DISCUSSION
Our study demonstrated that the explainable-AI method could visualize the network’s performance, distinguishing the images with and without tumor based on the lesion's localization, rather than other features in the brain. The results indicated that the DenseNet-121 performed better than other models, providing more accurate tumor localization. In summary, the proposed training strategy may improve human-machine communication and may assist in selecting an optimal training scheme for clinical questions and AI learning progress.Acknowledgements
The results shown here are in whole or part based upon data generated by the TCGA Research Network: https://www.cancer.gov/tcga. Authors recognize the contribution of the appropriate specimen donors and research groups. This work was supported by funding from Helse Sør-Øst RHF – Southern Eastern Norway Regional Health Authority grant 2018047.References
1. Cancer Genome Atlas Research N, Brat DJ, Verhaak RG, et al. Comprehensive, Integrative Genomic Analysis of Diffuse Lower-Grade Gliomas. N Engl J Med. 2015;372(26):2481-2498.
2. Clark K, Vendt B, Smith K, et al. The Cancer Imaging Archive (TCIA): maintaining and operating a public information repository. J Digit Imaging. 2013;26(6):1045-1057.
3. Esmaeili M, Stensjoen AL, Berntsen EM, Solheim O, Reinertsen I. The Direction of Tumour Growth in Glioblastoma Patients. Sci Rep. 2018;8(1):1199.
4. Huang G, Liu Z, Maaten Lvd, Weinberger KQ. Densely Connected Convolutional Networks. arXiv. 2016.
5. Szegedy C, Liu W, Jia Y, et al. Going Deeper with Convolutions. arXiv. 2014.
6. Howard AG, Zhu M, Chen B, et al. MobileNets: Efficient Convolutional Neural Networks for Mobile Vision Applications. arXiv. 2017.
7. R. SR, Michael C, Abhishek D, Ramakrishna V, Devi P, Dhruv B. Grad-CAM: Visual Explanations from Deep Networks via Gradient-Based Localization. International Journal of Computer Vision. 2019;128.
Figures