2430
Multi-sequence and multi-regional background segmentation on multi-centric DSC and DCE MRI using deep learning1Department of Research & Innovation, Olea Medical, La Ciotat, France, 2Clinical Program Department, Olea Medical, La Ciotat, France, 3Avicenna.ai, La Ciotat, France
Synopsis
In this study, we present an automatic, multi-regional and multi-sequence deep-learning-based algorithm for background segmentation on both DSC and DCE images which consisted of a 2D U-net trained with a large multi-centric and multi-vendor database including DSC brain, DCE brain, DCE breast, DCE abdomen and DCE pelvis data. Cross-validation-based training results showed an overall good performance of the proposed algorithm with a median Dice score of 0.974 in test set and 0.979 over all datasets, and a median inference duration of 0.15s per volume on GPU. This is the first reported deep-learning-based multi-sequence and multi-regional background segmentation on MRI data.
Introduction
Dynamic Susceptibility Contrast (DSC) and Dynamic Contrast Enhanced (DCE) are MRI perfusion techniques that rely on the administration of exogenous and intravascular gadolinium-based contrast agent, and are commonly-used in clinical imaging protocols of pathologies such as brain tumors and stroke1–4. Given the clinical context and as a diagnostic helper tool, the dedicated post-processing solutions should not only be robust and reproducible but must also be fast.Background segmentation (BS) and removal is therefore a highly crucial post-processing step that allows focusing only on the anatomical region of interest for the subsequent computation of parametric maps, especially for high resolution acquisitions, as it is usually the case for DCE data. Furthermore, being able to perform BS for data from different MR sequences and from several anatomical regions with a single algorithm would be of great interest both in terms of memory and product architecture efficiency.
Therefore, in this project, we wanted to evaluate whether a single convolutional neural network (CNN) model would be able to perform this task on both DSC and DCE images from several anatomical regions including brain, breast, abdomen, and pelvis, and with what level of efficiency.
Methods
For the training dataset, described in Table 1, a total of 327 cases were extracted from an in-house multi-centric and multi-vendor database collected from collaborating hospitals and clinical centers. For all cases, mask phase, arterial phase and delayed (last) phase were extracted to evaluate the effect of temporal dimension features on the segmentation performance. Each 3D volume is then manually segmented as background/not background. This labelization stage was performed using ITK-Snap5 by six users with extensive experience in medical images, then all segmentations were examined and manually-corrected when necessary by one user with 5-year experience in MR images post-processing and segmentation. The entire database, constituted of 981 3D volumes, was then randomly divided into train set (60%), validation set (20%) and test set (20%) in a five-fold cross-validation manner. Manual segmentations were used as ground truth for the training.Given the enormous computational resources and longer computation time reported for 3D U-Net as compared to 2D, the deep-learning segmentation was performed using a 2D U-Net6 CNN model with roughly 9.8 million parameters and consisting of convolutional layers with batch normalization and ReLU activations during the encoding part and convolutional and up-sampling layers during the decoding part. The framework was evaluated with three metrics7,8: Dice Similarity Coefficient (Dice), Jaccard Similarity Index (Jaccard) and Adjusted Mutual Information (AMI). Visual inspection of the obtained segmentations was also performed using a 3-scores grading: perfect segmentation, acceptable (i.e. with false negative voxels in background, but no clinical impact) and not acceptable (i.e. with false positive voxels in foreground, thus with clinical impact).
A database of 375 additional cases including 246 brain DSC data and 129 DCE breast data was collected afterwards and the resulting 1125 3D volumes were used as additional testing dataset for the model. Only a visual inspection was performed on these new cases.
Results
The U-net-based BS yielded overall high performance both in terms of quantitative metrics and visual inspection. Indeed, the median and range values of Dice, Jaccard and AMI on the training database are respectively 0.979 [0.458–0.998], 0.985 [0.838–0.999], 0.878 [0.324–0.985]. The detailed performance assessment for the different sequences and anatomical regions is presented in Fig 1.Also shown in Fig 1, the segmentations' visual analysis exhibited excellent performances of the model with 95.5% of all cases exhibiting perfect segmentation, 4.31% acceptable and 0.21% not acceptable. Illustrations of the obtained segmentations are shown in Fig 2.
Regarding the additional testing database, the visual inspection also exhibited good results with 88% of all segmentations being perfect, 8% acceptable and 3% not acceptable, as shown in Fig 3.
Discussion
To our knowledge, this is the first study reporting the use of a U-Net-based approach to perform a BS on such a large spectrum of data with multi-sequence (DSC and DCE), multiple anatomical regions and multi-centric database. Overall results showed that the 2D U-net model exhibited good performances not only on the training database, but also on an additional database collected from different acquisition centers. Further optimizations, including a comparison to a 3D U-Net model, should be conducted to confirm and improve these performances. The median ([range]) inference duration on all data (see Fig.4) was 0.15 [0.05-2] seconds per 3D volume on a modern GPU whilst the BS process overall reduced the number of voxels to account for in subsequent metrics computations by at least 1/3. Regarding the effect of temporal dimension in these dynamic acquisitions, we did not find any significant difference in the model performance between the 3 considered phases.Conclusion
This study demonstrated the feasibility of using a deep learning model to perform background segmentation on both DSC and DCE data from several anatomical regions and with different MR scanning protocols and spatial resolutions. With high performances and a short inference duration, and after further tests on data from other anatomical regions, particularly in abdomen and pelvis, the current model could be of great interest for post-processing solutions, especially in clinical contexts.Acknowledgements
The authors would like to thank for following collaborators from Olea Medical for their help and support on the manual segmentation task: Aurélia HERMOSO, Dorian RAGUENES, Emmanuelle JOUAN, Manon SCHOTT, Manon TOUMELIN and Oussama OUADA.References
- Bergamino M, Bonzano L, Levrero F, Mancardi GL, Roccatagliata L. A review of technical aspects of T1-weighted dynamic contrast-enhanced magnetic resonance imaging (DCE-MRI) in human brain tumors. Phys Medica. 2014;30(6):635-643. doi:10.1016/j.ejmp.2014.04.005 SMASH
- Heye AK, Culling RD, Valdés Hernández MDC, Thrippleton MJ, Wardlaw JM. Assessment of blood-brain barrier disruption using dynamic contrast-enhanced MRI. A systematic review. NeuroImage Clin. 2014;6:262-274. doi:10.1016/j.nicl.2014.09.002 SMASH
- Copen WA, Schaefer PW, Wu O. MR Perfusion Imaging in Acute Ischemic Stroke. Neuroimaging Clin N Am. 2011;21(2):259-283. doi:10.1016/j.nic.2011.02.007 SMASH
- Schellinger PD, Bryan RN, Caplan LR, et al. Evidence-based guideline: The role of diffusion and perfusion MRI for the diagnosis of acute ischemic stroke: Report of the therapeutics and technology assessment subcommittee of the american academy of neurology. Neurology. 2010;75(2):177-185. doi:10.1212/WNL.0b013e3181e7c9dd SMASH
- Yushkevich PA, Gao Y, Gerig G. ITK-SNAP: An interactive tool for semi-automatic segmentation of multi-modality biomedical images. In: Proceedings of the Annual International Conference of the IEEE Engineering in Medicine and Biology Society, EMBS. Vol 2016-October. Institute of Electrical and Electronics Engineers Inc.; 2016:3342-3345. doi:10.1109/EMBC.2016.7591443 SMASH
- Ronneberger O, Fischer P, Brox T. U-net: Convolutional networks for biomedical image segmentation. In: Lecture Notes in Computer Science (Including Subseries Lecture Notes in Artificial Intelligence and Lecture Notes in Bioinformatics). Vol 9351. Springer Verlag; 2015:234-241. doi:10.1007/978-3-319-24574-4_28 SMASH
- Taha AA, Hanbury A. Metrics for evaluating 3D medical image segmentation: Analysis, selection, and tool. BMC Med Imaging. 2015;15(1):1-28. doi:10.1186/s12880-015-0068-x SMASH
- Crum WR, Camara O, Hill DLG. Generalized overlap measures for evaluation and validation in medical image analysis. IEEE Trans Med Imaging. 2006;25(11):1451-1461. doi:10.1109/TMI.2006.880587 SMASH
Figures

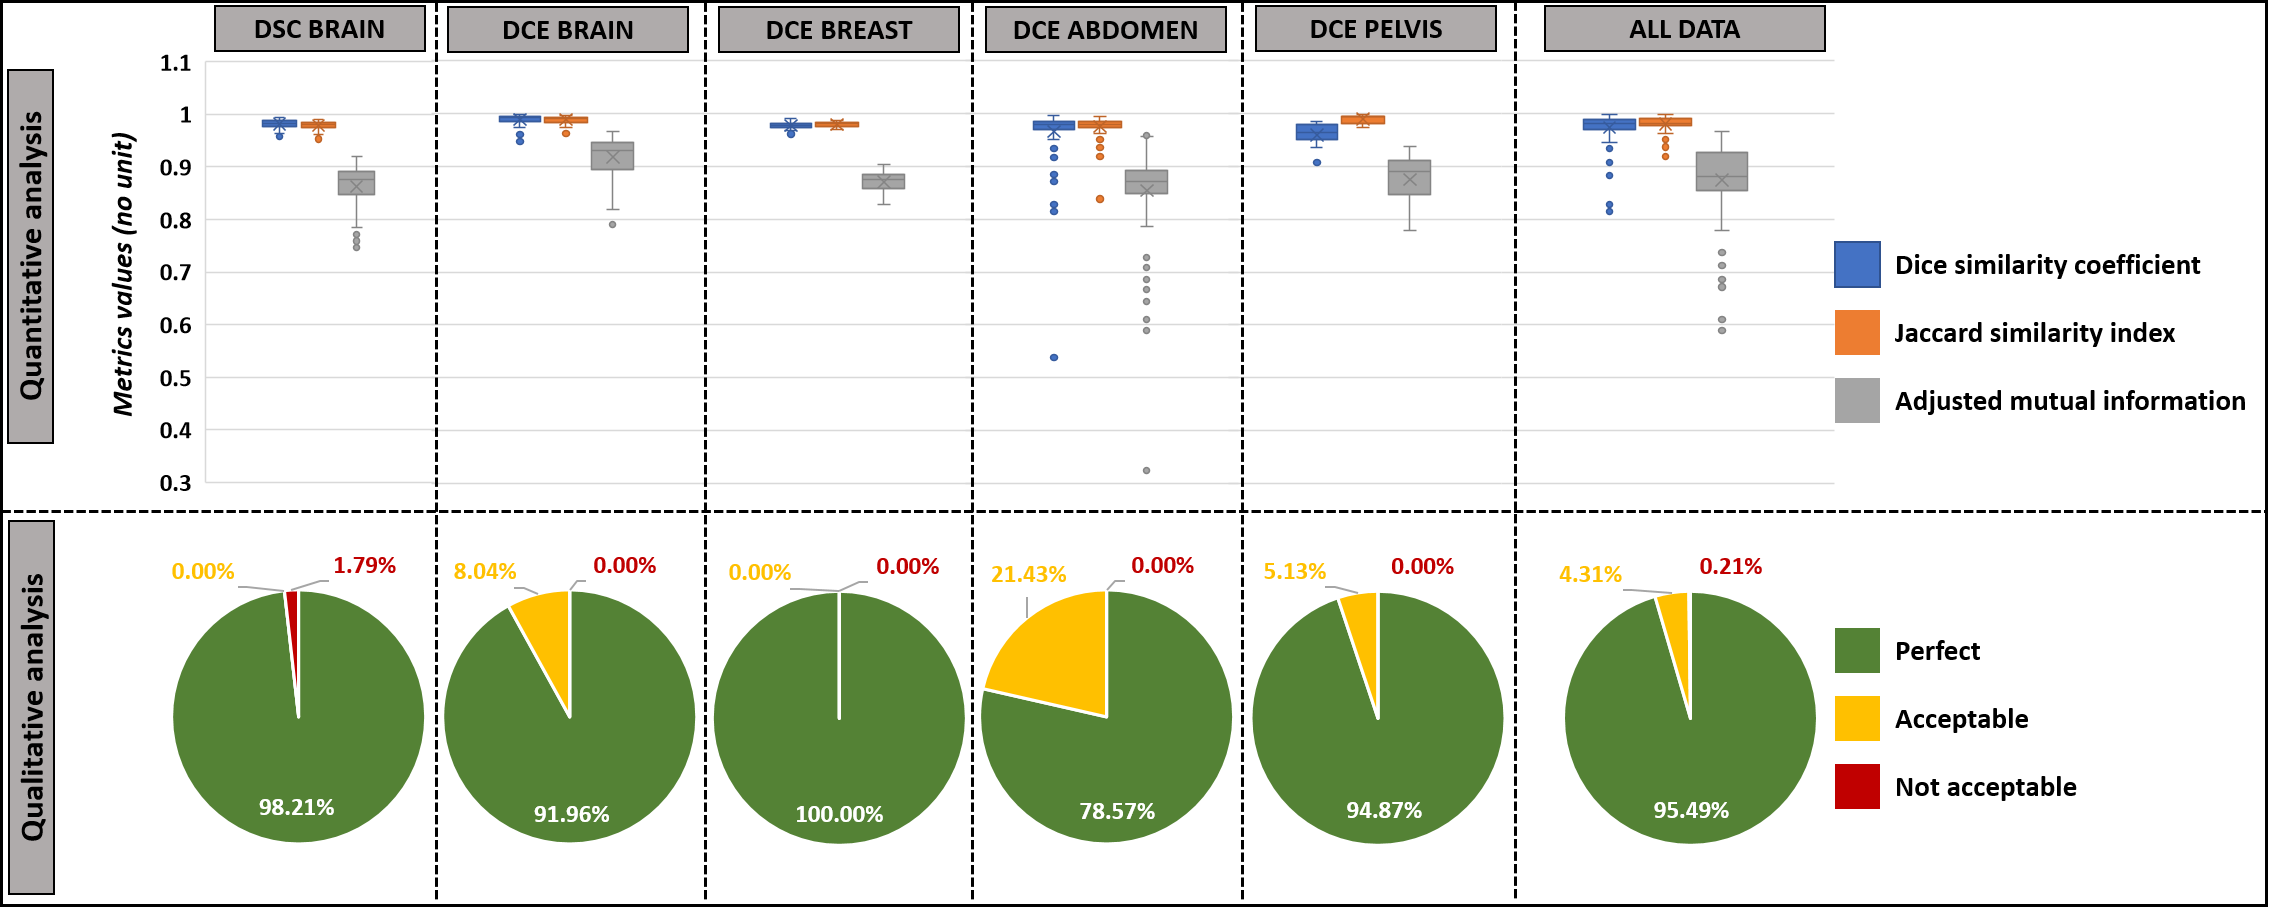
Figure 1: Background segmentation performances in the development database.
Top: Quantitative results with values of Dice coefficient (Dice), Jaccard similarity index (Jaccard), and adjusted mutual information (AMI). Dice and Jaccard values range between [0-1], 1 means the two segmentations are identical. AMI values are <=1, 1 means the two clusters are identical.
Bottom: Qualitative (visual) evaluation of obtained segmentations with 3-stage rating: perfect, acceptable (i.e. without tissue voxels removed) and not acceptable (i.e. with tissue voxels removed) results.

Figure 2: Illustrations of background segmentation results for the development database.
The columns display segmented slices per modality and anatomical region, whereas the rows correspond to the 3 different visual quality ratings (Perfect, Acceptable, Not acceptable). Dice, Jaccard and AMI values for the 3D volume are reported under each slice. Only two DSC brain volumes segmentations were found not acceptable.Their segmentations are displayed with transparency to show the underlying tissue.

Figure 3: Illustrations of background segmentation results for the additional database.
- (A) Example of segmented slices for DSC brain and DCE Breast datasets. The row corresponds to the 3-stage visual rating (Perfect, acceptable, and not acceptable). Red voxels correspond to the segmented background.
- (B) Pie charts illustrating the segmentations visual performances over all DSC brain data (top chart), all DCE Breast data (middle chart) and all the additional database (bottom chart).
