2427
Multi-contrast CS reconstruction using data-driven and model-based deep neural networks1Institute of Applied Physics, University of Tsukuba, Tsukuba, Japan, 2Department of Radiology, University of Yamanashi, Chuo, Japan, 3Department of Radiology, Kofu-Kyoritsu Hospital, Kofu, Japan
Synopsis
The use of deep learning (DL) for compressed sensing (CS) have recently received increased attention. Generally, DL-CS uses single-contrast CS reconstruction (SCCS) where the single-contrast image is used as the network input. However, in clinical routine examinations, different contrast images are acquired in the same session, and CS reconstruction using multi-contrast images as the input (MCCS) has the potential to show better performance. Here, we applied DL-MCCS to brain MRI images acquired during routine examinations. We trained data-driven and model-based networks, and showed that for both cases, MCCS outperformed SCCS.
INTRODUCTION
Deep-learning-based compressed sensing (DL-CS1) has recently been studied in great progress. In general, DL-CS often uses single-contrast CS (SCCS) reconstruction, where input and output images for a neural network have the same contrast. However, multiple contrasts are acquired in clinical routine examination, and the use of multi-contrast images for the network input would give much better performance. Although this concept has been applied to non-DL CS2, only a few studies focused on the application to DL-based MCCS. In this study, we evaluated the performance of DL-MCCS reconstruction for clinical brain images. We used a model-based and data-driven networks for DL-MCCS and evaluated the image quality and diagnostic performance, in comparison with DL-SCCS. The FLAIR/T1W/T2W images, which are widely used in clinical brain routine examination, were used as input, and FLAIR and T1WI were reconstructed using the DL-MCCS networks. We showed that DL-MCCS outperformed DL-SCCS.METHOD
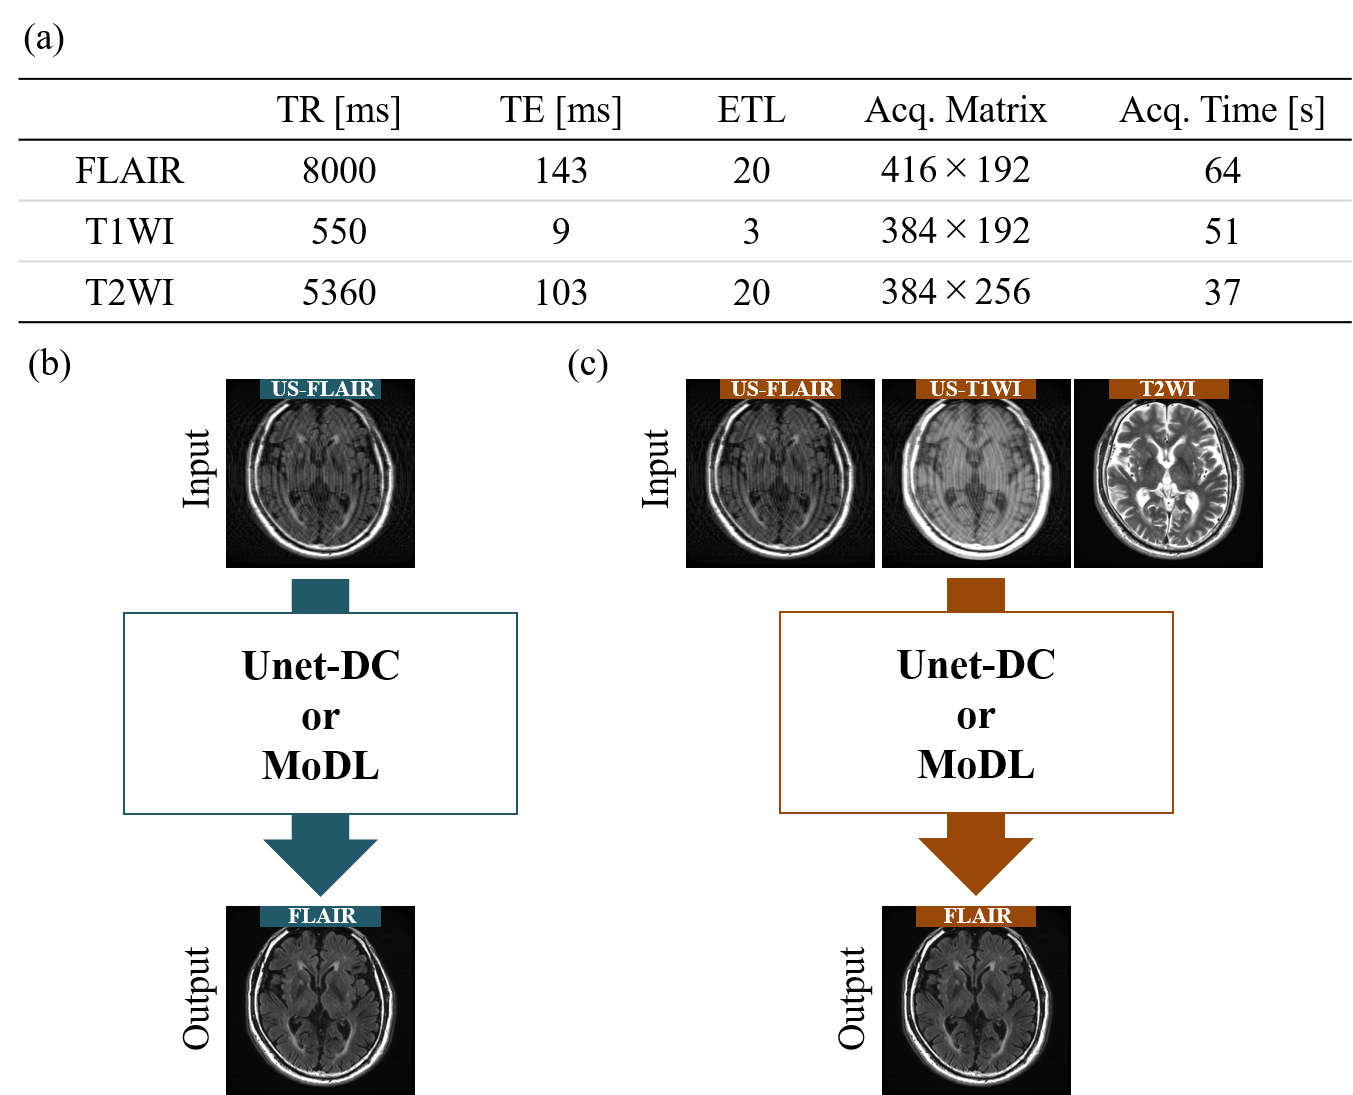
Image acquisitionFLAIR/T1W/T2W images were acquired using a 3.0-T (GE Healthcare, SIGNA Premier) (Fig. 1(a)). 3083 images from 122 patients were used for training (2466 images) and validation (617 images), and 604 images from 23 patients were used for testing. Retrospectively undersampled images of FLAIR and T1WI (US-FLAIR/US-T1WI) were used as network input. Although both FLAIR and TIWI were CS-reconstructed, here we only showed the results for FLAIR-CS, because of the limited space available. The acceleration factors (AFs) were 2 and 2.6.
Networks
For SCCS, FLAIR was reconstructed from US-FLAIR (Fig. 1(b)). For MCCS, FLAIR was reconstructed from US-FLAIR/US-T1WI/T2WI (Fig. 1(c)). We used two typical networks known as data-driven and model-based networks. The data-driven network consisted of Unet with a skip connection and data consistency (DC) layers (Unet-DC)3. The training parameters were epoch = 400 and batch size = 32. The model-based network (MoDL)4 consisted of a convolutional network (CNN) and DC layers, merges model-based reconstruction with DL. We conducted pre-training with iteration = 1, followed by training with 10 iterations and batch size of 1. We tested the epochs ranging from 1 to 10, and adopted the number of epochs giving the highest structure similarity (SSIM).
Numerical evaluation
The mean values of peak signal-to-noise ratio (PSNR) and SSIM were calculated using test images.
Clinical evaluation
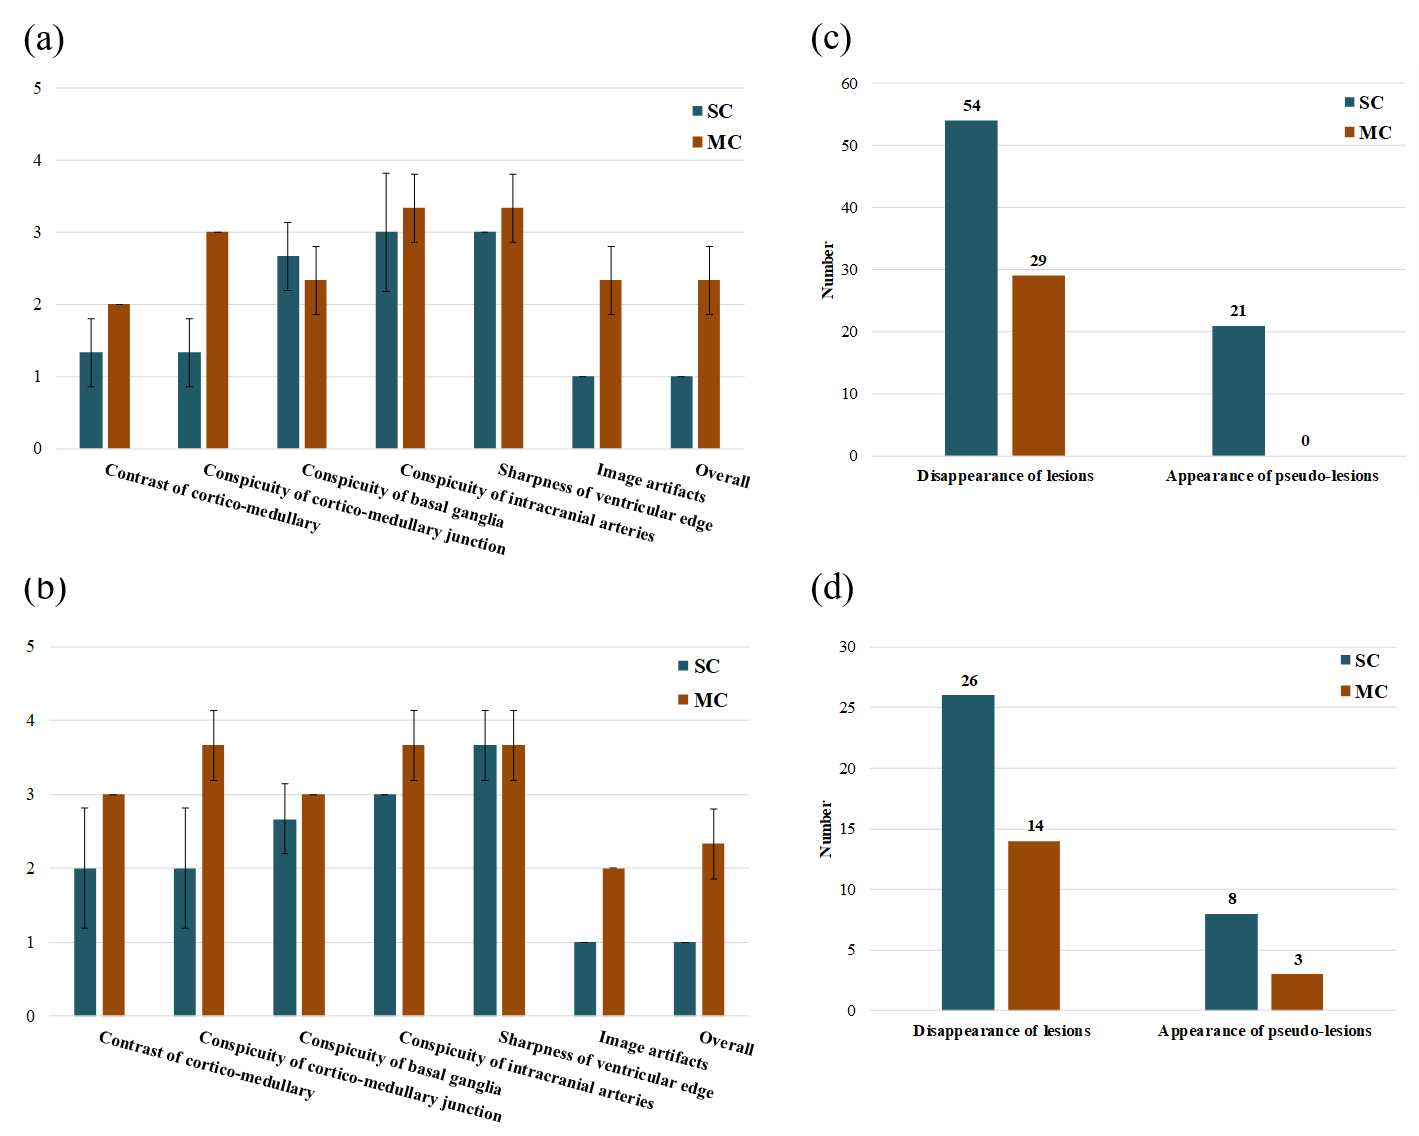
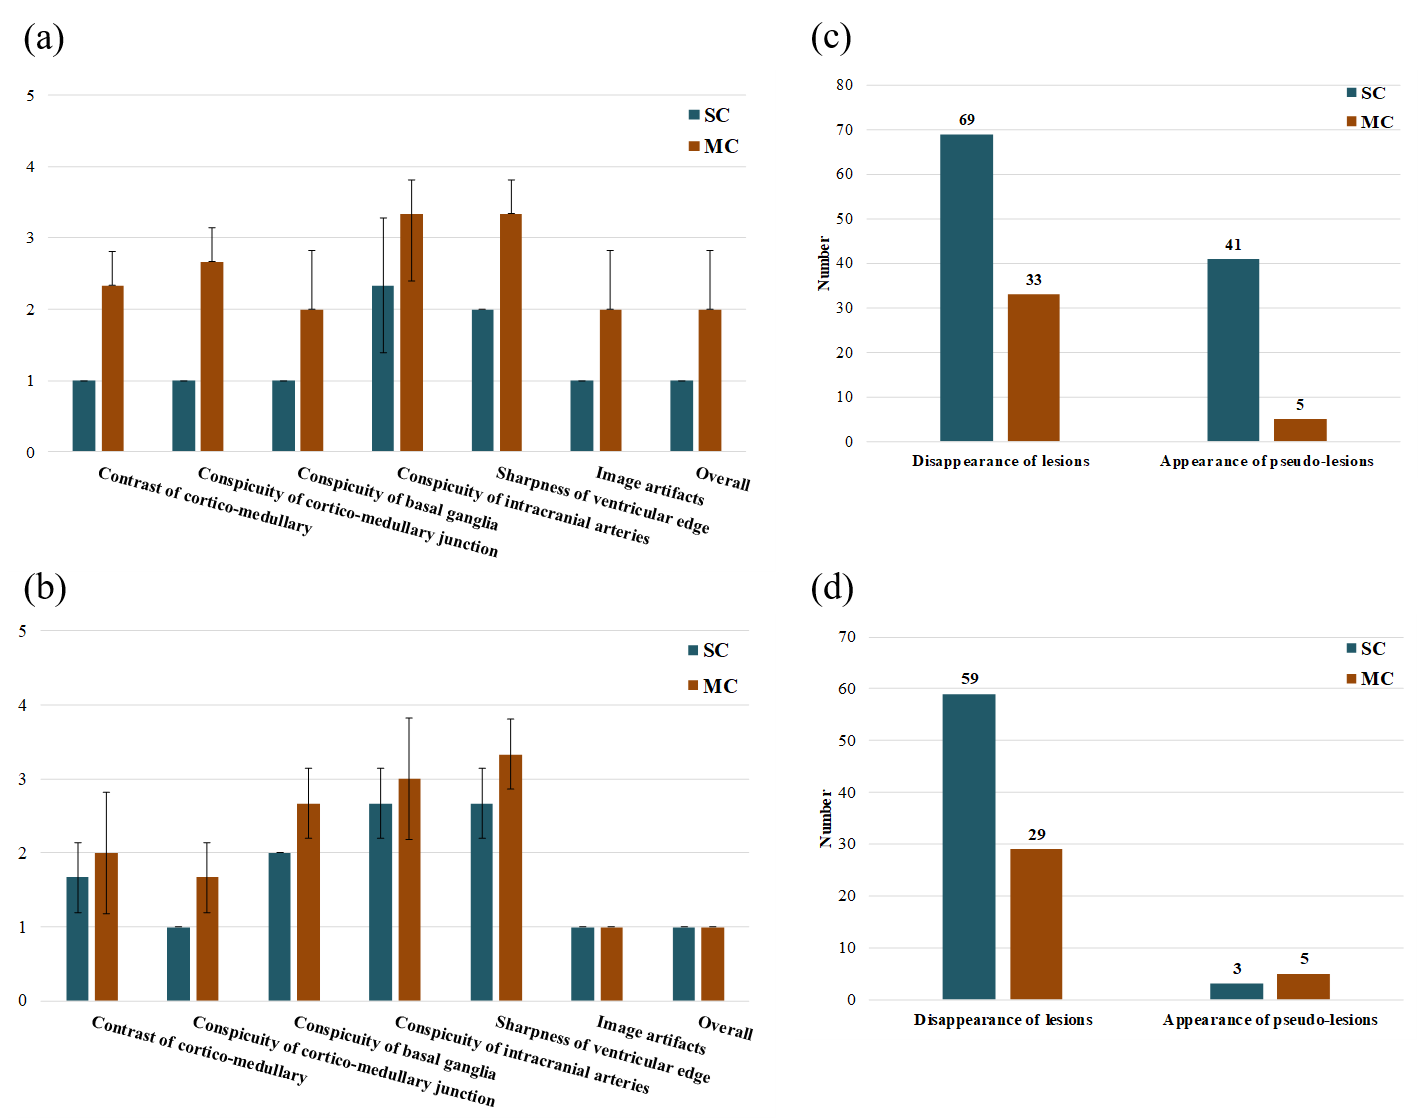
Images from 3 patients were clinically evaluated by a radiologist in terms of diagnostic image quality and performance. The contrast of cortico-medullary, conspicuity of cortico-medullary junction, conspicuity of basal ganglia, conspicuity of intracranial arteries, and sharpness of ventricular edge were graded on a 5-point scale, and the image artifacts and overall image quality were graded on a 3-point scale (1: not diagnostic, 2: suboptimal, 3: acceptable). The numbers of false negatives (disappeared white matter lesions) and false positives (generated pseudo-lesions) were counted by the radiologist.
RESULTS
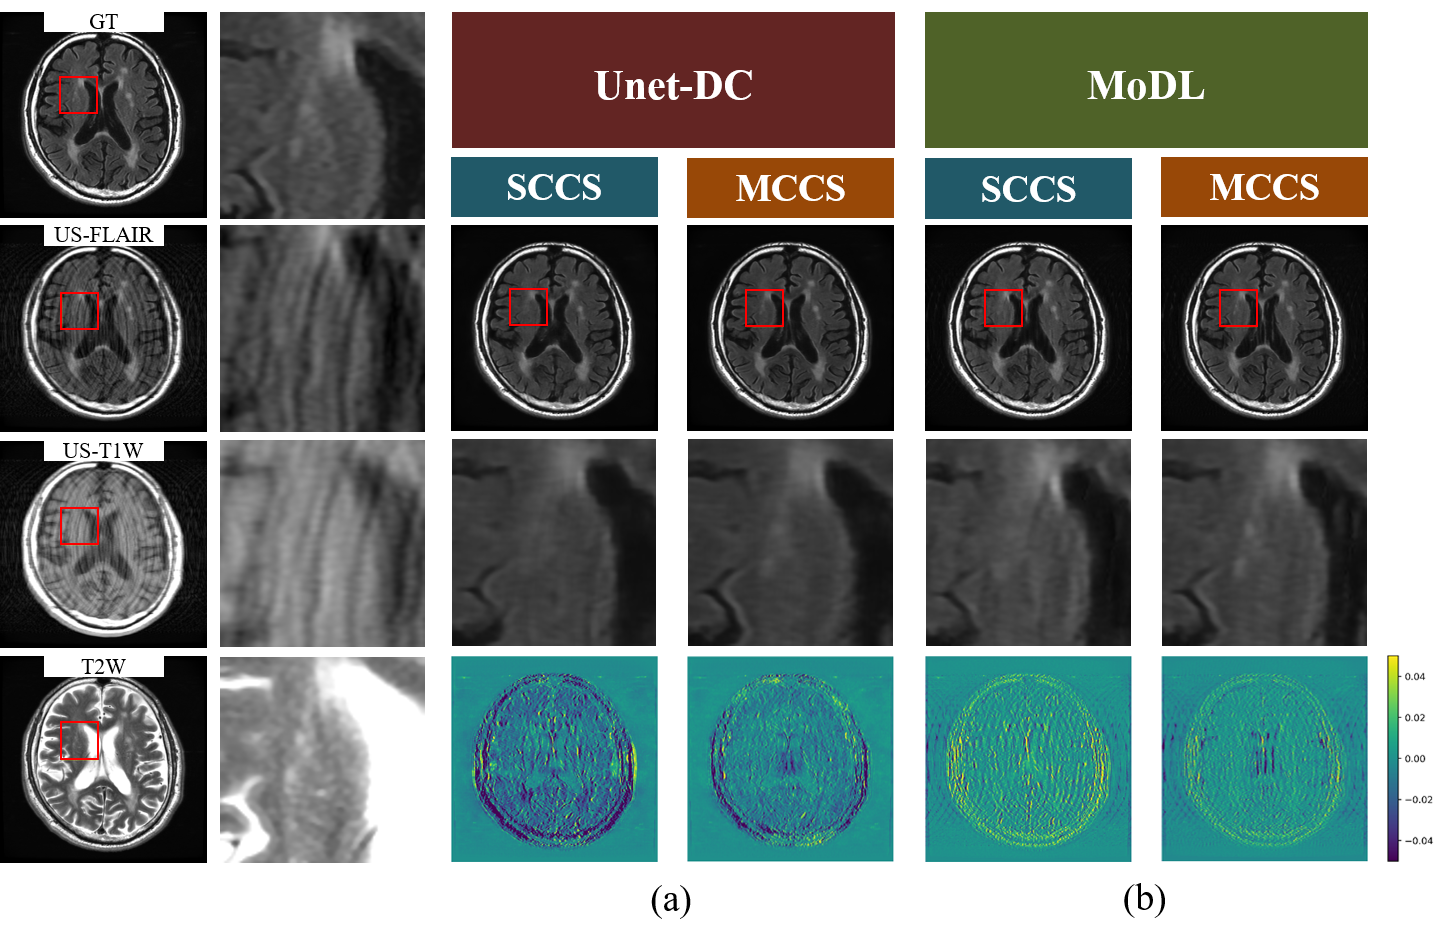
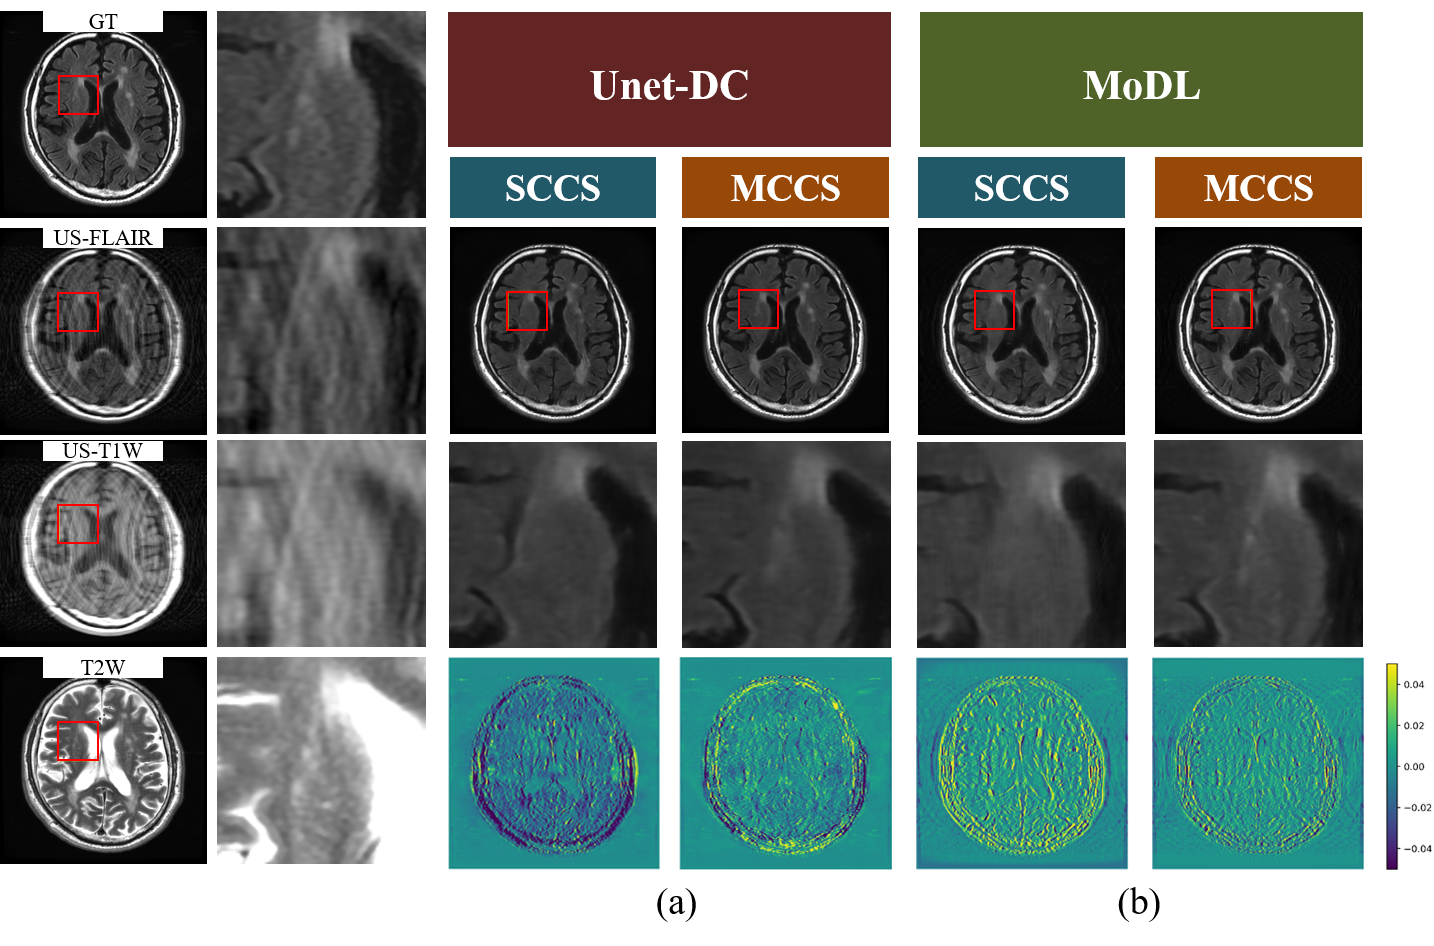
Numerical evaluation and image qualityFor Unet-DC, MCCS showed higher mean PSNR/SSIM (35.65 dB/0.9936 (AF = 2) and 33.17dB/0.9888 (AF = 2.6)) compared with SCCS (34.48 dB/0.9915 (AF = 2) and 31.71 dB/0.9845 (AF = 2.6)). As shown in Figs. 2(a) and 3(a), the lesions were reproduced in MCCS while many of them disappeared in SCCS. The lesion contrast was reduced even for MCCS. For MoDL, MCCS showed higher mean PSNR/SSIM of MCCS (38.36 dB/0.9966 (AF = 2) and 35.38/0.9936 (AF = 2.6)) compared with SCCS (37.14 dB/0.9955 (AF = 2) and 33.98 dB/0.9901 (AF = 2.6)). As shown in Fig. 2(b) and Fig. 3(b), the reproducibility of the lesion had the same tendency as in Unet-DC; the MCCS images showed the brighter lesion contrast than SCCS. The aliasing artifacts remained for MoDL, while they did not appear for Unet-DC.
Clinical evaluation
As shown in Figs. 4 and 5, MCCS was superior to SCCS in most of the evaluation items. In addition, the disappearance of lesions and the generation of pseudo-lesions were suppressed in the MCCS images compared to the SCCS images.
DISCUSSION
We compared the MCCS and SCCS for the Unet-DC and MoDL networks. For the both networks, MCCS was superior to SCCS in terms of image quality and diagnostic performance, and MCCS showed the better reproduction of anatomical structure and lesion. This is probably because MCCS also used US-T1WI containing the lesion information and T2WI containing the structural and lesion information. The aliasing artifacts remained in the MoDL images with AF = 2.6 may be caused by the poor expressive power of the CNN, and may be improved by using an alternative network such as ADMM-CSNet5. In order to introduce MCCS into clinical examinations, false positives and false negatives need to be further suppressed. Here, we used simple neural networks, and this problem could be improved by using a more sophisticated network. We used not only US-FLAIR but also US-T1WI to test the ability of the MCCS network to reduce the total scan time of FLAIR/T1WI/T2WI. Although the results were not shown here, MCCS with T1WI output also outperformed SCCS with T1WI output.CONCLUSION
We applied the DL-MCCS to the clinical brain images, and evaluated the diagnostic performance of the reconstructed images. For both networks, MCCS outperformed SCCS. Our results indicate that DL-MCCS would be quite useful in clinical examination.Acknowledgements
No acknowledgement found.References
[1] Lustig. M, et al., Sparse MRI: The Application of Compressed Sensing for Rapid MR Imaging, Magn. Reson. Med, 58(6), 1182-95 (2007).
[2] Bilgic B, et al., Multi-contrast Reconstruction With Bayesian Compressed Sensing, Magn. Reson. Med, 66(6), 1601-1615 (2011).
[3] Hyun. CM, et al., Deep learning for undersampled MRI reconstruction, Phys. Med. Biol. 63(13), 135007 (2017).
[4] Aggarwal HK, et al., MoDL: Model Based Deep Learning Architecture for Inverse Problems, IEEE TM-I, 38(2), 394-405 (2019).
[5] Yang Y, et al., ADMM-CSNet: A Deep Learning Approach for Image Compressive Sensing, IEEE TPAMI ,42(3), 521-538 (2020).
Figures