2425
Bias correction for PET/MR attenuation correction using generative adversarial networks1Department of Circulation and Medical Imaging, NTNU, Trondheim, Norway, 2Department of Radiology and Nuclear Medicine, St. Olavs Hospital, Trondheim University Hospital, Trondheim, Norway
Synopsis
Attenuation correction is a challenge in PET/MRI. In this study we propose a novel attenuation correction method based on estimating the bias image between PET reconstructed using a 4-class attenuation correction map and PET reconstructed with an attenuation correction map where bone information is added from a co-registered CT image. A generative adversarial network was trained to estimate the bias between the PET images. The proposed method has comparable performance to other Deep Learning based attenuation correction methods where no additional MRI sequences are acquired. Bias estimation thus constitutes a viable alternative to pseudo-CT generation for PET/MR attenuation correction.
Introduction
Good attenuation correction methods are vital to obtain quantitatively accurate PET images. For PET/MR this is challenging because no straightforward relationship exists between the MR intensity values and the attenuation coefficients. Most strikingly, the current clinical standard is a 4-class attenuation map (umap) that does not include bone1,2. To solve this, creating pseudo-CT images from acquired MRI has been suggested 3,4. In this study we propose a novel approach for PET/MR attenuation correction, where instead of generating an improved umap based on a pseudo-CT images, we directly predict the errors made by the 4-class umap using a generative adversarial network.Method
Patients and preprocessingIn this pilot study we used a dataset containing whole-body PET/MR and PET/CT of 29 patients with lymphoma and lung cancer examined at St. Olavs Hospital, Trondheim University Hospital, Norway. The study was approved by the regional ethical committee. The PET/CT images were acquired with a Siemens Biograph 64 scanner and the PET/MR images with a 3T Siemens Biograph mMR. CT images, MR DIXON, 4-class umap images and the raw PET data from the PET/MR were extracted for the study. Segmentations of the pelvic area of both CT and MR Dixon images were used as registration masks. The CT images were co-registered to the Dixon images using a two-stage registration procedure including translation and deformable registration in Elastix 5.0.15,6. Manual verification revealed that excellent registration results were obtained for 14 patients, which were used for the further analysis.
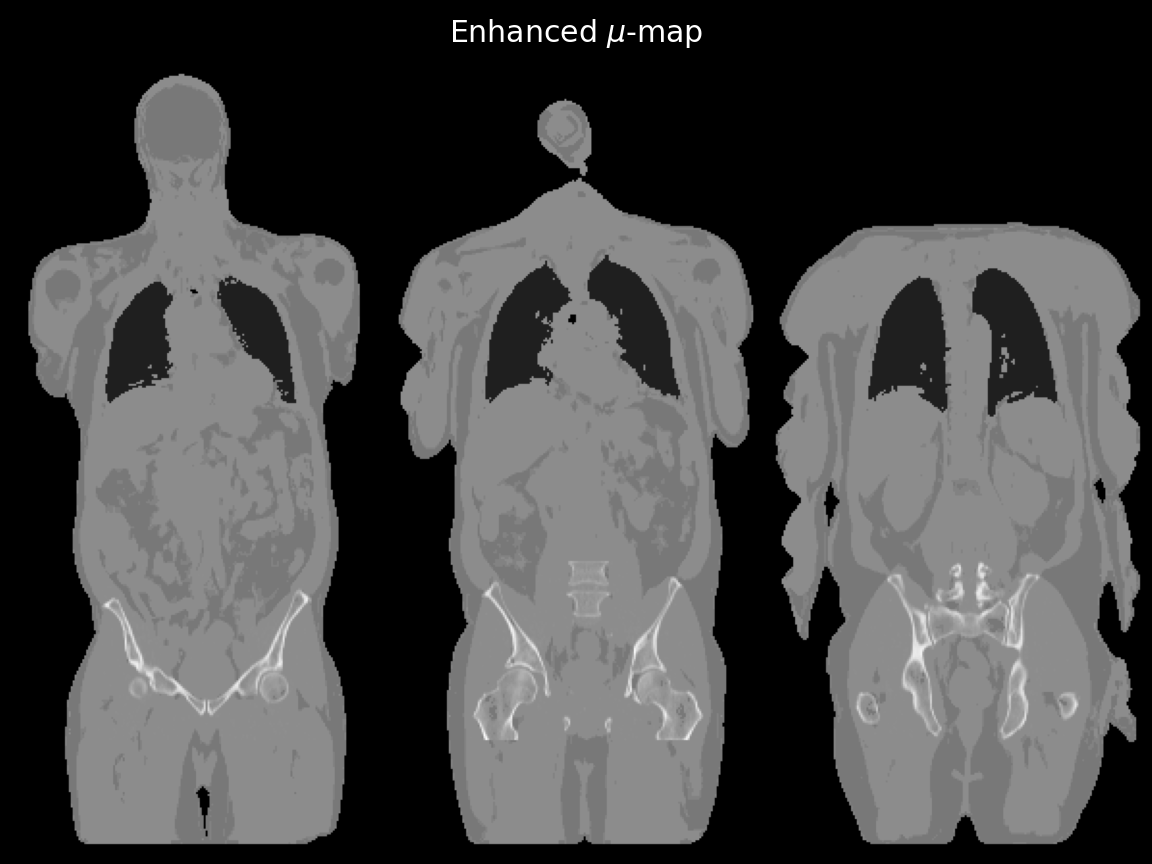
Bone information, defined by voxels with an attenuation coefficient of > 0.1 cm-1 (≈ 70 HU) in the CT based umaps, were painted into the 4-class umap images to create CT-enhanced umaps as shown in figure 1. PET images were reconstructed using the 4-class umaps (PET4C) and the CT-enhanced umaps (PETCT) where the latter were considered as the gold standard.
These PET images were used to calculate bias image using the equation below. Each voxel in the bias image represents the relative difference between the PET images. The bias images were set to 0 outside the segmented pelvic region.
$$Bias\, image = \frac{PET_{CT}-PET_{4C}}{PET_{CT}}$$
Network
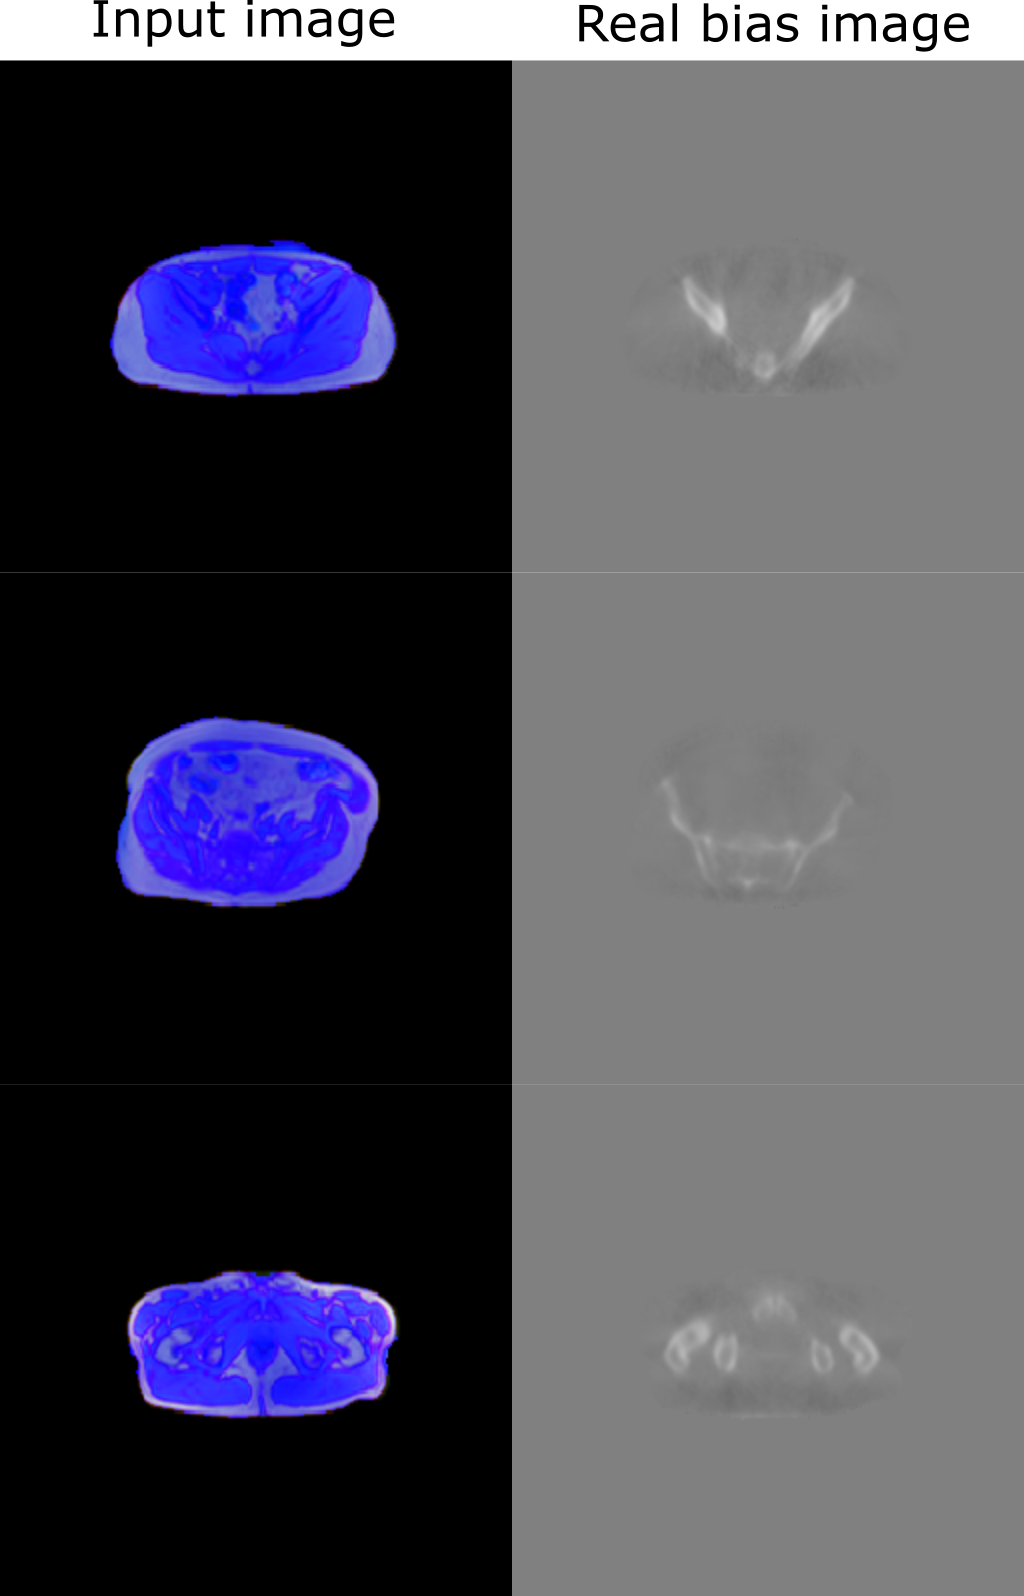
Pix2pix7,8, a Generative Advesarial Network implementation, was trained on the task of mapping the 3-channel input image consisting of Dixon in-phase, Dixon out-of-phase and umap images to the true PET bias images. The true bias images were truncated to the range between -100% and 100% and converted to 8-bit PNG images. The network input is shown in figure 2. The Dixon in-phase and out-of-phase images and the 4-class umap image were resampled to the coordinate space of the PET image and min-max scaled to the range between -1 and 1. They were then concatenated to a 3-channel PNG image. Nine random patients (1310 images) were selected for the training set, two patients for the validation set (295 images) and 3 patients (404 images) were held out for the test set. A 70-by-70 patch GAN was used as the discriminator network and a 9 block ResNet model was used for the discriminator network. The model was trained for 200 epochs using a linearly decaying learning rate schedule.
Statistical Analysis
The predicted bias map was used to correct PET4c , giving PETbias corrected. Again taking PETCT as the gold standard, the root mean squared error (RMSE), was compared between these images. For the RSME calculations, the bias was set to zero in both the real and generated bias images in the voxels where the activity concentration was less than 300 Bq/ml in the PET4C image, and only values within the pelvic masks were used. The RMSE values were calculated on a per-patient basis and the mean RMSE ± standard deviation is reported.
Results
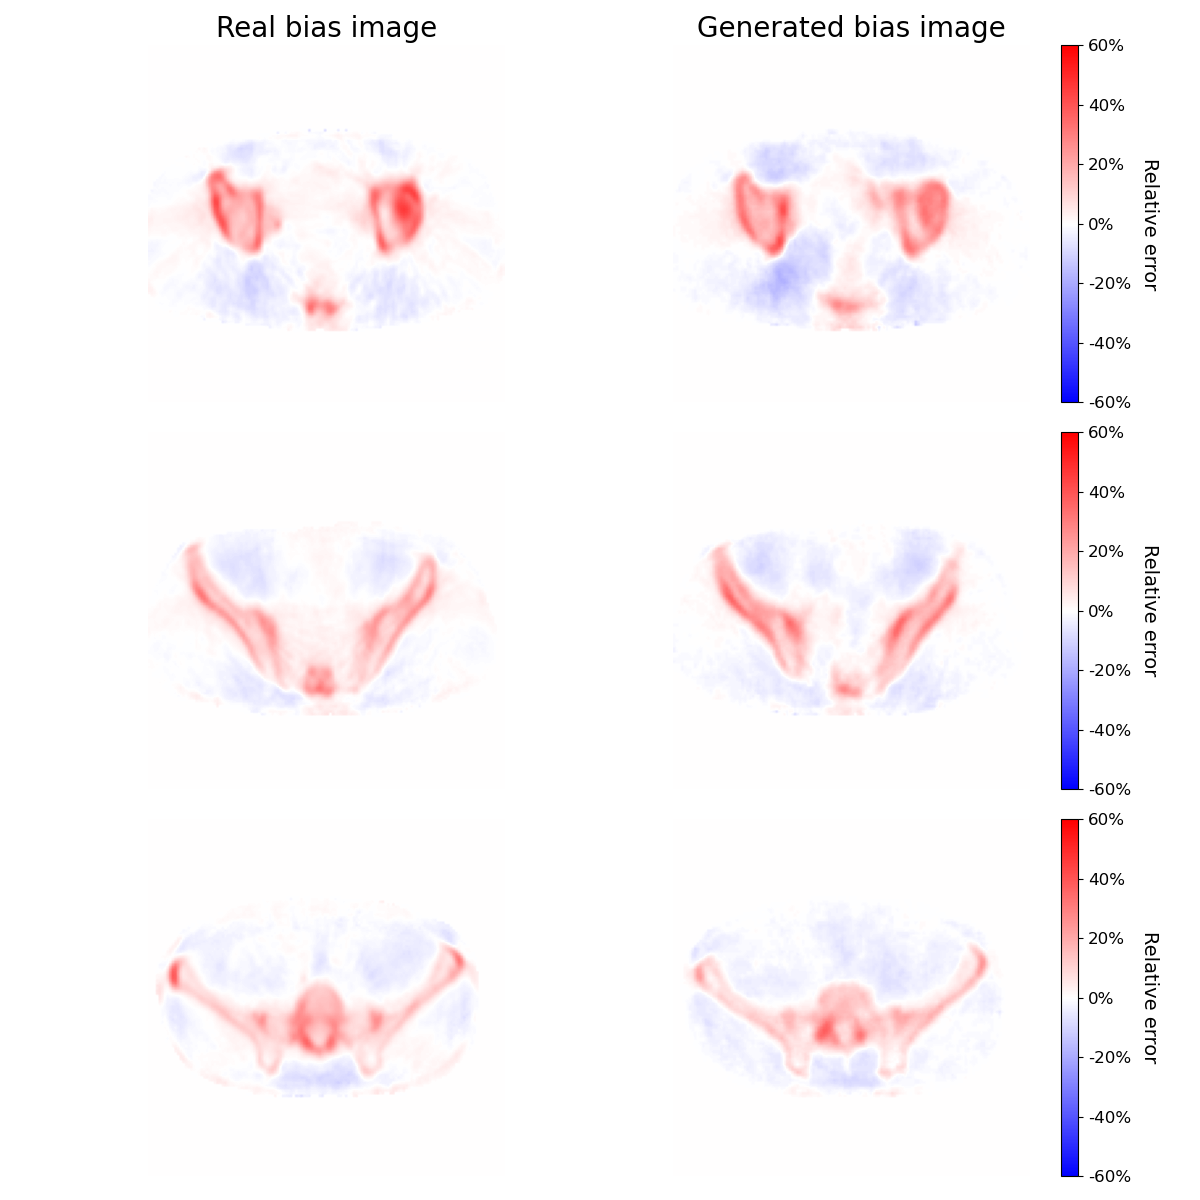
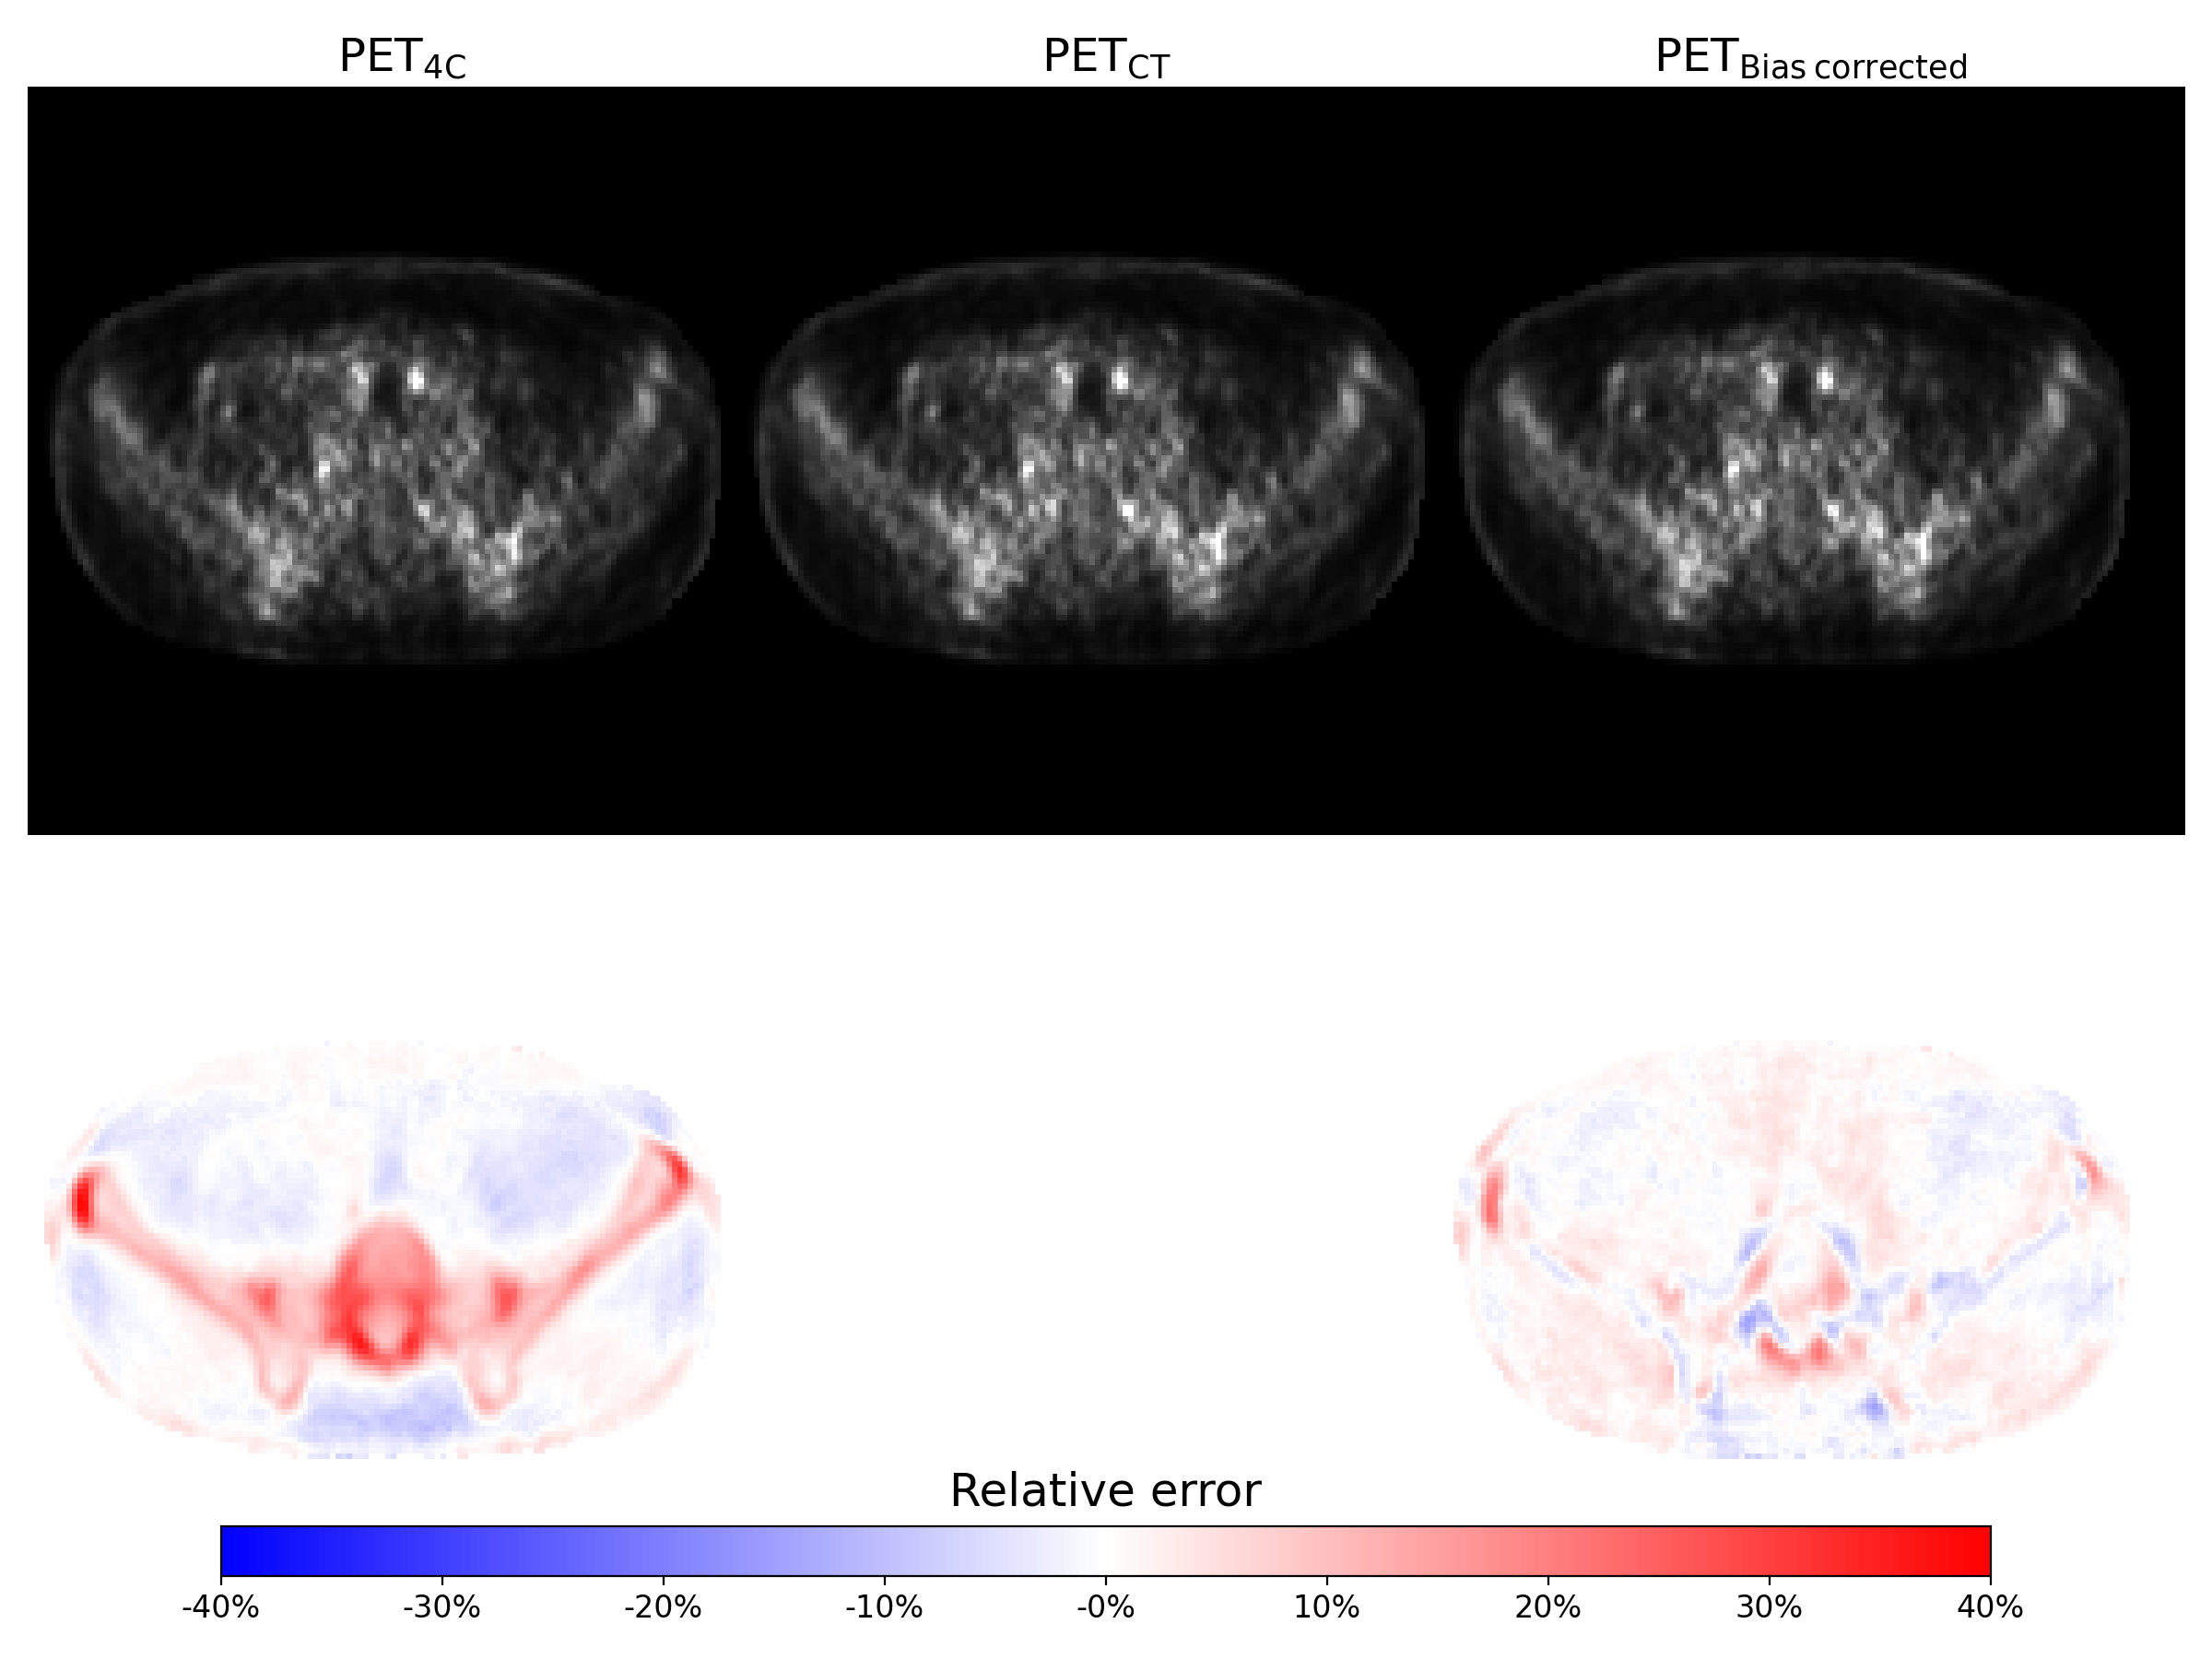
Three examples of the predicted bias images are shown in figure 3. The RMSE between PETbias corrected and PETCT was found to be 5.60% ± 1.24%. In comparison the RMSE between PET4C and PETCT was 8.28% ± 0.77%. Figure 4 shows the reconstructed PET images, and their relative error compared the gold standard PETCT image.Discussion
The proposed method constitutes a promising method for improving attenuation correction for PET/MR. It shows promising results even though it was trained on a relatively small dataset and no data augmentation was performed. No additional MRI sequences other than the on-scanner default sequences for umap creation need to be acquired. The PET images can also be improved without needing to perform a re-reconstruction making inclusion into a clinical workflow, as well as post-hoc enhancement, straightforward.The results are similar to other values reported in literature where only two-point Dixons sequences were used. Bradshaw et al. reported a similar PET RMSE of 4.9% using two-point Dixon images for synthetic CT generation9. Better results have been reported when allowing time for purpose-specific MR sequences to be acquired for synthetic CT generation10.
Conclusion
Direct bias estimation from the two-point Dixon sequence and 4-class attenuation correction map shows promise for enhancing the quantitative accuracy of PET/MRI images. The performance is similar to other Deep learning based attenuation correction methods where no additional sequences are acquired.Acknowledgements
No acknowledgement found.References
1. Martinez-Moller A, Souvatzoglou M, Delso G, et al. Tissue Classification as a Potential Approach for Attenuation Correction in Whole-Body PET/MRI: Evaluation with PET/CT Data. J Nucl Med. 2009;50(4):520-526. doi:10.2967/jnumed.108.054726
2. Bogdanovic B, Gafita A, Schachoff S, et al. Almost 10 years of PET/MR attenuation correction: the effect on lesion quantification with PSMA: clinical evaluation on 200 prostate cancer patients. Eur J Nucl Med Mol Imaging. Published online July 28, 2020. doi:10.1007/s00259-020-04957-x
3. Torrado-Carvajal A. Dixon-VIBE Deep Learning (DIVIDE) Pseudo-CT Synthesis for Pelvis PET/MR Attenuation Correction (vol 60, pg 429, 2019). J Nucl Med. 2020;61(1):161-161.
4. Pozaruk A, Pawar K, Li S, et al. Augmented deep learning model for improved quantitative accuracy of MR-based PET attenuation correction in PSMA PET-MRI prostate imaging. Eur J Nucl Med Mol Imaging. Published online May 11, 2020. doi:10.1007/s00259-020-04816-9
5. Klein S, Staring M, Murphy K, Viergever MA, Pluim JPW. elastix: A Toolbox for Intensity-Based Medical Image Registration. IEEE Trans Med Imaging. 2010;29(1):196-205. doi:10.1109/TMI.2009.2035616
6. Shamonin DP, Bron EE, Lelieveldt BPF, Smits M, Klein S, Staring M. Fast Parallel Image Registration on CPU and GPU for Diagnostic Classification of Alzheimer's Disease. Front Neuroinformatics. 2014;7. doi:10.3389/fninf.2013.00050
7. Isola P, Zhu J-Y, Zhou T, Efros AA. Image-to-Image Translation with Conditional Adversarial Networks. ArXiv161107004 Cs. Published online November 26, 2018. Accessed December 14, 2020. http://arxiv.org/abs/1611.07004
8. Zhu J-Y. Junyanz/Pytorch-CycleGAN-and-Pix2pix.; 2020. Accessed December 14, 2020. https://github.com/junyanz/pytorch-CycleGAN-and-pix2pix
9. Bradshaw TJ, Zhao G, Jang H, Liu F, McMillan AB. Feasibility of Deep Learning–Based PET/MR Attenuation Correction in the Pelvis Using Only Diagnostic MR Images. Tomography. 2018;4(3):138-147. doi:10.18383/j.tom.2018.00016
10. Leynes AP, Yang J, Wiesinger F, et al. Zero-Echo-Time and Dixon Deep Pseudo-CT (ZeDD CT): Direct Generation of Pseudo-CT Images for Pelvic PET/MRI Attenuation Correction Using Deep Convolutional Neural Networks with Multiparametric MRI. J Nucl Med. 2018;59(5):852-858. doi:10.2967/jnumed.117.198051
Figures