2423
Multi-Task Learning based 3-Dimensional Striatal Segmentation of MRI – PET and fMRI Objective Assessment1Biomedical Engineering, Stony Brook University, Stony Brook, NY, United States, 2Psychiatry, Renaissance School of Medicine at Stony Brook University, Stony Brook, NY, United States, 3Radiation Oncology, NYU Langone, New York, NY, United States, 4Radiology, Renaissance School of Medicine at Stony Brook University, Stony Brook, NY, United States
Synopsis
Segmenting striatal subregions can be difficult; wherein atlas-based approaches have been shown to be less reliable in patient populations and have problems segmenting smaller striatal ROI’s. We developed a Multi-Task Learning model to segment multiple 3D striatal subregions using a Convolutional Neural Network and compared it to the Clinical Imaging Center atlas (CIC). Dice Score Coefficient and multi-modal objective assessment (PET and fMRI) were conducted to evaluate the reliability of MTL-generated segmentations compared to atlas-based. Overall, MTL-generated segmentations were more comparable to manual than CIC across all ROI’s and analyses. Thus, we show MTL method provides reliable striatal subregion segmentations.
Introduction
Striatal pathology or dysfunction is thought to play a critical role in neurological and neuropsychiatric diseases such as schizophrenia, Parkinson’s, and Huntington’s disease1-4. Widely available atlas-based approaches, such as Freesurfer and the Imperial College London Clinical Imaging Center (CIC), can robustly identify the whole striatum and its major structures (the caudate and putamen), but have been less reliable in segmenting the striatal subregions, particularly in-patient populations5. Atlas-based approaches, although readily available to implement, require nonlinear warping of the input volume to the atlas. At times, this may create deformation fields that will affect fine details, especially for smaller ROI’s such as striatal subregions6; indicating that a more optimal method for striatal subregion segmentation is needed that is comparable to manually drawn ROIs.Multi-Task Learning (MTL) is a technique used in deep learning that allows representations between related tasks to be shared that can generalize the model to predict the original task, and many more, with better accuracy7. We propose to utilize MTL to segment subregions of the striatum consisting of pre-commissural putamen (prePU), pre-commissural caudate (preCA), post-commissural putamen (postPU), post-commissural caudate (postCA), and ventral striatum (VST) using a convolutional neural network (CNN). Analysis of MTL-generated segmentations was also compared to CIC-generated segmentations. Objective assessment was applied to the automated segmentations to analyze PET binding potential data, as well as resting state functional connectivity (RSFC) fMRI data, compared to manually drawn ROIs.
Methods
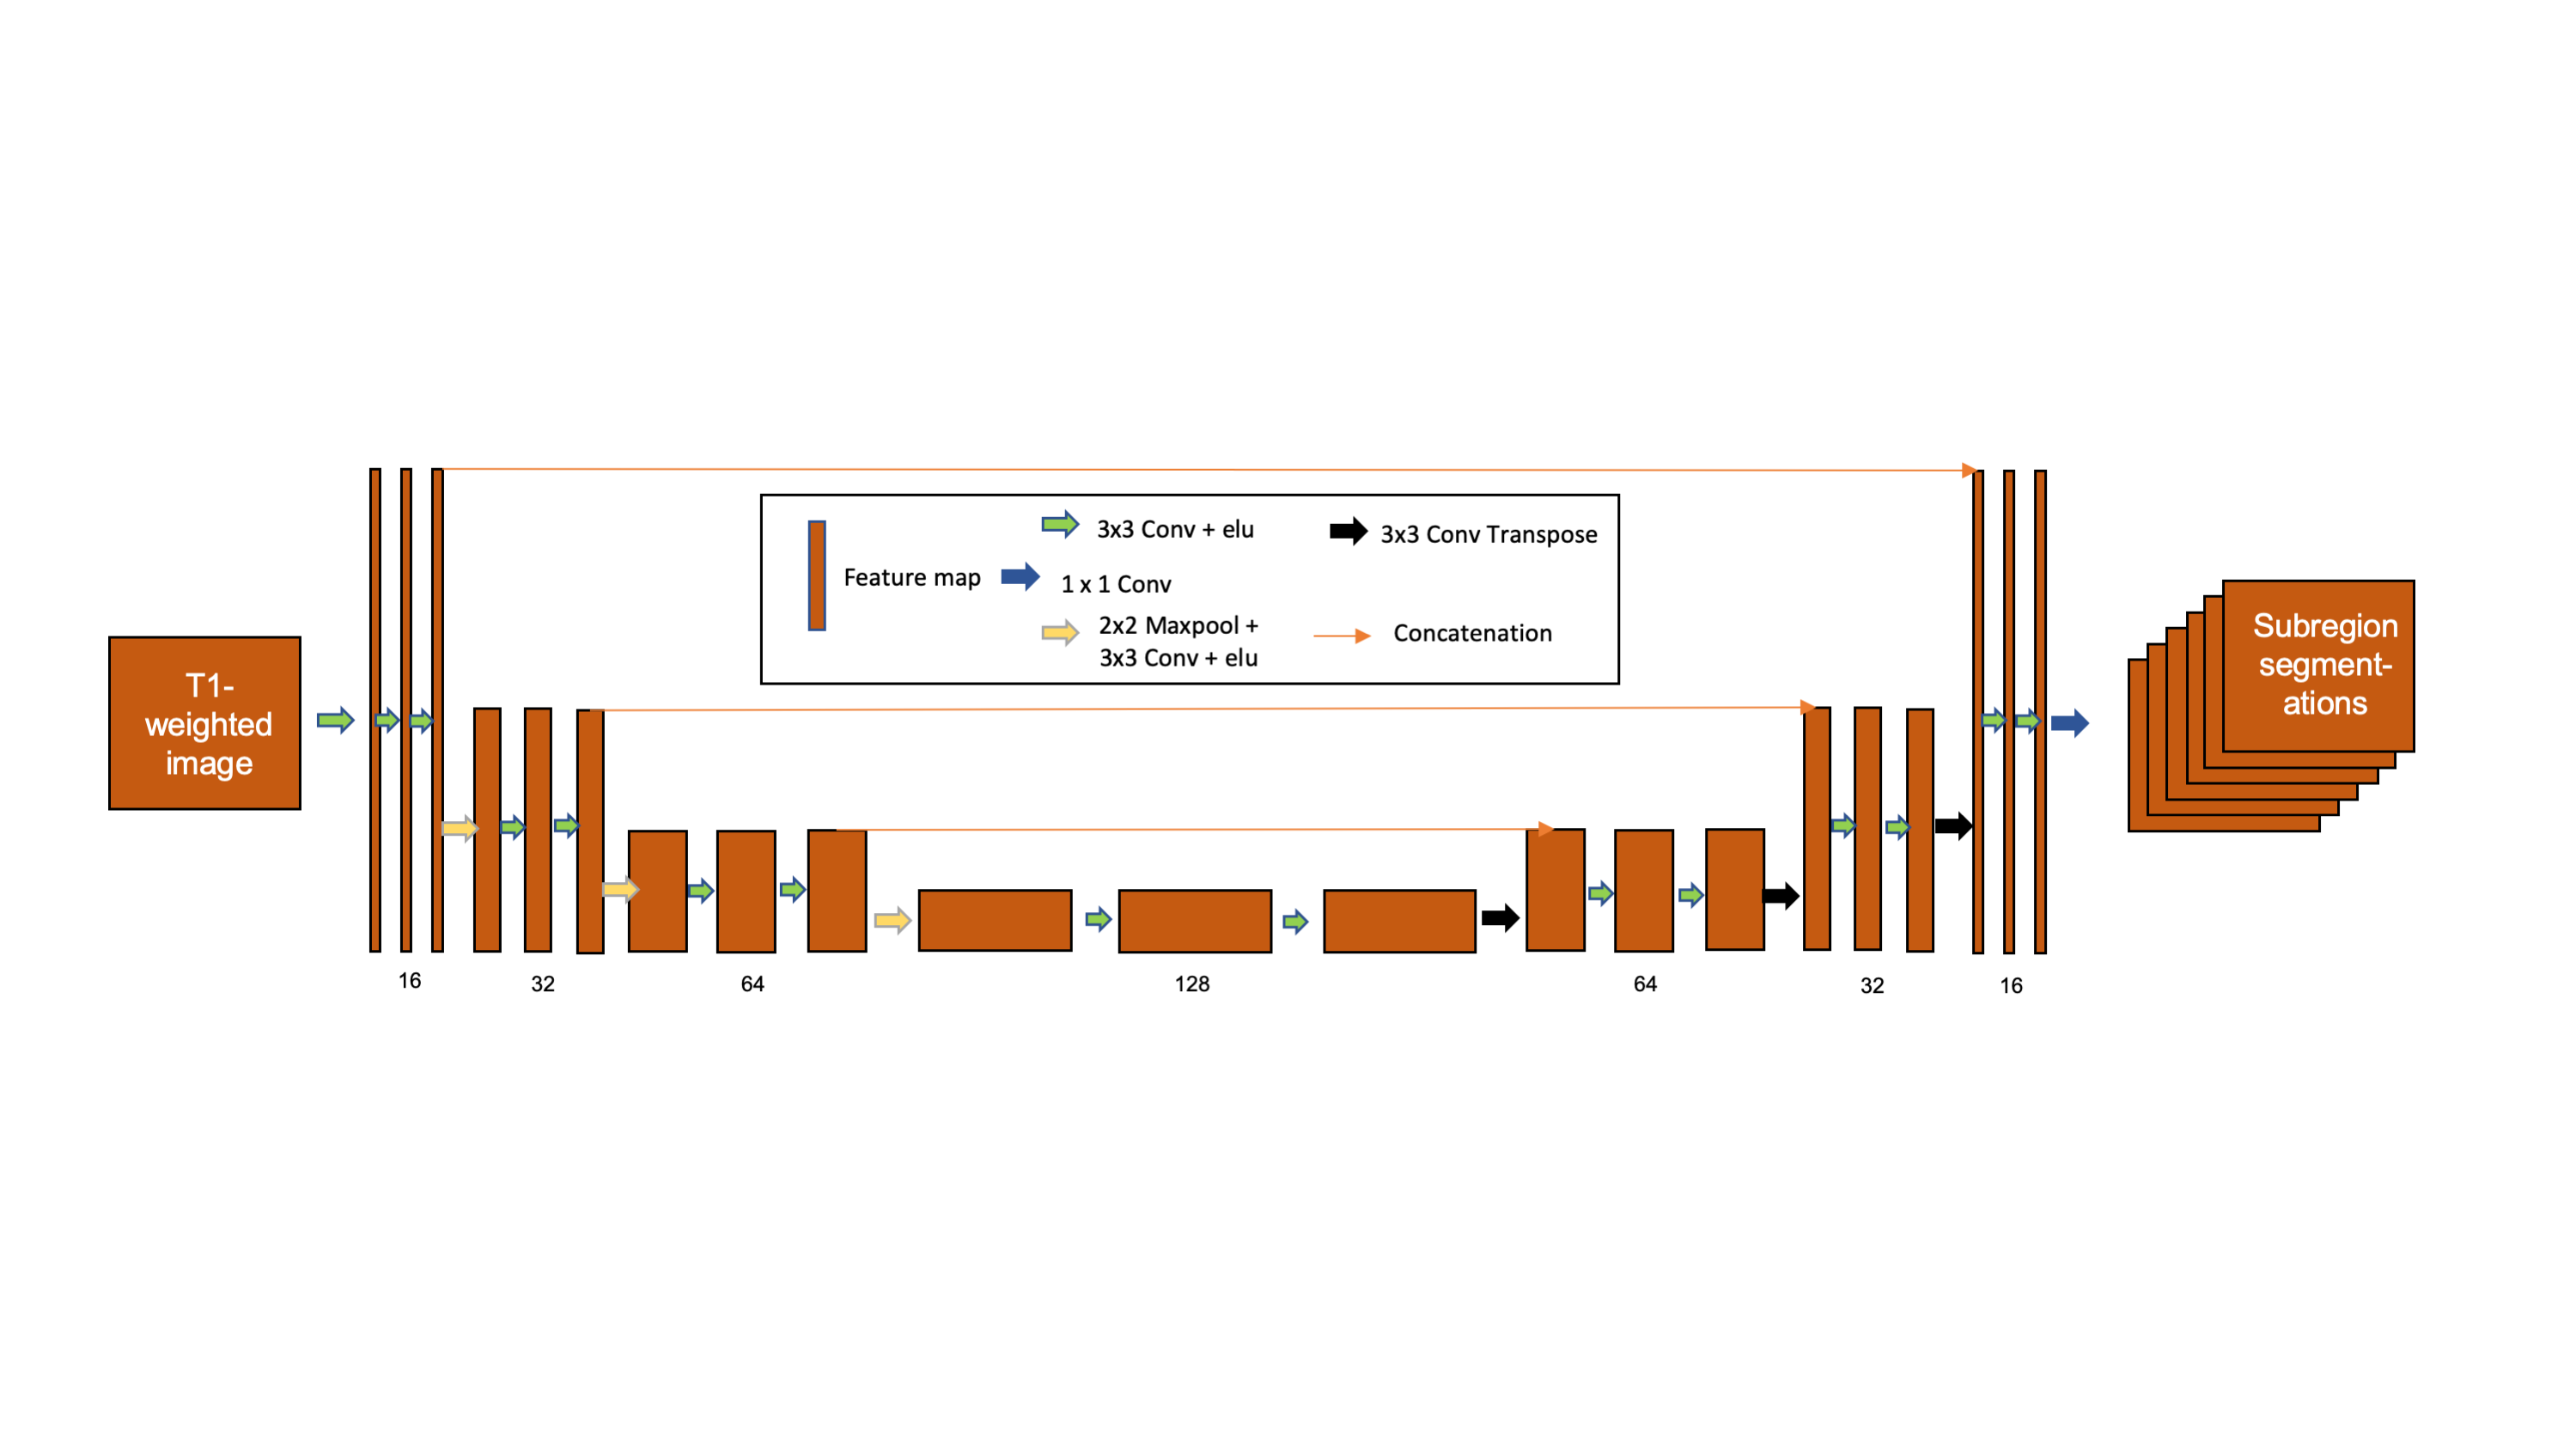
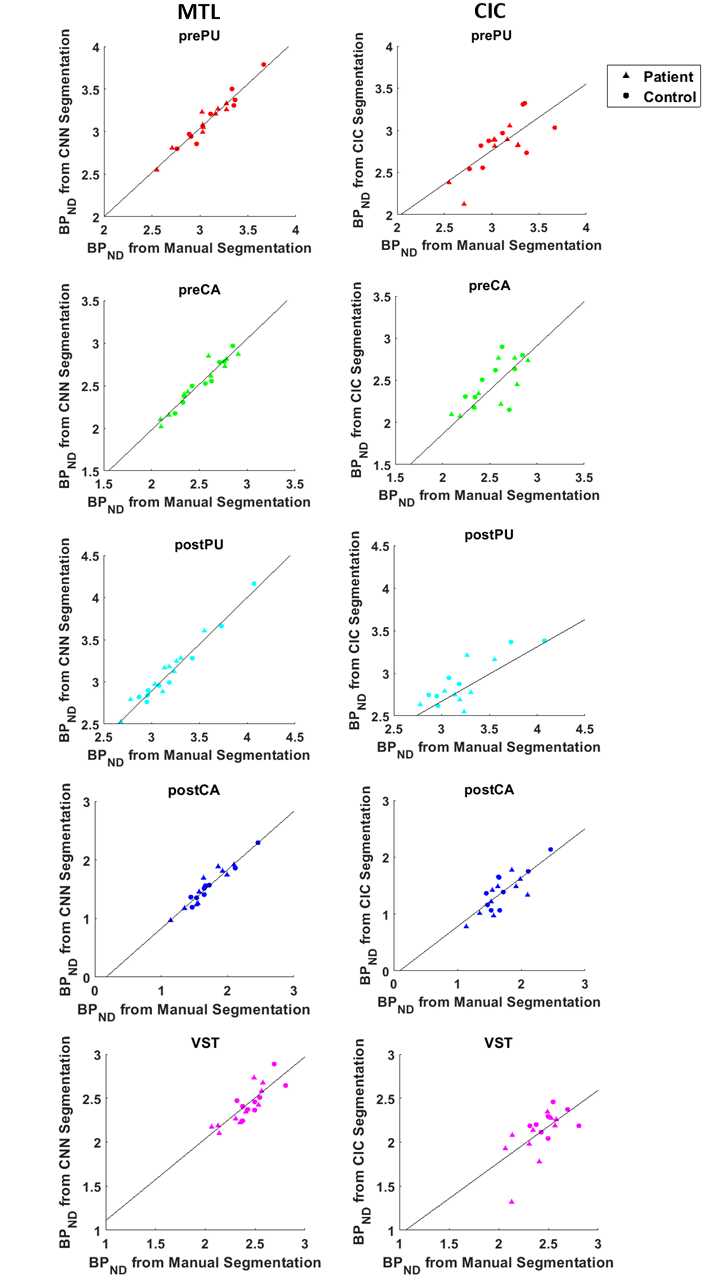
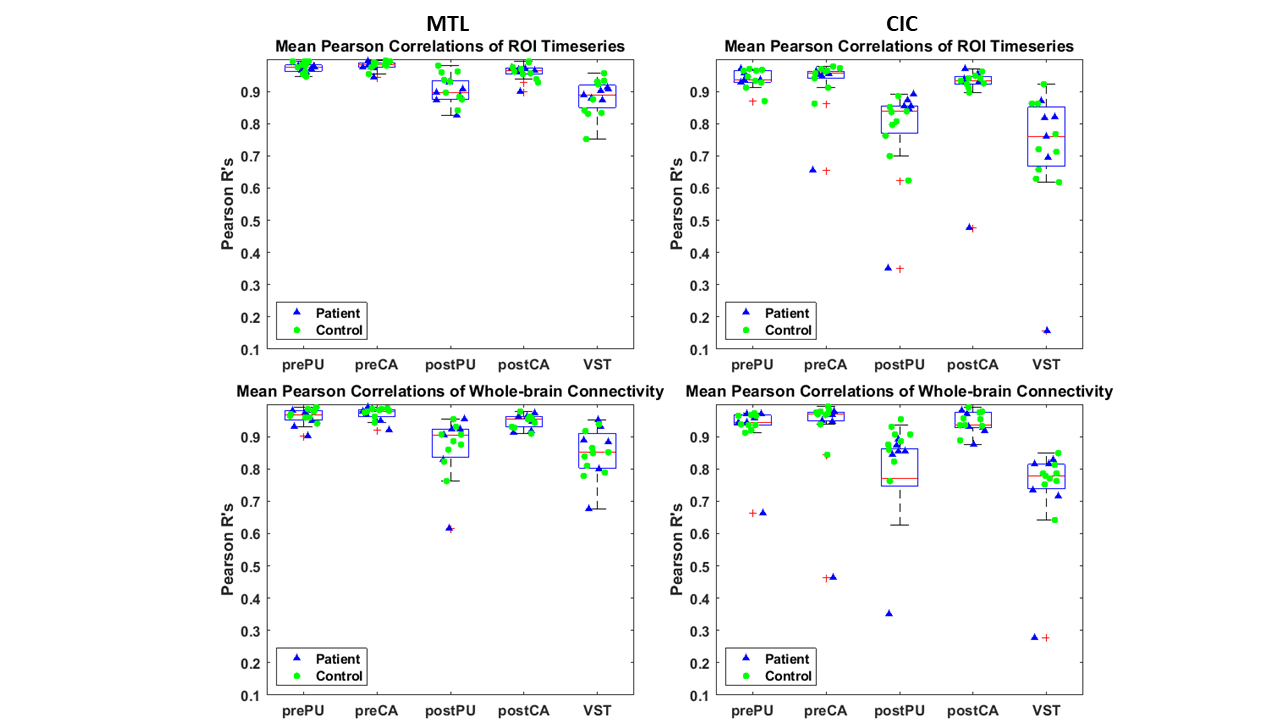
A total of 68 datasets consisting of patients with schizophrenia and matched controls were used to train the network. The 3D T1-weighted image were used as input for the MTL network and six output tasks were simultaneously trained on manually drawn ROI’s; where five of the six were ROI masks and the last was the masked background. As shown in Figure 1, this MTL network consisted of a 3D U-Net architecture. This model was trained to minimize the sparse softmax cross entropy between output and ground truth. For an additional comparison, striatal substructure ROIs from the CIC atlas8 were retrieved from the MIAKAT (Imanova, Ltd; London, UK) software package, and applied to the test data. Dice Similarity Coefficients (DSC) were utilized to initially evaluate the performance of the automated methods. Afterwards, task-based assessment was evaluated using automated segmentations to measure PET and fMRI quantification.An independent dataset of 19 volunteers imaged with [11C]raclopride PET and MRI were used for the testing set. 60 min of dynamic emission data were acquired on an Siemens mCT scanner, following a bolus injection of 349 +/- 109 MBq of [11C]raclopride. Data were reconstructed by FBP with CT used for attenuation correction. Binding Potential (BPND) was derived in each ROI using simplified reference tissue model (SRTM)9 with cerebellum as reference tissue. Linear Regression was performed with BPND obtained from manual and CNN-generated ROIs. R2 and percent differences were reported. A subset of 16 participants from the PET test dataset described above also underwent 30 minutes of RSFC scanning and made up the fMRI test dataset. Multiband blood oxygen level dependent (BOLD) MR sequences were acquired using a multiband acceleration factor of 6, no in-plane acceleration or parallel imaging, with 66 slices, 192 mm field-of-view, 2 mm isotropic voxel size, 60° flip angle, 850 ms TR, and 25 ms TE. Raw timeseries were then extracted from both hand-drawn and automated ROIs following preprocessing, and the correlation between the hand-drawn and CNN timeseries data was calculated for each fMRI run. Also, timeseries correlations between each voxel were calculated for each ROI and averaged across runs to obtain whole-brain RSFC correlations. Finally, the correlation across voxels in RSFC was calculated between hand-drawn and automated ROIs.
Results
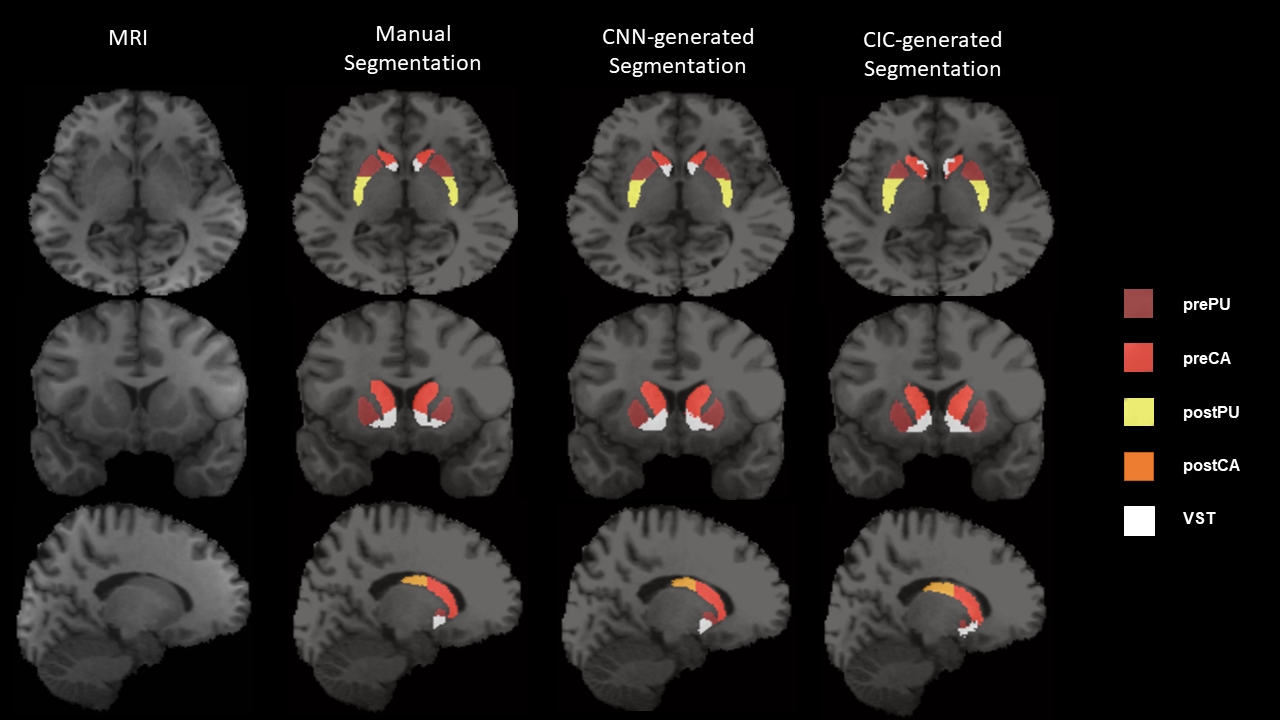
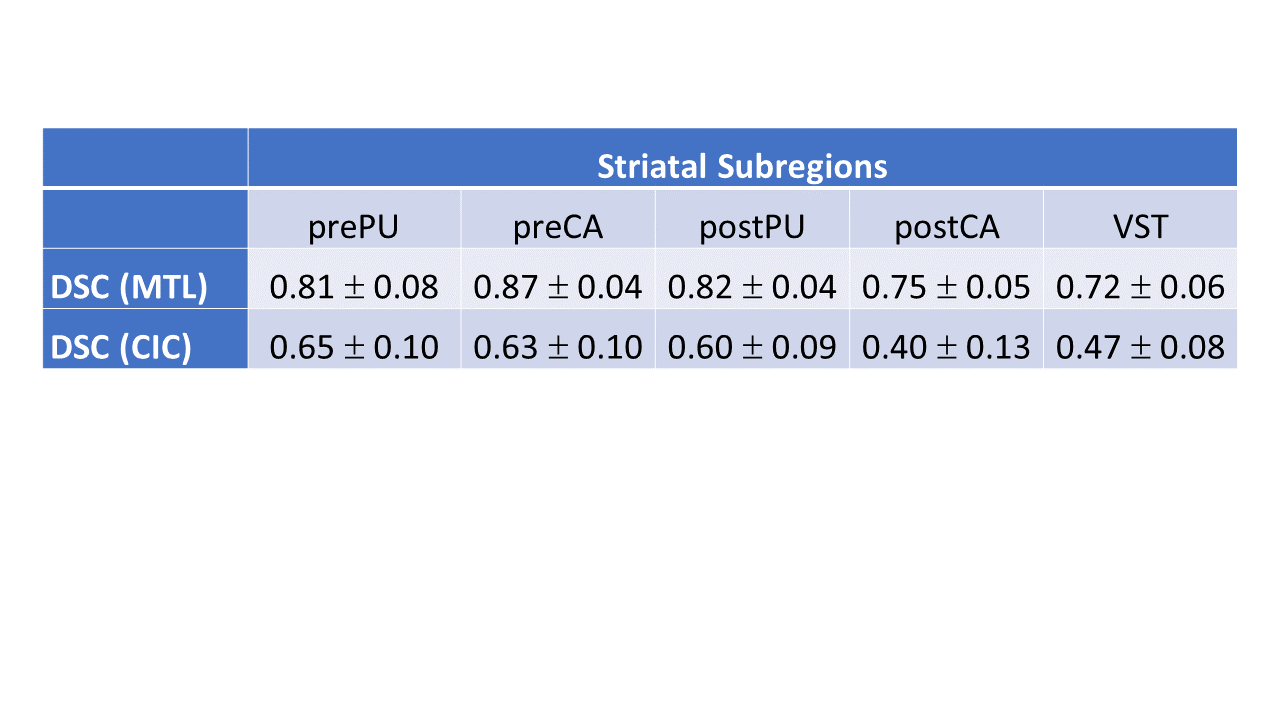
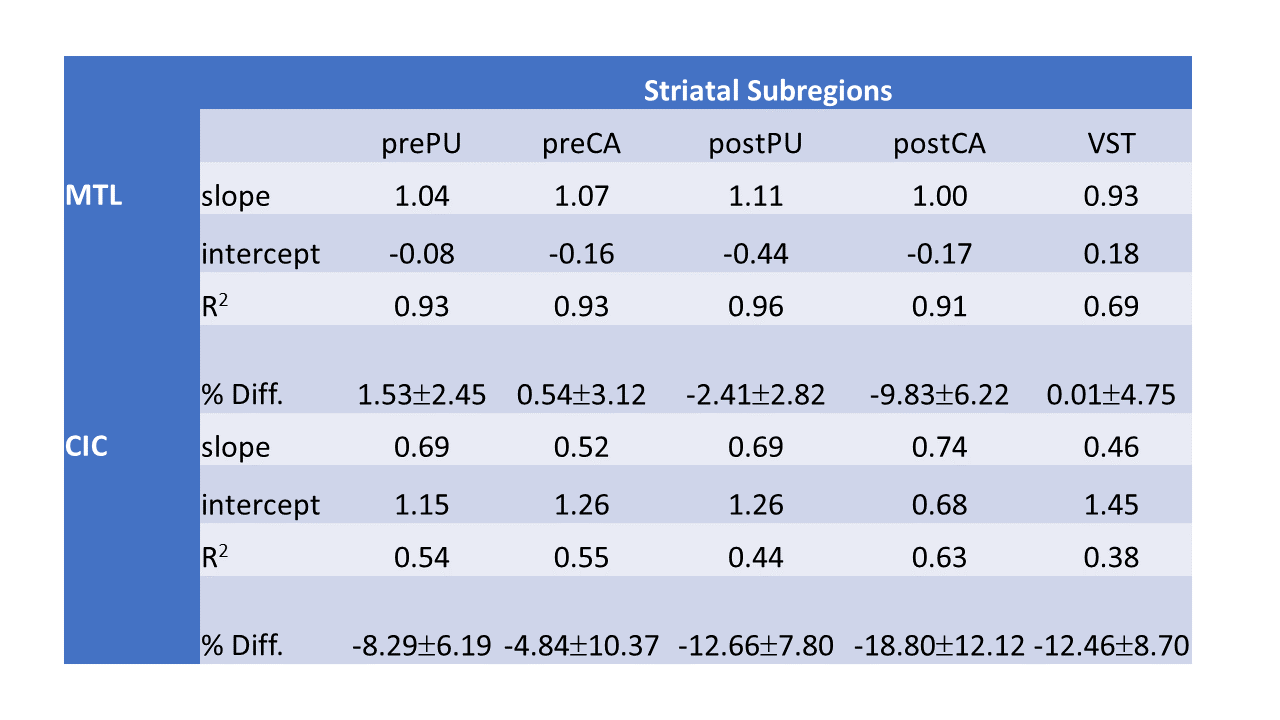
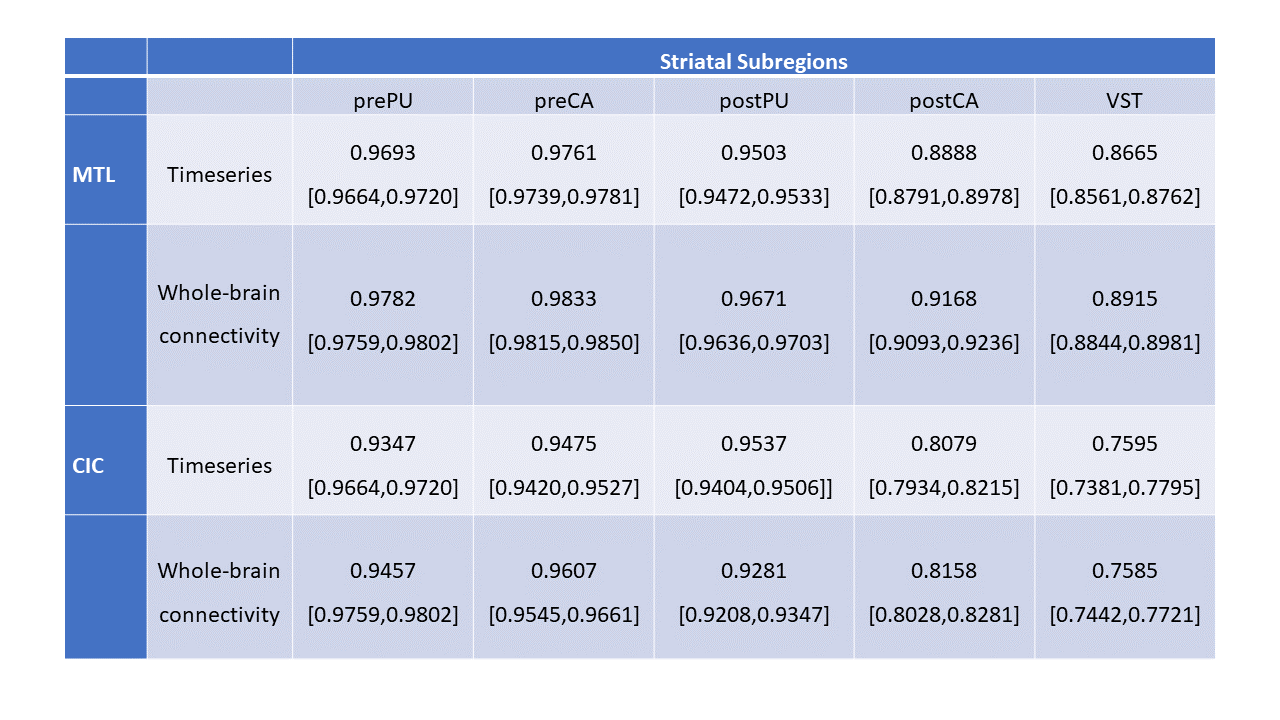
Figure 2 shows an example of manual and automated segmentations. Visually, MTL-generated segmentations are similar to manually segmented ROIs. As shown in Figure 2, MTL-generated segmentation seems to smooth VST where manual segmentation may have sharp edges. When comparing DSC, MTL-generated segmentations were more comparable to manual segmentations than CIC across all ROI’s (Table 1). When comparing PET quantification, Figure 3 and Table 2 reflect linear regression analysis, R-square and percent difference of MTL segmentations were more comparable to manual segmentations than CIC across all ROI’s. In terms of fMRI quantification, MTL segmentations also had closer correlation to manually drawn ROI’s (Table 3, Figure 4).Conclusion
In this study, we developed a deep MTL framework for striatal subregion segmentation and assessed the network outputs with PET and fMRI-derived quantitative outcome measures. We show here that our MTL method provides reliable striatal subregion segmentations for the purpose of PET quantification, fMRI timeseries extraction, and whole-brain RSFC correlations, with more comparable PET and fMRI results that more closely match those obtained with manually drawn ROIs than atlas-based segmentations.Acknowledgements
The authors would like to thank Xiaoyan Xu PhD for performing the manual segmentation on some of the data sets. Datasets were funded by P50 MH 086404 (AAD), K01 MH 107763 (JXVS), R21 MH 099509 (AAD). JJW was supported by K23 MH 115291, JXVS was supported by K01 MH 107763, and CH was supported by NARSAD 24971.References
1. Horga G, Cassidy CM, Xu X, et al. Dopamine-Related Disruption of Functional Topography of Striatal Connections in Unmedicated Patients With Schizophrenia. JAMA Psychiatry. 2016;73(8):862-870. 2. Laruelle M, Abi-Dargham A, Gil R, Kegeles L, Innis R. Increased dopamine transmission in schizophrenia: relationship to illness phases. Biological psychiatry. 1999;46(1):56-72.
3. Howes OD, Kambeitz J, Kim E, et al. The nature of dopamine dysfunction in schizophrenia and what this means for treatment: meta-analysis of imaging studies. Archives of general psychiatry. 2012;69(8):776-786.
4. Teichmann M, Gaura V, Démonet J-F, et al. Language processing within the striatum: evidence from a PET correlation study in Huntington's disease. Brain : a journal of neurology. 2008;131(4):1046-1056.
5. Makowski C, Beland S, Kostopoulos P, et al. Evaluating accuracy of striatal, pallidal, and thalamic segmentation methods: Comparing automated approaches to manual delineation. Neuroimage. 2018;170:182-198.
6. Gouttard S, Styner M, Joshi S, Smith RG, Hazlett HC, Gerig G. Subcortical structure segmentation using probabilistic atlas priors. Paper presented at: Medical Imaging 2007: Image Processing2007.
7. Ruder S. An overview of multi-task learning in deep neural networks. arXiv preprint arXiv:170605098. 2017.
8. Tziortzi AC, Searle GE, Tzimopoulou S, et al. Imaging dopamine receptors in humans with [11C]-(+)-PHNO: dissection of D3 signal and anatomy. Neuroimage. 2011;54(1):264-277.
9. Lammertsma AA, Hume SP. Simplified reference tissue model for PET receptor studies. NeuroImage. 1996;4(3 Pt 1):153-158.
Figures