2419
Do you Agree? An Exploration of Inter-rater Variability and Deep Learning Segmentation Uncertainty1Athinoula A. Martinos Center for Biomedical Imaging, Boston, MA, United States, 2Harvard-MIT Division of Health Sciences and Technology, Cambridge, MA, United States, 3MGH and BWH Center for Clinical Data Science, Boston, MA, United States, 4Department of Magnetic Resonance, The First Affiliated Hospital of Zhengzhou University, Zhengzhou, China, 5Stephen E. and Catherine Pappas Center for Neuro-Oncology, Massachusetts General Hospital, Boston, MA, United States
Synopsis
The outlines of target structures on medical imaging can be highly ambiguous. The uncertainty about the “true” outline is evident in high inter-rater variability of manual segmentations. So far, no method is available to identify cases likely to exhibit a high inter-rater variability. Here, we demonstrate that ground truth independent uncertainty metrics extracted from a MC dropout segmentation model developed on labels of only one rater correlate with inter-rater variability. This relationship can be used to identify ambiguous cases and flag them for more detailed review supporting consistent and reliable patient evaluation in research and clinical settings.
Introduction
The ambiguity of segmentation of target structures on medical imaging, evident from high variability between the manual segmentations of human raters1 (inter-rater variability), imposes a huge challenge for reliable and consistent patient evaluation.2 Approaches to deal with the high inter-rater variability include semi-automatic evaluation tools to limit variability or using the consensus of labels from multiple raters. However, reads that require manual input are very labor intensive (particularly for tasks like tumor segmentation). While most Deep Learning models do not capture this inherent ambiguity well, Monte Carlo (MC) dropout networks allow to obtain reliable uncertainty information from their outputs.3 Here, we demonstrate that uncertainty metrics extracted from an MC dropout segmentation model harbor the potential to identify cases that are likely to show a high inter-rater variability and can therefore be used to re-direct additional effort to more ambiguous cases if needed.Methods
Dataset: The dataset consisted of imaging from two clinical trials at our institution (NCT00756106, NCT00662506) containing a total of 713 post-operative MRI visits from 54 patients newly diagnosed with glioblastoma.4 We used T1W pre- and post-contrast and T2W-FLAIR sequences (5 mm slice thickness, 1 mm interslice gap, 0.43 mm in-plane resolution for all three sequences). Manual ground truth segmentations of T2W-FLAIR hyperintensity were independently performed by expert raters from two different institutions (rater 1: full dataset; rater 2: first two pre-therapy visits of each patient).Image analysis: All images were registered to the T2W-FLAIR image of the respective visit5,6, and brain extraction7, N4 bias correction8 and z-score normalization were performed. Cases were split into training/validation/test datasets in a 0.6/0.2/0.2 ratio on the patient level such that all visits of one patient were in the same subset. The training/validation/test datasets consisted of the imaging of 34 (464)/ 9 (128) / 11 (119) patients (visits). We used the manual segmentations of rater 1 to train an MC dropout UNet with weighted categorical cross-entropy loss (pdropout = 0.2) to segment areas of T2W-FLAIR hyperintensity.3,9 To derive information about a model’s uncertainty, we sample ten segmentation outputs from the final MC dropout segmentation model. Uncertainty maps are derived as the voxelwise mean entropy over all ten samples. We compute the following three predictive uncertainty metrics previously described by Roy et al. that are independent of the ground truth10: mean uncertainty (over the segmented region), coefficient of variation (COV) (both increasing with increasing uncertainty), and mean pairwise Dice between binarized samples (decreasing with increasing uncertainty).
Results
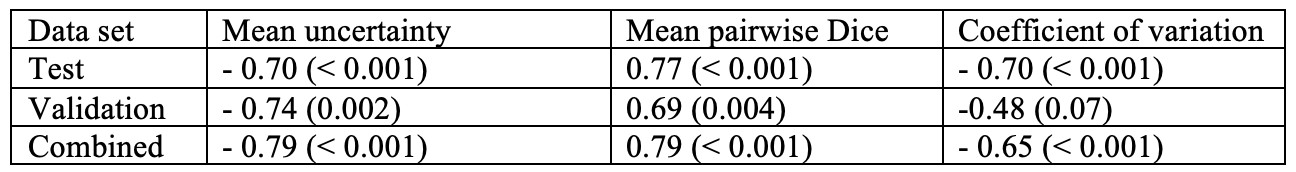
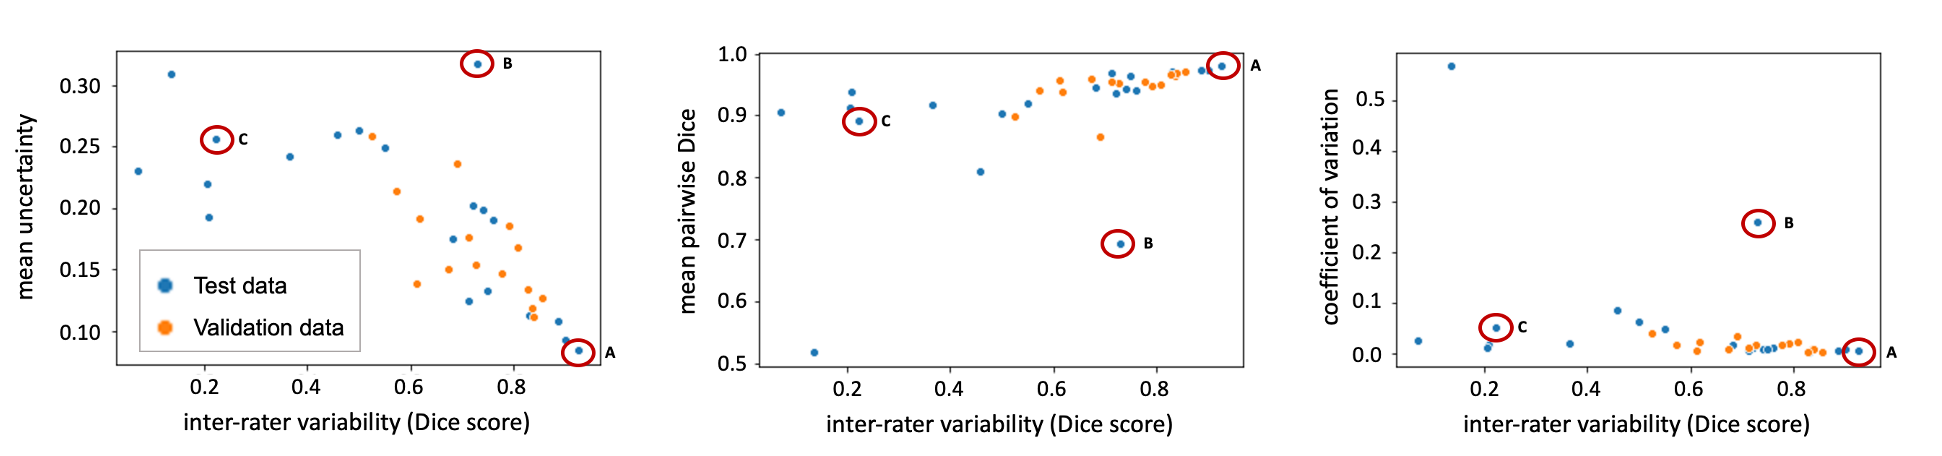
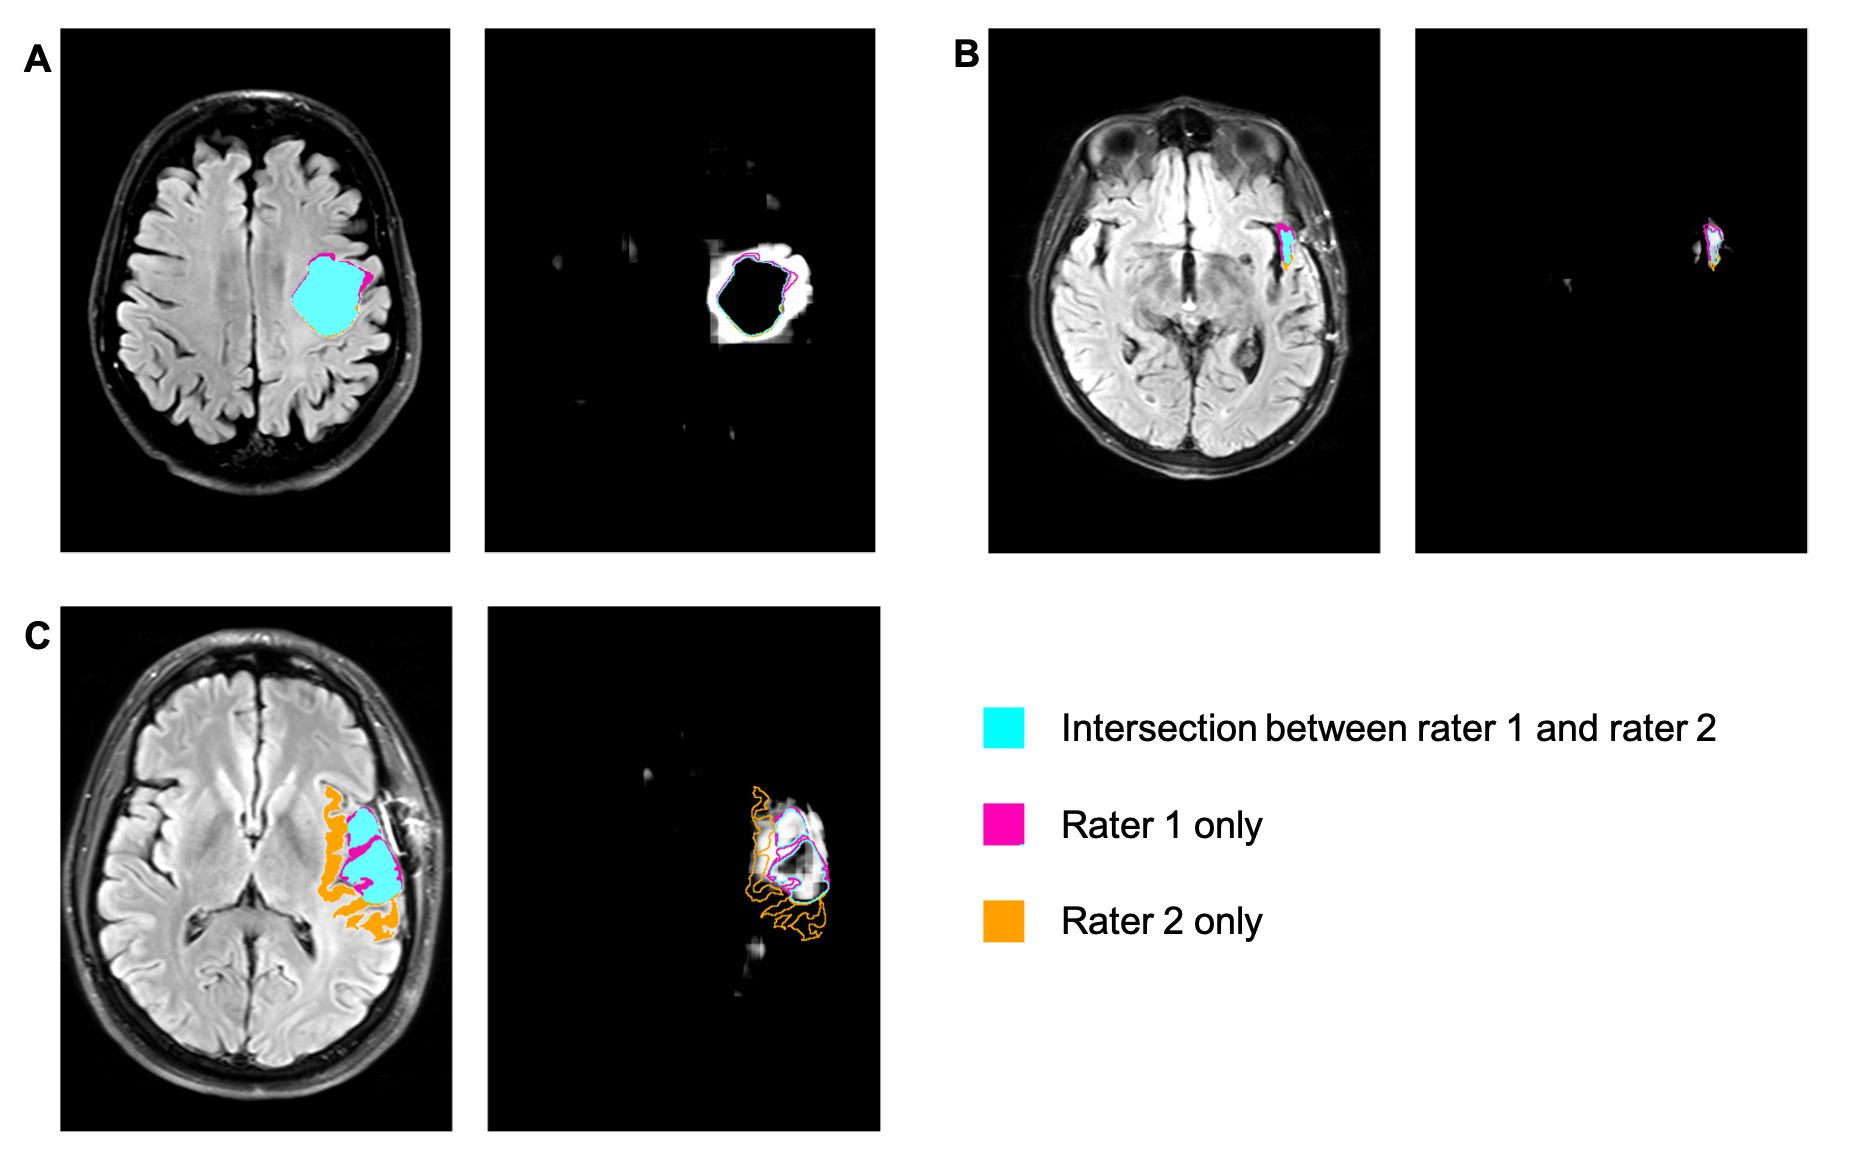
Evaluated on the manual ground truth of rater 1, the final MC dropout UNet trained on the manual labels of rater 1 achieves a mean Dice of 0.705 (heldout test set), which is comparable to previous work on T2W-FLAIR hyperintensity segmentation on imaging of post-operative GBM.11 The following analysis was limited to 35 cases in the validation and test datasets for which two independent manual segmentations of T2W-FLAIR hyperintensity were available: The mean Dice score between both raters on these cases was 0.63 (range: 0.07–0.92). Predictive uncertainty metrics for each case were computed based on the segmentation output of the MC dropout segmentation model as described previously.12 Figure 1 illustrates the relationship between the Dice score between both raters’ manual labels and the uncertainty metrics associated with the automatic segmentation for the same case. Spearman correlation coefficients between the inter-rater Dice score and mean uncertainty/mean pairwise Dice/COV were -0.79/0.79/-0.65 (p values: < 0.001) (Table 1). Figure 2 illustrates the disagreement between both raters and the uncertainty maps for three representative cases marked on the plots in Figure 1.Discussion
In this study, we have demonstrated a strong correlation between inter-rater variability and uncertainty associated with segmentation samples from an MC dropout model. Even though our segmentation model has been trained on the manual labels of only one rater without additional information about potential inter-rater variability, the uncertainty associated with its predictions correlates with the inter-rater variability between two raters from different institutions (Table 1, Figure 1). Our results indicate that MC dropout models can implicitly learn the level of ambiguity. This offers the potential to estimate expected inter-rater disagreement of single cases from only one set of annotations. One limitation of our study is the availability of only two separate annotations for a small subset of our dataset. Furthermore, the currently used uncertainty measures are affected by the performance of the underlying segmentation model. For case B (Figure 1), the uncertainty is quite high because the automatic segmentation failed (Dice score .0), while the inter-rater agreement is .73. This connection between the segmentation performance of a specific model and inter-rater variability should be further explored in future research.Conclusion
Here, we have demonstrated a connection between inter-rater variability and predictive uncertainty of an MC dropout segmentation model trained on only one set of annotations. This enables researchers to identify cases with an expected high inter-rater variability. Such cases can be flagged for more detailed review in order to limit the annotation burden for cases with low predicted inter-rater variability, thus supporting the redistribution of annotation efforts to more ambiguous cases. Additional research should be undertaken on the question of whether the same relationship exists between intra-rater variability and uncertainty metrics.Acknowledgements
This project was supported by a training grant from the NIH Blueprint for Neuroscience Research (T90DA022759/R90DA023427) and the National Institute of Biomedical Imaging and Bioengineering (NIBIB) of the National Institutes of Health under award number 5T32EB1680 to K. Chang and J. Patel. The content is solely the responsibility of the authors and does not necessarily represent the official views of the National Institutes of Health.
This study was supported by National Institutes of Health grants U01 CA154601, U24 CA180927, and U24 CA180918 to J. Kalpathy-Cramer.
We would like to acknowledge the GPU computing resources provided by the MGH and BWH Center for Clinical Data Science.
This research was carried out in whole or in part at the Athinoula A. Martinos Center for Biomedical Imaging at the Massachusetts General Hospital, using resources provided by the Center for Functional Neuroimaging Technologies, P41EB015896, a P41 Biotechnology Resource Grant supported by the National Institute of Biomedical Imaging and Bioengineering (NIBIB), National Institutes of Health.
References
1. Chisholm RA, Stenning S, Hawkins TD. The accuracy of volumetric measurement of high-grade gliomas. Clin Radiol. 1989;40(1):17-21. doi:10.1016/S0009-9260(89)80007-8 2. Provenzale JM, Ison C, DeLong D. Bidimensional measurements in brain tumors: Assessment of interobserver variability. Am J Roentgenol. 2009;193(6):515-522. doi:10.2214/AJR.09.2615 3. Gal Y, Ghahramani Z. Dropout as a Bayesian Approximation: Representing Model Uncertainty in Deep Learning. 2015;48. http://arxiv.org/abs/1506.02142. 4. Batchelor TT, Gerstner ER, Emblem KE, et al. Improved tumor oxygenation and survival in glioblastoma patients who show increased blood perfusion after cediranib and chemoradiation. Proc Natl Acad Sci. 2013;110(47):19059-19064. doi:10.1073/pnas.1318022110 5. Johnson H, Harris G, Williams K. BRAINSFit: mutual information rigid registrations of whole-brain 3D images, using the insight toolkit. Insight J. 2007;57(1):1-11. 6. Fedorov A, Beichel R, Kalpathy-Cramer J, et al. 3D Slicer as an image computing platform for the Quantitative Imaging Network. Magn Reson Imaging. 2012;30(9):1323-1341. doi:10.1016/j.mri.2012.05.001 7. Iglesias JE, Cheng-Yi Liu C-Y, Thompson PM, Zhuowen Tu Z. Robust Brain Extraction Across Datasets and Comparison With Publicly Available Methods. IEEE Trans Med Imaging. 2011;30(9):1617-1634. doi:10.1109/TMI.2011.2138152 8. Gorgolewski K, Burns CD, Madison C, et al. Nipype: A Flexible, Lightweight and Extensible Neuroimaging Data Processing Framework in Python. Front Neuroinform. 2011;5:13. doi:10.3389/fninf.2011.00013 9. Kendall A, Badrinarayanan V, Cipolla R. Bayesian SegNet: Model Uncertainty in Deep Convolutional Encoder-Decoder Architectures for Scene Understanding. 2015. http://arxiv.org/abs/1511.02680. 10. Roy AG, Conjeti S, Navab N, Wachinger C. Inherent brain segmentation quality control from fully convnet monte carlo sampling. Lect Notes Comput Sci (including Subser Lect Notes Artif Intell Lect Notes Bioinformatics). 2018;11070 LNCS:664-672. doi:10.1007/978-3-030-00928-1_75 11. Chang K, Beers AL, Bai HX, et al. Automatic assessment of glioma burden: a deep learning algorithm for fully automated volumetric and bidimensional measurement. Neuro Oncol. June 2019. doi:10.1093/neuonc/noz106 12. Hoebel K, Chang K, Patel J, Singh P, Kalpathy-Cramer J. Give me (un)certainty -- An exploration of parameters that affect segmentation uncertainty. November 2019. https://arxiv.org/abs/1911.06357. Accessed February 16, 2020.Figures