2412
Improving ASL MRI Sensitivity for Clinical Applications Using Transfer Learning-based Deep Learning
Danfeng Xie1, Yiran Li1, and Ze Wang1
1Department of Diagnostic Radiology and Nuclear Medicine, University of Maryland School of Medicine, Baltimore, MD, United States
1Department of Diagnostic Radiology and Nuclear Medicine, University of Maryland School of Medicine, Baltimore, MD, United States
Synopsis
This study represents the first effort to apply transfer learning of Deep learning-based ASL denoising (DLASL) method on clinical ASL data. Pre-trained with young healthy subjects’ data, DLASL method showed improved Contrast-to-Noise Ratio (CNR) and Signal-to-Noise Ratio (SNR) and higher sensitivity for detecting the AD related hypoperfusion patterns compared with the conventional method. Experimental results demonstrated the high transfer capability of DLASL for clinical studies.
Introduction
The use of deep learning in clinical medical imaging has been challenged by the lack of sufficient training data from patients. One solution is to train the model using data from normal healthy subjects which are more available and apply it to patients’ data. This transfer learning strategy has been widely used in computer vision and natural language processing [7-8] but remains scarce in translational neuroimaging. We recently developed a deep learning-based ASL MRI denoising network (DLASL) [3] with highly improved Cerebral Blood Flow (CBF) quantification results in normal healthy subjects. The purpose of this study was to evaluate the transfer capability of DLASL for probing the hypoperfusion patterns in Alzheimer’s disease (AD), which have been well-characterized in the frontal, temporal, and parietal regions. We hypothesize that DLASL will improve the sensitivity of ASL MRI for detecting the AD hypoperfusion patterns. Novelties of this study include: a new loss function, training DLASL in the native space rather than in the standard space, and the first demonstration of the transfer learning capability of DL in translational neuroimaging.Methods
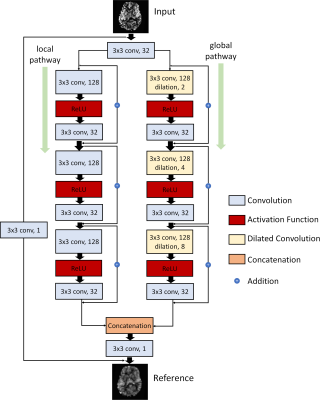
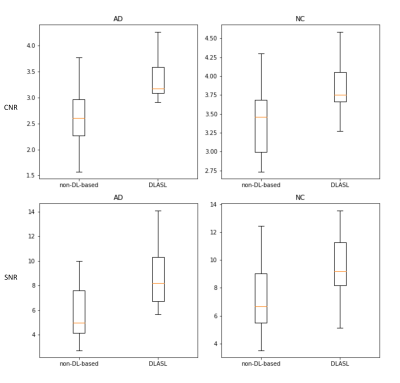
The same 2D pCASL data used in [3] were used for training DLASL. Cerebral blood flow (CBF) images were calculated using ASLtbx [6]. ASL Cerebral Blood Flow (CBF) image slices from 250 subjects were used as the training dataset. CBF image slices from 30 different subjects were used for validation. The model was trained using all the axial image slices, each with 64 x 64 pixels. The input to DLASL was the mean image of the first 10 CBF from the ASL sequence. The reference image was the mean image of all 40 CBF from the ASL sequence. The architecture of DLASL shown in Figure 1 had the following new modifications compared to the previous version [3]: 1) The current DLASL was trained in native space instead of MNI space. 2) the number of wide activation residual blocks was reduced to be 3 in each pathway to reduce the overfitting risk due to the smaller size of the input image in native space. 3) Huber loss was used because it is more robust to outliers than L2 loss while more precise and stable than L1 loss during the training.DLASL trained on the young healthy subjects’ data was applied to ASL MRI from a cohort of 21 AD and 24 NCs without fine-tuning with the new data. AD and NC’s data were acquired with the same pCASL sequence as in the healthy subjects’ data and were preprocessed in the same way as in [3]. For each subject, the mean CBF image input to DLASL to get the DL-denoised CBF map. CBF maps were spatially normalized into the MNI space. Contrast-to-Noise Ratio (CNR) and Signal-to-Noise Ratio (SNR) were used to quantitatively assess the image quality of ASL CBF obtained by different methods. SNR was calculated by using the mean signal of a grey matter (GM) region-of-interest (ROI) divided by the standard deviation of a white matter (WM) ROI in slice 50 of the MNI space. CNR was calculated as the mean value of GM masked area divided by the standard deviation of WM masked area from slices 8 to 12 in the native space. CBF images were spatially smoothed with a Gaussian filter (FWHM =5mm) to suppress residual inter-brain structural difference. Two-sample T-test was performed to assess the AD vs NC hypoperfusion.
Results
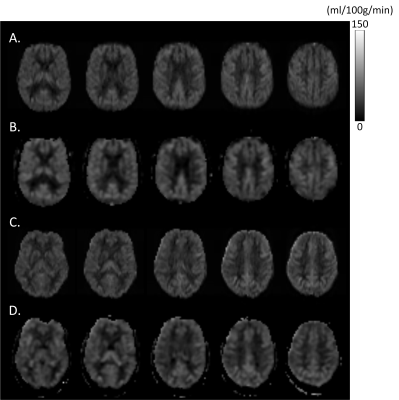
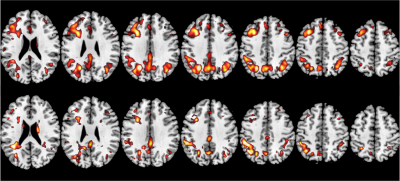
Figure 2 shows the data from a representative AD subject and NC subject. Figure 3 shows the box plot of CNR and SNR. DLASL achieved higher CNR and SNR in both AD and NC group than the non-DL-based method [5] (p<0.05). Figure 4 shows the resulting T map of two-sample T-test between AD and NC data using different processing methods (P< 0.001).Discussion
This study represents the first effort to apply transfer learning of DLASL method on clinical ASL data. Pre-trained with young healthy subjects’ data, DLASL showed improved CNR and SNR and higher sensitivity for detecting the AD related hypoperfusion patterns compared with the non-DL-based method [5]. These data clearly demonstrated the high transfer capability of DLASL for clinical studies though more evaluations should be performed when ASL MRI protocols are different.Acknowledgements
This research is supported by NIH/NIA grant: 1 R01 AG060054-01A1References
[1] Antun, Vegard, et al. "On instabilities of deep learning in image reconstruction and the potential costs of AI." Proceedings of the National Academy of Sciences (2020). [2] Huber, Peter J. "Robust estimation of a location parameter." Breakthroughs in statistics. Springer, New York, NY, 1992. 492-518. [3] Xie, Danfeng, et al. "Denoising arterial spin labeling perfusion MRI with deep machine learning." Magnetic Resonance Imaging 68 (2020): 95-105. [4] Shin, David D., et al. "Pseudocontinuous arterial spin labeling with optimized tagging efficiency." Magnetic resonance in medicine 68.4 (2012): 1135-1144.[5] Li, Yiran, et al. "Priors-guided slice-wise adaptive outlier cleaning for arterial spin labeling perfusion MRI." Journal of neuroscience methods 307 (2018): 248-253. [6] Wang, Ze, et al. "Empirical optimization of ASL data analysis using an ASL data processing toolbox: ASLtbx." Magnetic resonance imaging 26.2 (2008): 261-269. [7] Weiss, Karl, Taghi M. Khoshgoftaar, and DingDing Wang. "A survey of transfer learning." Journal of Big data 3.1 (2016): 9. [8] Tan, Chuanqi, et al. "A survey on deep transfer learning." International conference on artificial neural networks. Springer, Cham, 2018.Figures

Figure 1: Illustration of the architecture of the DLASL network. The output of the first layer was fed to both local pathway and global pathway. Each pathway contains 3 consecutive wide activation residual blocks. Each wide activation residual block contains two convolutional layers (3×3x128 and 3×3x32) and one activation function layer. The 3x3x128 convolutional layers in the global pathway were dilated convolutional layers with a dilation rate of 2, 4 and 8 respectively (a×b×c indicates the property of convolution. a×b is the kernel size of a filter and c is the number of the filters).

Figure 2: Mean CBF images of a representative AD subject (A and B) and a NC subject (C and D). A) and C) are the output of DLASL, B) and D) are results of the non-DL-based conventional processing method [5].

Figure 3: The box plot of the CNR (top row) and SNR (bottom row) from 21 AD subjects' CBF maps and 24 NC subjects' CBF maps with different processing methods.

Figure 4: The resulting T map of two-sample T-test (AD vs NC). The top row shows the results obtained by DLASL. The bottom row shows the results obtained by the non-DL-based conventional processing method[5]. From left to right: slices 95, 100, 105, 110, 115, 120 and 125. Display window: 4-6. P-value threshold is 0.001