2410
Deep Learning Pathology Detection from Extremely Sparse K-Space Data1Laboratory of Biomedical Imaging and Signal Processing, The University of Hong Kong, Hong Kong, China, 2Department of Electrical and Electronic Engineering, The University of Hong Kong, Hong Kong, China, 3Department of Electrical and Electronic Engineering, Southern University of Science and Technology, Shenzhen, China
Synopsis
Traditional MRI diagnosis consists of image reconstruction from k-space data and pathology identification in the image domain. In this study, we propose a strategy of direct pathology detection from extremely sparse MR k-space data through deep learning. This approach bypasses the traditional MR image reconstruction procedure prior to pathology diagnosis and provides an extremely rapid and potentially powerful tool for automatic pathology screening. Our results demonstrate that this new approach can detect brain tumors and classify their sizes and locations directly from single spiral k-space data with high sensitivity and specificity.
Introduction
Conventionally, MR images are first reconstructed from fully or partly sampled k-space data. Afterwards, pathologies are identified in the image domain. For ideal pathology screening, it is highly desirable to determine the pathology presence based on a few k-space points. In this study, we propose a new strategy for automatic pathology detection and classification (tumor presence, sizes and locations) directly from extremely sparse MR k-space data through deep learning. We demonstrate this concept by building deep learning-based models and simulated human brain tumor images.Method
K-space Data Preparation and Augmentation3D brain T2-weighted SPACE MR HCP datasets1 (with 0.7mm isotropic resolution) were used to evaluate the proposed strategy. The datasets were prepared as follows.
(1) 450 subjects were selected, 90 consecutive central axial magnitude images were extracted from each subject, then B1 inhomogeneity corrected and resized to 128×128 images.
(2) These 450 90-slice image datasets were randomly divided for training (315 subjects), validation (45 subjects) and testing (90 subjects).
(3) 315 datasets were augmented to 2520 datasets by 2D in-plane image translations/scaling.
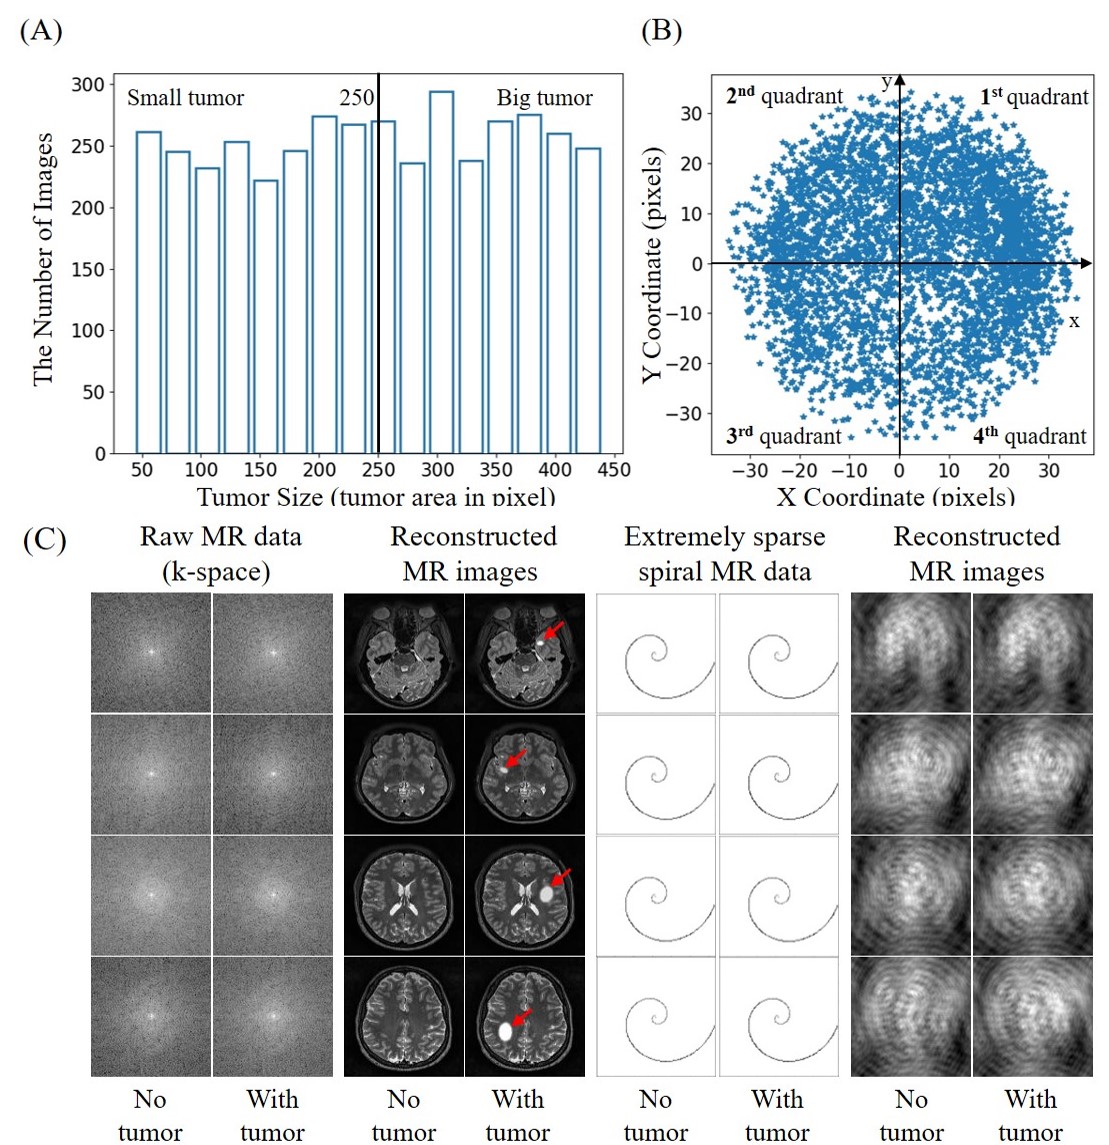
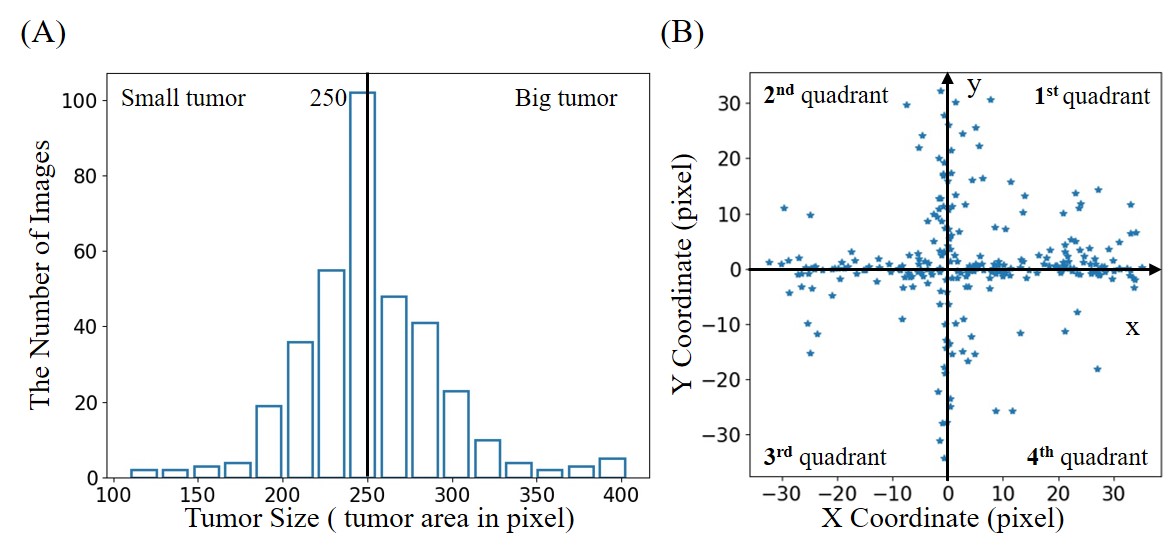
(4) Simulated tumors were added to 50% of these images with randomly defined location, size, shape and brightness. In brief, each tumor was synthesized by changing the signal intensity within an ellipse, with its short and long axis varying between 5% and 20% of the FOV. Its peak intensity was set to that of cerebrospinal fluid (CSF) region. The simulated tumor edge was then blurred with Gaussian smoothing to minimize distinct ringing in k-space2. Tumor sizes ranged from 32 to 452 pixels. They were classified into two groups with small and large tumors separated at 250 pixels, and 4 quadrant locations based on tumor center. Such size and location distributions are shown in Figures 1(A) and 1(B), respectively.
(5) Random and smooth 2D 2nd-order phase ranging from -π/2 to π/2 were added to these magnitude images, to simulate the complex images.
(6) These 2D complex images were retrospectively sampled with non-uniform FFT according to a single-shot spiral trajectory with 251 points, which only covered 1.5% full k-space. Figure 1(C) shows some sample images reconstructed by fully-sampled k-space data with/without simulated tumors, and the corresponding images reconstructed by extremely sparse k-space data using single-shot spiral acquisition.
ANN Model
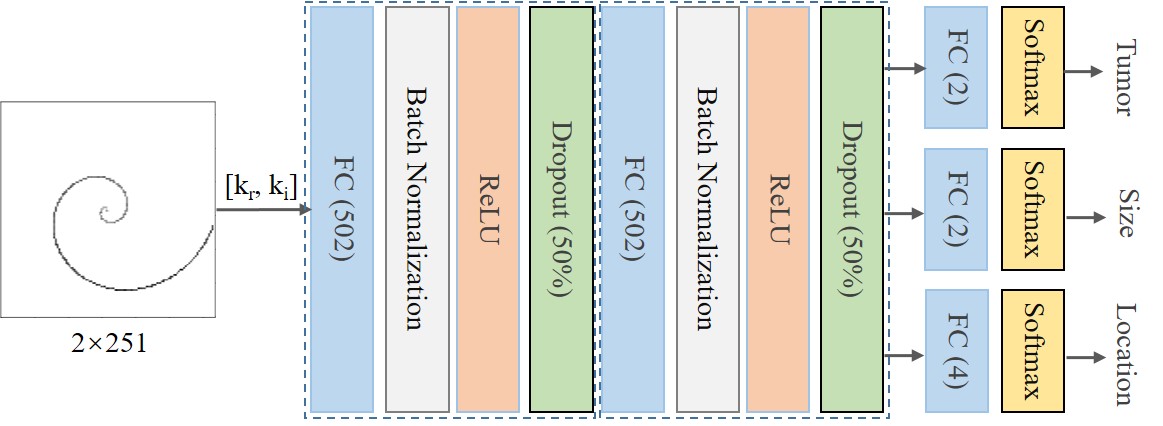
As illustrated in Figure 2, we designed an artificial neural network (ANN)3 that is composed of a series of fully connected layers for tumor detection and tumor size/location classification. The model input is a vector concatenated by the real and imaginary parts of complex k-space data, model outputs classify the presence of tumors, and the tumor size/location if tumor presents. The three tasks share the first two fully connected layers, and each task is followed by a batch normalization layer, a rectified linear unit layer and a dropout layer (50%). Besides, each task has its own fully connected layer and softmax layer for classification. Note that tumor size/location classifications are only conducted in presence of tumors. The model was trained using 226800 images with 50% tumor occurrence rate per image. Validation and testing were performed on 4050 and 8100 images, respectively. The training was carried out by optimizing the mean absolute error using Adam with a batch size of 256 and an initial learning rate of 2×10⁻⁴. After every 2 epochs, we reduced the learning rate by 20%. The total number of epochs was 50.
Results
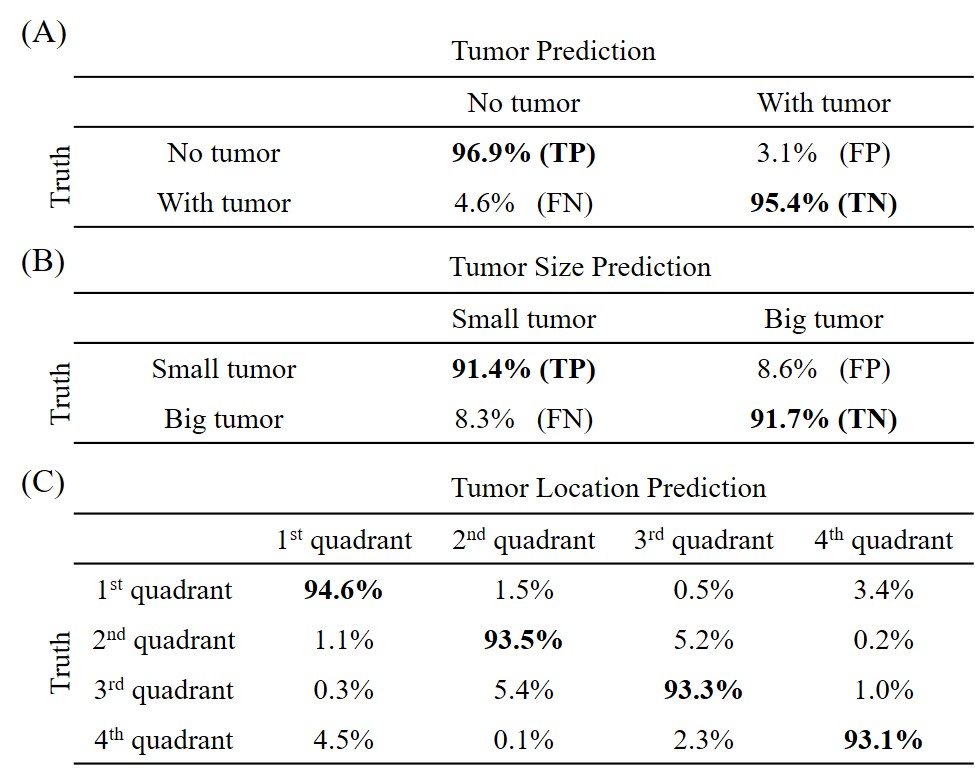
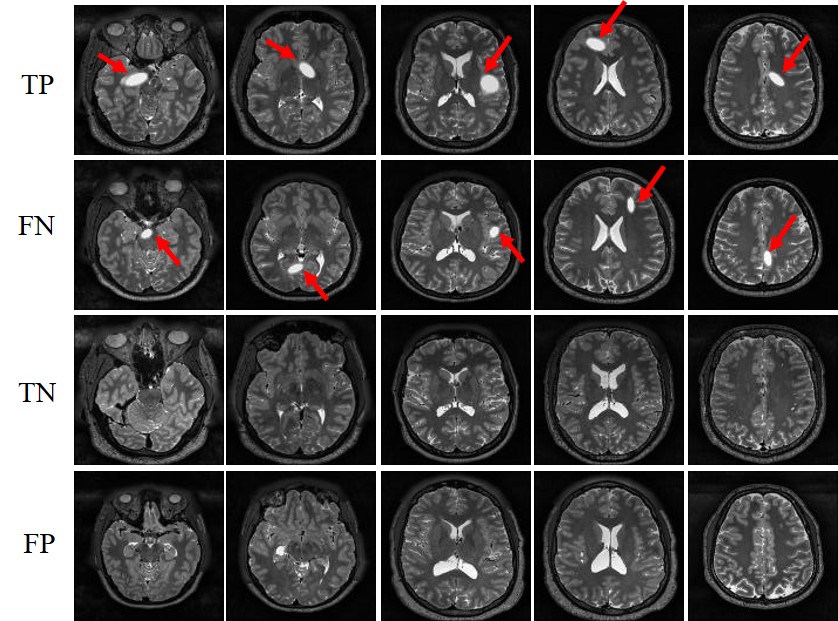
Figure 3 presents the prediction results of the detection model. The model yielded high sensitivities and specificities, clearly demonstrating the capability of the proposed strategy for direct tumor detection and tumor size/location classification from extremely sparse k-space data. Sample images with true positive (TP), false negative (FN), true negative (TN) and false positive (FP) for tumor detection are shown in Figure 4. As expected, the 3.1% FN cases mostly corresponded to the small tumors and the 4.6% FP cases mostly occurred in images with structures resembling simulated tumors, e.g., CSF. Figure 5 shows the tumor size and location distribution of wrongly classified cases. Their occurrence rates were relatively low, i.e., 8.5% and 6.4%, respectively (corresponding to 345 and 260 images out of 4076 tumor-containing images). Note that these wrongly classified cases mostly happened around the tumor size or location classification thresholds as expected. These results also clearly indicated the possibility to further improve the tumor size/location prediction accuracy through optimizing the ANN design shown in Figure 2.Discussion and Conclusions
This study presents a new MR diagnostic paradigm where pathology detection is performed directly from extremely sparse k-space data (e.g. single-shot spiral data that covers 1.5% k-space). Further studies are warranted in the following aspects: (1) optimization of extremely sparse k-space trajectory in terms of practical acquisition and pathology detection accuracy; (2) exploration of other sparse and simple k-space trajectories, such as radial trajectory; (3) model improvement for tumor size and location prediction more specific than in the present study; (4) model implementation to handle 3D data; and (5) use of more realistic pathology or tumor models4 and incorporation of clinical tumor-containing images through transfer learning5. In summary, our proposed approach presents an alternative MR diagnostic paradigm that can lead to potentially powerful tools for efficient and effective pathology screening.Acknowledgements
This study was supported by Hong Kong Research Grant Council (R7003-19, C7048-16G, HKU17112120, HKU17103819 and HKU17104020), Guangdong Key Technologies for Treatment of Brain Disorders (2018B030332001), and Guangdong Key Technologies for Alzhemier’s Disease Diagnosis and Treatment (2018B030336001).References
1. Van Essen, D.C., Smith, S.M., Barch, D.M., Behrens, T.E., Yacoub, E., Ugurbil, K. and Wu-Minn HCP Consortium. The WU-Minn human connectome project: an overview. Neuroimage, 2013; 80, 62-79.
2. Xiao, L., Liu, Y., Zeng, P., Lyu, M., Ma, X., Leong, T. L & Wu, E. X. Direct pathology detection and characterization from MR k-space data using deep learning. In: Proceedings of the 28th Annual Meeting of ISMRM, Virtual Conference, 2020.
3. Wang, H., Shi, H., Lin, K., Qin, C., Zhao, L., Huang, Y., & Liu, C. A high-precision arrhythmia classification method based on dual fully connected neural network. Biomedical Signal Processing and Control.2020.
4. Lindner, L., Pfarrkirchner, B., Gsaxner, C., Schmalstieg, D. and Egger, J. TuMore: generation of synthetic brain tumor MRI data for deep learning based segmentation approaches. Medical Imaging: Imaging Informatics for Healthcare, Research, and Applications. 2018.
5. Knoll, F., Hammernik, K., Kobler, E., Pock, T., Recht, M. P., & Sodickson, D. K. Assessment of the generalization of learned image reconstruction and the potential for transfer learning. Magnetic resonance in medicine. 2019; 81(1), 116-128.
Figures