2409
Using uncertainty estimation to increase the robustness of bone marrow segmentation in T1-weighted Dixon MRI for multiple myeloma1School of Biomedical Engineering & Imaging Sciences, King's College London, London, United Kingdom, 2Biomedical Engineering and Medical Physics, University College London, London, United Kingdom, 3Radiology, Guy’s and St Thomas’ Hospitals, London, United Kingdom, 4Siemens Healthcare Limited, Frimley, United Kingdom
Synopsis
Reliable skeletal segmentation of T1-weighted Dixon MRI is a first step towards measuring marrow fat-fraction as a surrogate metric for early marrow infiltration. We proposed an uncertainty-aware 2D U-Net (uU-Net) to reduce the impact of noisy ground-truth labels on segmentation accuracy. Five-fold cross-validation on a dataset of 30 myeloma patients provided a mean ± SD Dice coefficient of 0.74 ± 0.03 (vs. 0.73 ± 0.04, U-Net) and 0.63 ± 0.03 (vs 0.62 ± 0.04, U-Net) for pelvic and abdominal stations, respectively. Of clinical importance, improved segmentation of the ilium and vertebrae were achieved.
Introduction
Multiple myeloma is a debilitating bone marrow cancer characterised by clonal plasma cells 1. 140,000 new cases are diagnosed worldwide each year with 106,000 deaths 2. Whole-body magnetic resonance imaging (WBMRI) is recognized to be a highly sensitive test; more than one ≥5mm MRI lesion is a myeloma defining event by International Myeloma Working Group diagnostic criteria 3. However, focal bone destruction is a late finding in disease evolution and predated by marrow infiltration. Earlier detection of marrow infiltration on imaging is a clinical gap towards earlier treatment and better outcomes.Reliable whole-body skeletal segmentation of T1-weighted Dixon gradient-echo images is the first step to measuring marrow fat-fraction as a surrogate metric for marrow infiltration. However, manual segmentation of the skeleton is tedious and subject to inter-and intra-observer variation. Machine learning-based algorithms could be trained for automated fast segmentation, but variable annotation quality (noisy labels) can affect segmentation accuracy with the potential loss of clinically relevant information. We propose an uncertainty-aware 2D U-Net for skeletal marrow segmentation that compensates for noisy ground-truth, improving network performance.
Methods
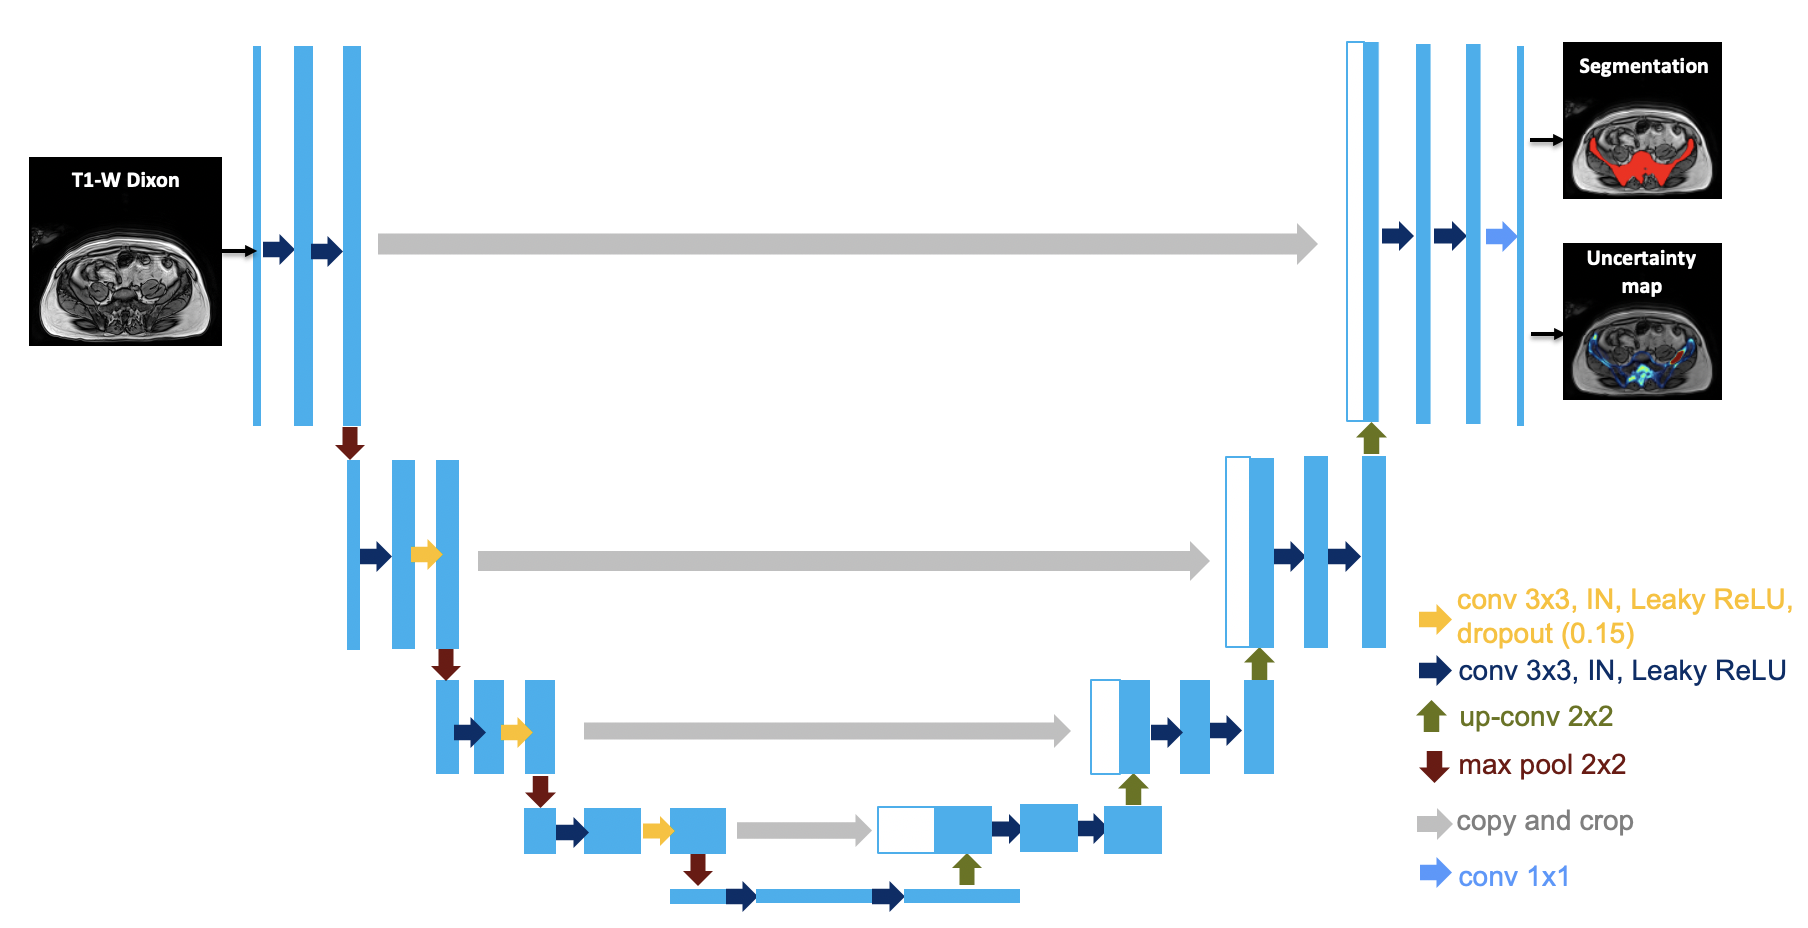
Following institutional review board approval and informed consent, 30 participants with suspected/confirmed myeloma underwent 1.5T whole-body MRI from skull vertex to knees in 5 stations (Magnetom Aera, Siemens Healthineers, Erlangen, Germany). Ground truth skeletal segmentation was performed by two radiologists using axial T1-weighted Dixon gradient-echo images (TR=6.62ms; TE=4.77, 2.39ms; flip angle 10°; NEX=1; FOV 500mm; reconstructed matrix 640, reconstructed voxels=0.8x0.8mm, reconstructed slice thickness=5mm).We proposed an uncertainty-aware 2D U-Net (uU-Net) (Figure 1). More specifically, three dropout layers with a dropout probability of 15% were added in the intermediate layers of the encoder side of the network. Instance normalization and leaky ReLU was used. Random translate, rotation, and elastic transformation with a horizontal flip were used for data augmentation.
The network was simultaneously trained to output both the logit ($$$f^{W}$$$) and variance ($$$(\sigma^{W})^{2}$$$). To compute the loss function, $$$f^{W}$$$ was corrupted with Gaussian noise with mean 0 and variance $$$(\sigma^{W})^{2}$$$ T times and passed through a sigmoid function to compute the set of corrupted probability maps $$$\hat{Y}=(\hat{Y}_{1},\hat{Y}_{2},...,\hat{Y}_{T})$$$ 5.The final loss was the mean of the binary cross-entropy loss computed between each $$$\hat{Y}_{t} (t=1,...T)$$$ and the ground truth.
At inference time, for each input image, T probability and variance maps were generated by means of the Monte Carlo dropout method and the final binary segmentation was computed as the mean of the T probability maps, thresholded at 0.5. Aleatoric and epistemic uncertainty maps were calculated as the mean and variance of the T variance maps. The total uncertainty map was computed as the sum of aleatoric and epistemic uncertainties. T = 20 was set in the experiment.
The performance of our proposed uU-Net for segmenting abdominopelvic stations was compared to the performance of a 2D U-Net (U-Net) with the same architecture as uU-Net but without the uncertainty estimation. Dice coefficient (DSC) was used to assess the accuracy of each generated segmentation. Five-fold cross-validation was employed and the Wilcoxon signed-rank test was used to assess whether the mean DSC of the two approaches differed.
Results
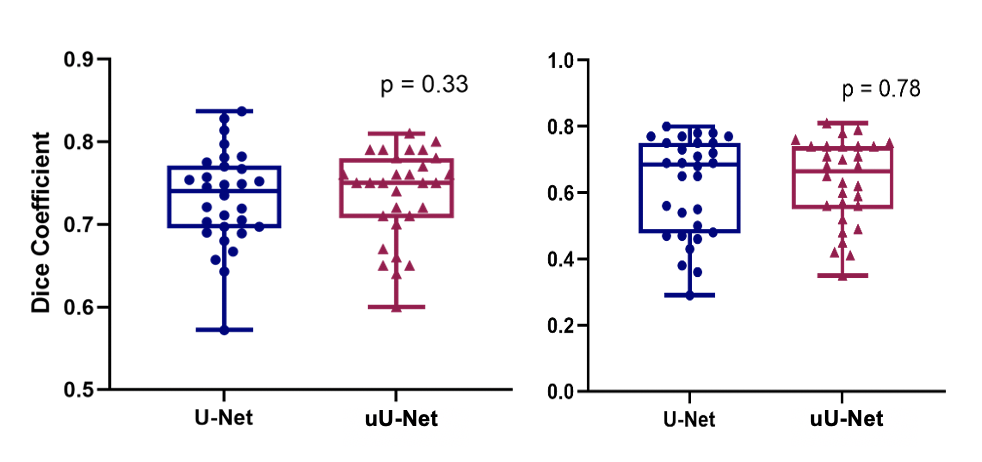
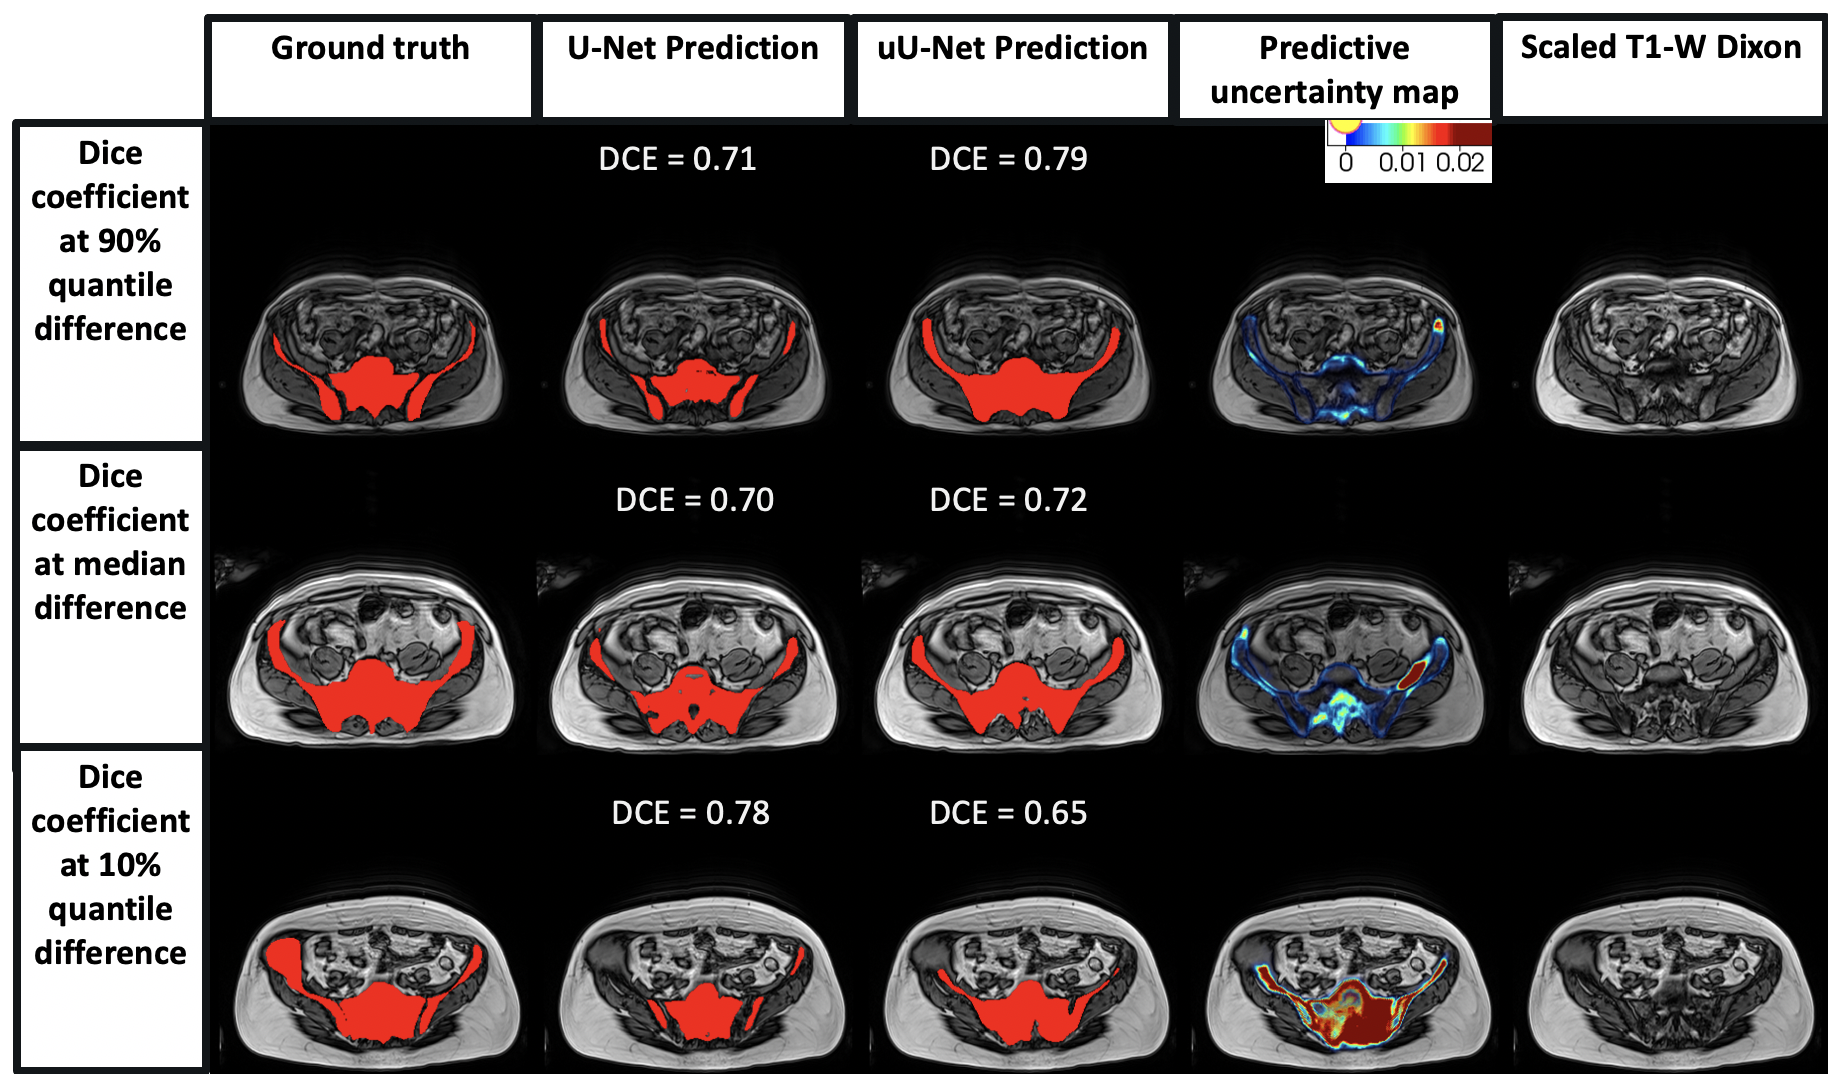
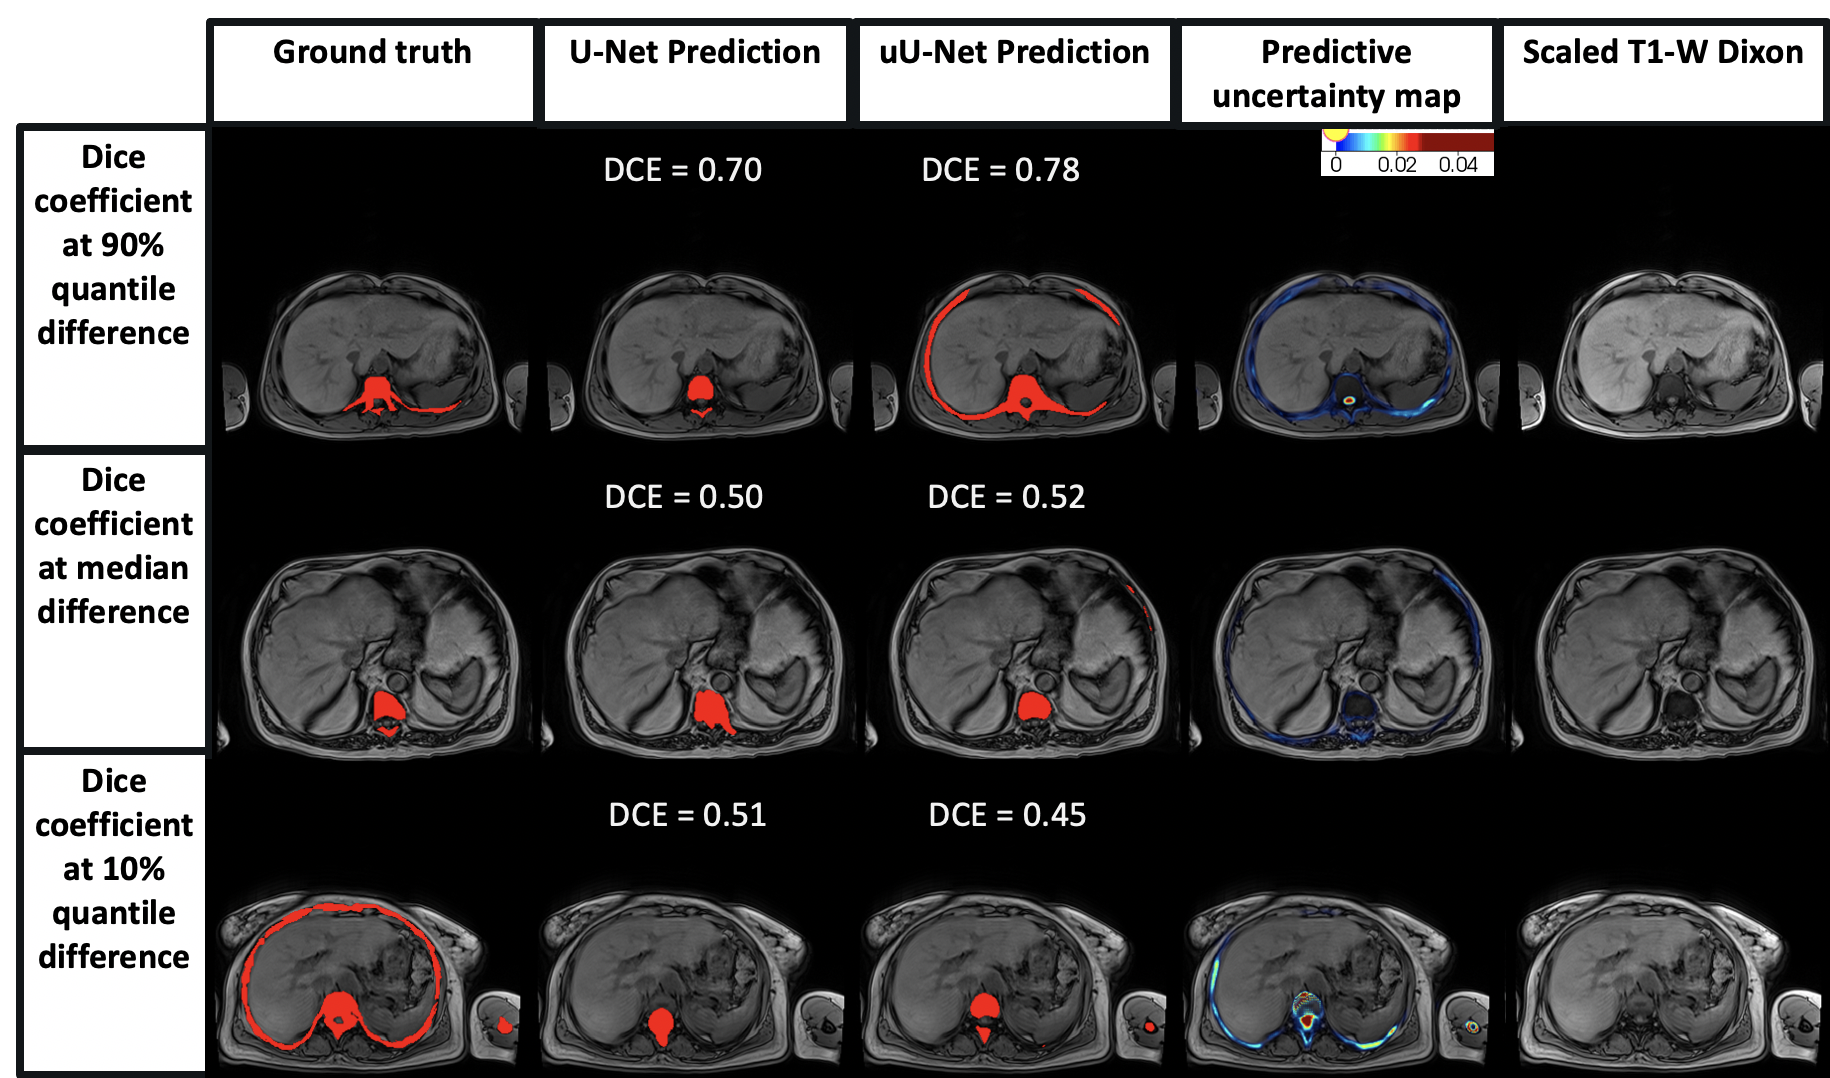
A mean ± standard deviation (SD) DSC of 0.73 ± 0.04 and 0.74 ± 0.03 was obtained for the pelvic station; and 0.62 ± 0.04 and 0.63 ± 0.03 for the abdominal station, for U-Net and uU-Net, respectively.The box plot of DSC distribution for U-Net and uU-Net is shown in Figure 2. The median (IQR) was 0.74 (0.70, 0.77) and 0.75 (0.71, 0.78), respectively for the pelvic station and 0.69 (0.48, 0.75) and 0.67 (0.56, 0.74), respectively for the abdominal station.There was no significant difference in the two DSC mean distributions (Wilcoxon signed-rank test, p=0.33; p=0.78). Predicted segmentation and uncertainty maps are shown in Figures 3 and 4.
Discussion
Improvement in mean DSC using uncertainty estimates was observed with uU-Net with a narrower range, though this was not statistically significant. This obscures the finding that more accurate segmentation was achieved for the ilium and vertebrae in all patients, which is clinically important.However, in some patients, over-segmentation of some areas (e.g., incorporation of the sacroiliac joint and sacral foramina) and under-segmentation (e.g., exclusion of ribs) remained. These segmentation errors in part reflect the observer variation in ground-truth labelling, which the predictive uncertainty maps can highlight. By providing a representation of segmentation variance in the training ground truth, expert or machine learning-based modifications can be made to labels to improve network performance.
Nevertheless, there are limitations. First, related to variation-based uncertainty measurement was that the scale was underestimated with predicted pixel values close to either 0 or 1 in T probability maps. Entropy-based estimates could be compared as the next step. Second, related to sample size, though data augmentation and dropout were employed to improve this.
Conclusion
There is a need to improve segmentation robustness. We have proposed an uncertainty-aware 2D U-Net highlighting regional bias in the ground truth. This will allow further refinement of segmentation in high uncertainty regions to improve network performance.Acknowledgements
This work was supported by the EPSRC Centre for Doctoral Training in Medical Imaging (EP/L015226/1).References
1. Rajkumar SV. Multiple myeloma: 2020 update on diagnosis, risk-stratification and management. Am J Hematol 2020;95(5):548-567.
2. Cowan AJ, Allen C, Barac A, et al. Global Burden of Multiple Myeloma: A Systematic Analysis for the Global Burden of Disease Study 2016. JAMA Oncol 2018;4(9):1221-1227.
3. Rajkumar SV, Dimopoulos MA, Palumbo A, et al. International Myeloma Working Group updated criteria for the diagnosis of multiple myeloma. The Lancet Oncology 2014;15(12):e538-548.
4. Ronneberger O, Fischer P, Brox T. U-net: Convolutional networks for biomedical image segmentation. Lecture Notes in Computer Science (including subseries Lecture Notes in Artificial Intelligence and Lecture Notes in Bioinformatics), vol. 9351, Springer Verlag. 2015; p. 234–41.
5. Kendall A, Gal Y. What Uncertainties Do We Need in Bayesian Deep Learning for Computer Vision? Advances in Neural Information Processing Systems. 2017; 5575-5585.
6. Eaton-Rosen Z, Bragman F, Bisdas S, Ourselin S, Cardoso M. Towards safe deep learning: Accurately quantifying biomarker uncertainty in neural network predictions. Lecture Notes in Computer Science (including subseries Lecture Notes in Artificial Intelligence and Lecture Notes in Bioinformatics). 2018; 691-699.
Figures