2406
A fully automated framework for intracranial vessel wall segmentation based on 3D black-blood MRI1Center for Biomedical Imaging Research, School of Medicine, Tsinghua University, Beijing, China, 2Department of Radiology, Sun Yat-Sen Memorial Hospital, Sun Yat-Sen University, Guangzhou, China, 3Department of Radiology, University of Washington, Seattle, WA, United States
Synopsis
Intracranial atherosclerosis is a major cause of stroke worldwide. Vessel wall quantitative measurement is an essential tool for plaque analysis, while manual vessel wall segmentation is time-consuming and costly. In this study, we proposed a fully automated vessel wall segmentation framework for intracranial arteries using only 3D black-blood MRI, in which 3D lumen segmentation and skeletonization were applied to locate the arteries of interest for further 2D vessel wall segmentation. It achieved high segmentation performance for both normal (DICE=0.941) and stenotic (DICE=0.922) vessel wall and provided a promising tool for quantitative intracranial atherosclerosis analysis in large population studies.
Introduction
Intracranial atherosclerosis is a major cause of stroke occurrence and recurrence worldwide1, 2. The 3D black-blood vessel wall Magnetic Resonance imaging (MRI) techniques, such as the Volume Isotropic Turbo spin echo Acquisition (VISTA) sequence, allow for visualization of the intracranial vessel wall with high resolution3, 4. And the vessel wall segmentation is a key step in quantitative plaque burden assessment. Recent studies have demonstrated the feasibility of automatic carotid5 and popliteal6 vessel wall segmentation on 3D black-blood MRI. Shi et al.7 developed an intracranial vessel wall segmentation method on 2D cross-sectional slices generated with manual intervention; Wan et al.8 proposed an automated framework to analyze 3D intra- and extracranial arterial vessel wall images which relied on the centerline extracted from time-of-flight MR angiogram (TOF MRA) and suffered from registration. An efficient automatic segmentation tool for 3D intracranial black-blood vessel wall imaging has not been proposed.This study aimed to develop a fully automated intracranial vessel wall segmentation framework only based on 3D black-blood images, in which 3D lumen segmentation and skeletonization were applied to locate the arteries of interest for further 2D vessel wall segmentation.
Methods
Data Acquisition and Image ReviewWith the approval of institutional review board, fifty healthy volunteers (Healthy G1) and three patients with intracranial arterial stenosis (Stenosis G2) were imaged with T1-weighted VISTA (T1-VISTA) sequence on a 3T scanner (Achieva CX, Philips Healthcare, The Netherlands) using a 32-channel head coil, with a spatial resolution of 0.6 mm isotropic. Fifty healthy subjects were randomly separated as the training and evaluation set (80%, 40/50) and the testing set (20%, 10/50). Only images of healthy volunteers were used for neural network training. For each subject in the healthy group, lumen and outer wall boundaries of intracranial arteries, including basilar artery, bilateral M1, A1, and P1 segments, were outlined manually by three trained reviewers using a custom-designed software 3D CASCADE. For the patients, only the stenotic segments were analyzed, which were used to further validate the performance of the segmented network.
The Proposed Fully Automated Segmentation Framework
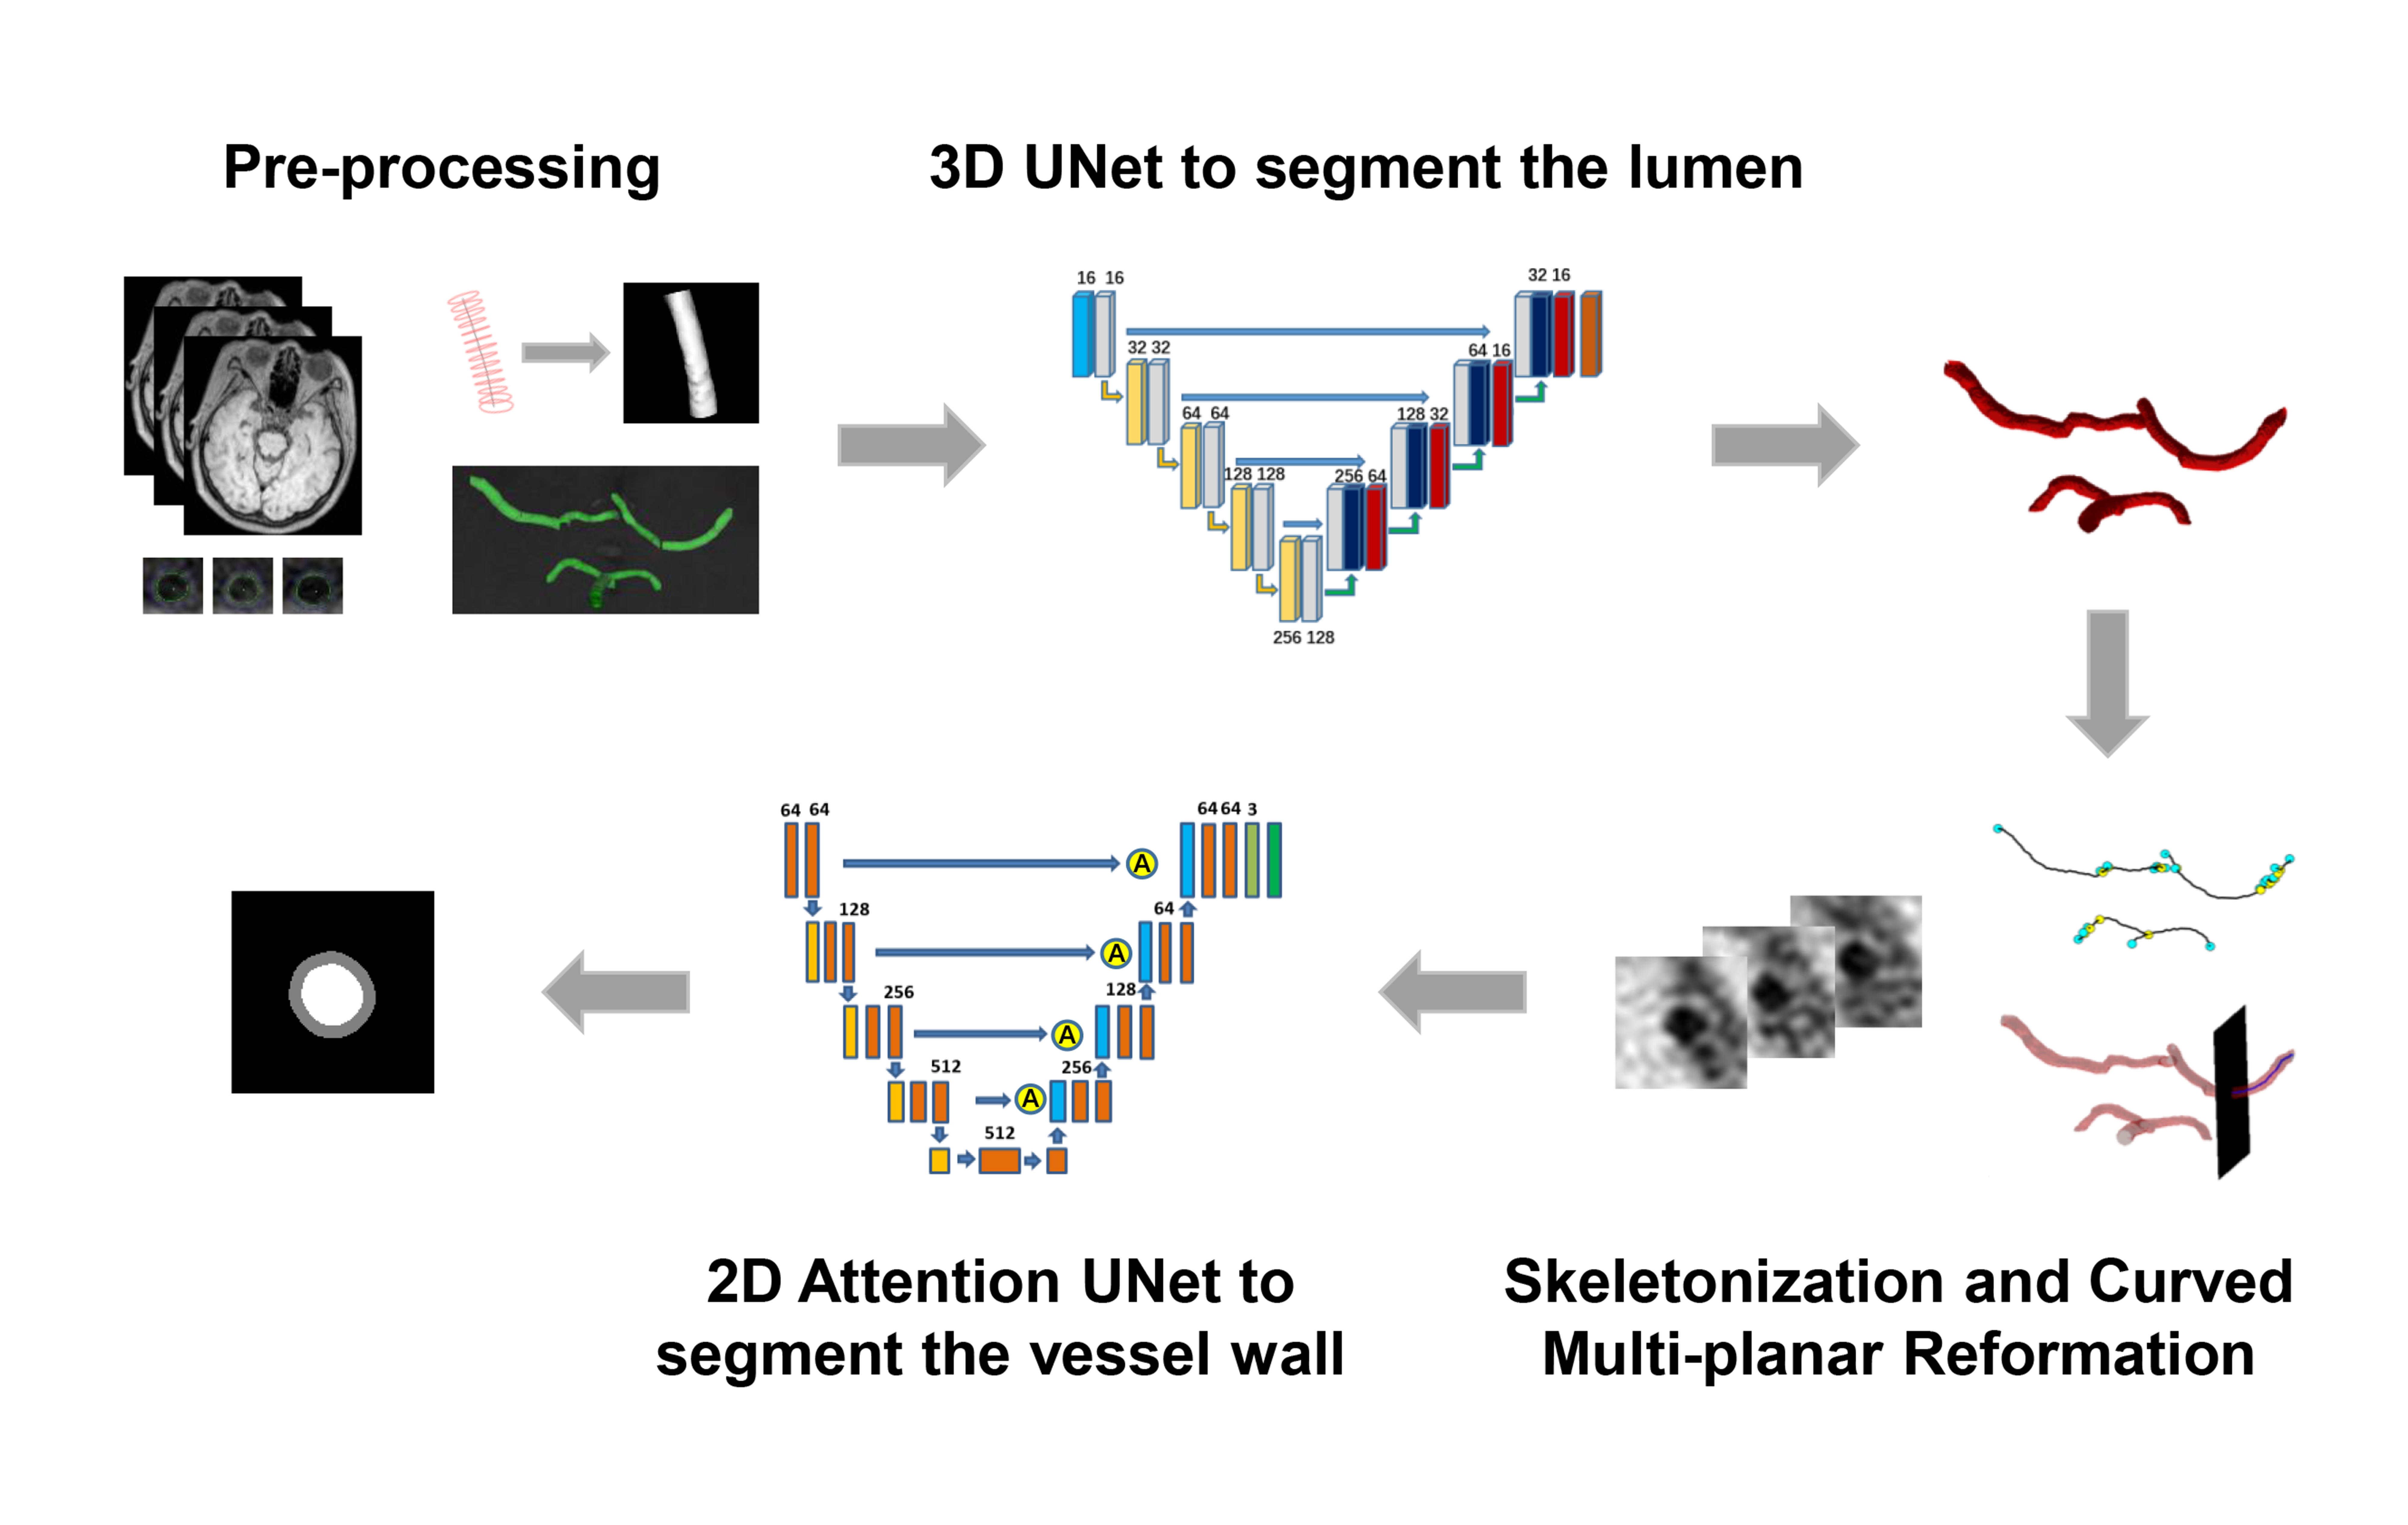
The workflow of the proposed fully automated vessel wall segmentation framework was shown in Figure 1. A two-step framework was adopted, including 3D lumen segmentation and 2D vessel wall segmentation.
A 3D UNet9 (Figure 1) was applied to lumen segmentation, which adopted instance normalization and Leaky ReLUs instead of ReLUs. A cubic sliding window of 128x128x128 with half-size overlapping along three directions was used to generate patches, and only the patches including labeled arteries were used for training. The loss function was defined as the sum of cross-entropy loss and dice loss. In the inference phase, the test images were cut into patches in the same way with training data and fed into the trained 3D UNet. The output of the overlapped voxels was calculated as the averaged probability.
With the segmented 3D lumen, an automatic skeletonization algorithm10 was applied to extract the vascular centerline and a series of 2D VISTA cross-sectional slices perpendicular to the centerline were generated. Then, a 2D attention UNet11 (Figure 1) was applied for further vessel wall segmentation. The loss function was defined as the sum of lumen dice loss and wall dice loss. Elastic deformation was used in data augmentation to simulate the possible vessel wall abnormality in atherosclerosis. A conditional random field (CRF) model12 was adopted to remove small isolated regions in the post-processing.
Performance Evaluation
The performance of 3D lumen and 2D vessel wall segmentation was evaluated by comparing the automatically segmented results with the manual labels using sensitivity (Sen), specificity (Spe), precision (Prec), dice coefficient (DICE), and intersection-over-union (IoU). Agreement of the vascular morphological measurements, including lumen area, wall area, and normalized wall index (NWI) between manual and automatic 2D segmentation results, was evaluated using Pearson’s correlation coefficient (R).
Results
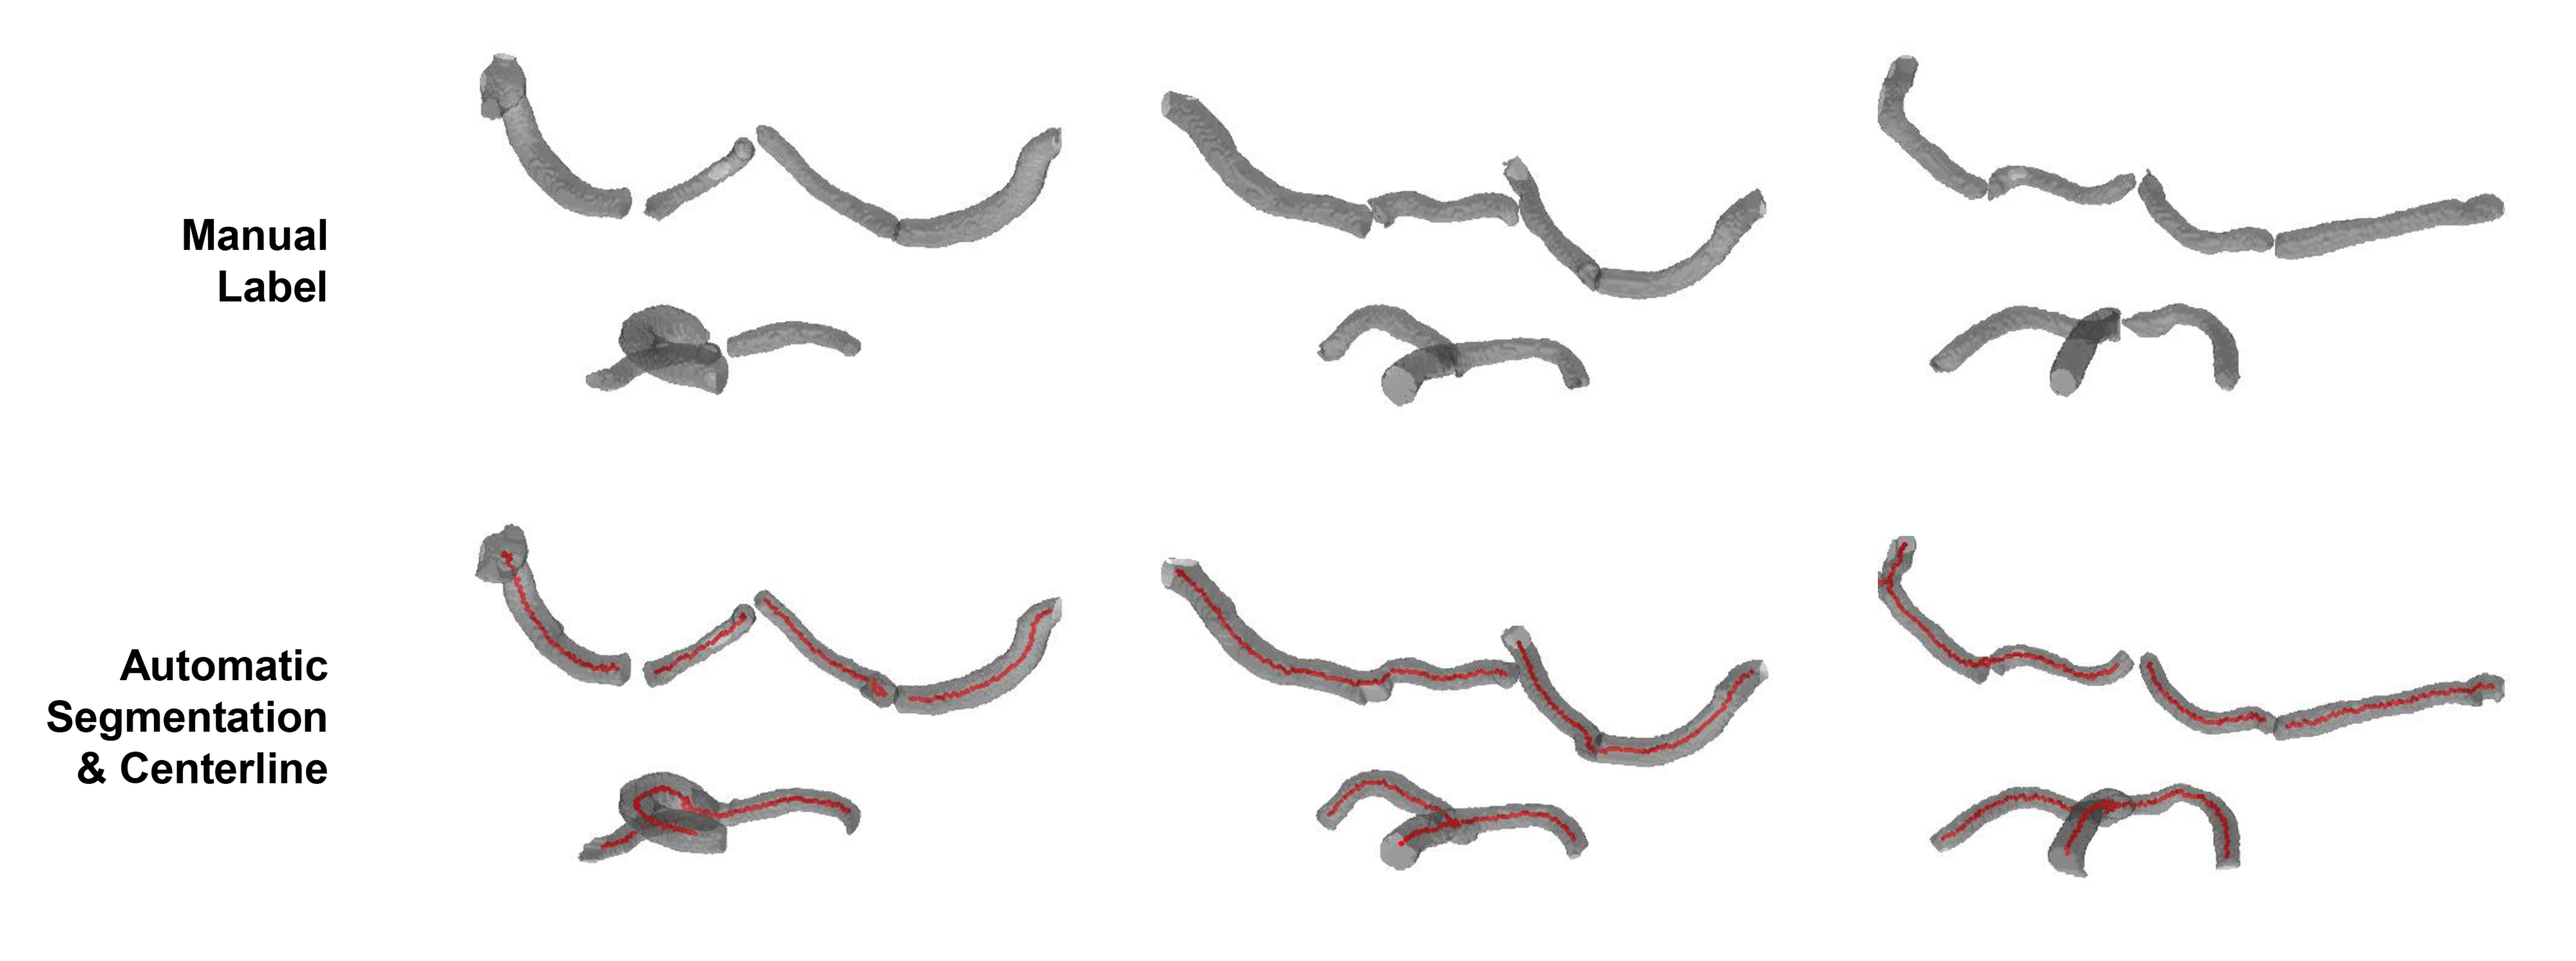
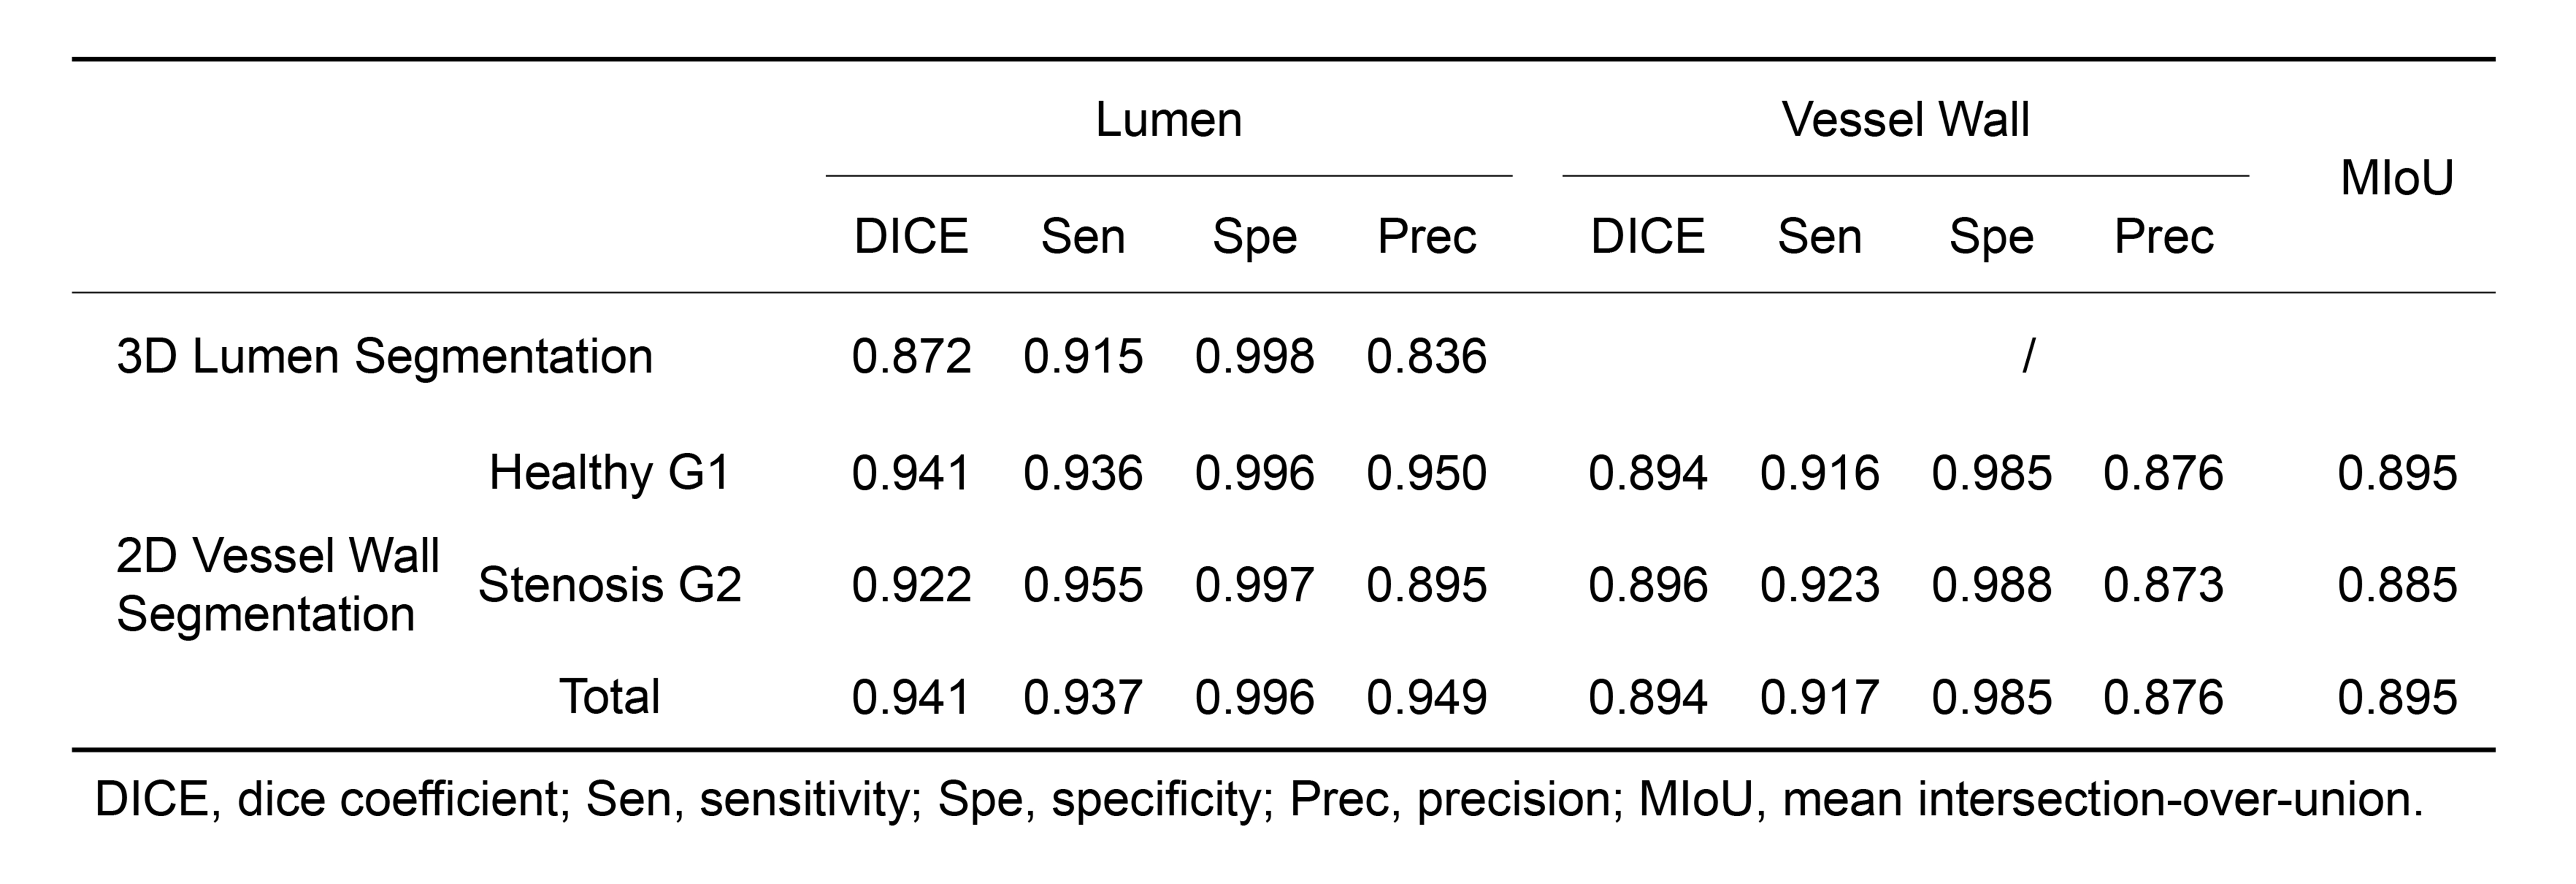
Lumen segmentation performanceFigure 2 showed three examples of the lumen segmentation results with manual labels as reference. Visual inspection showed that the blood vessels were well segmented. The 3D lumen segmentation achieved DICE of 0.872, and other quantitative performance assessments were presented in Table 1.
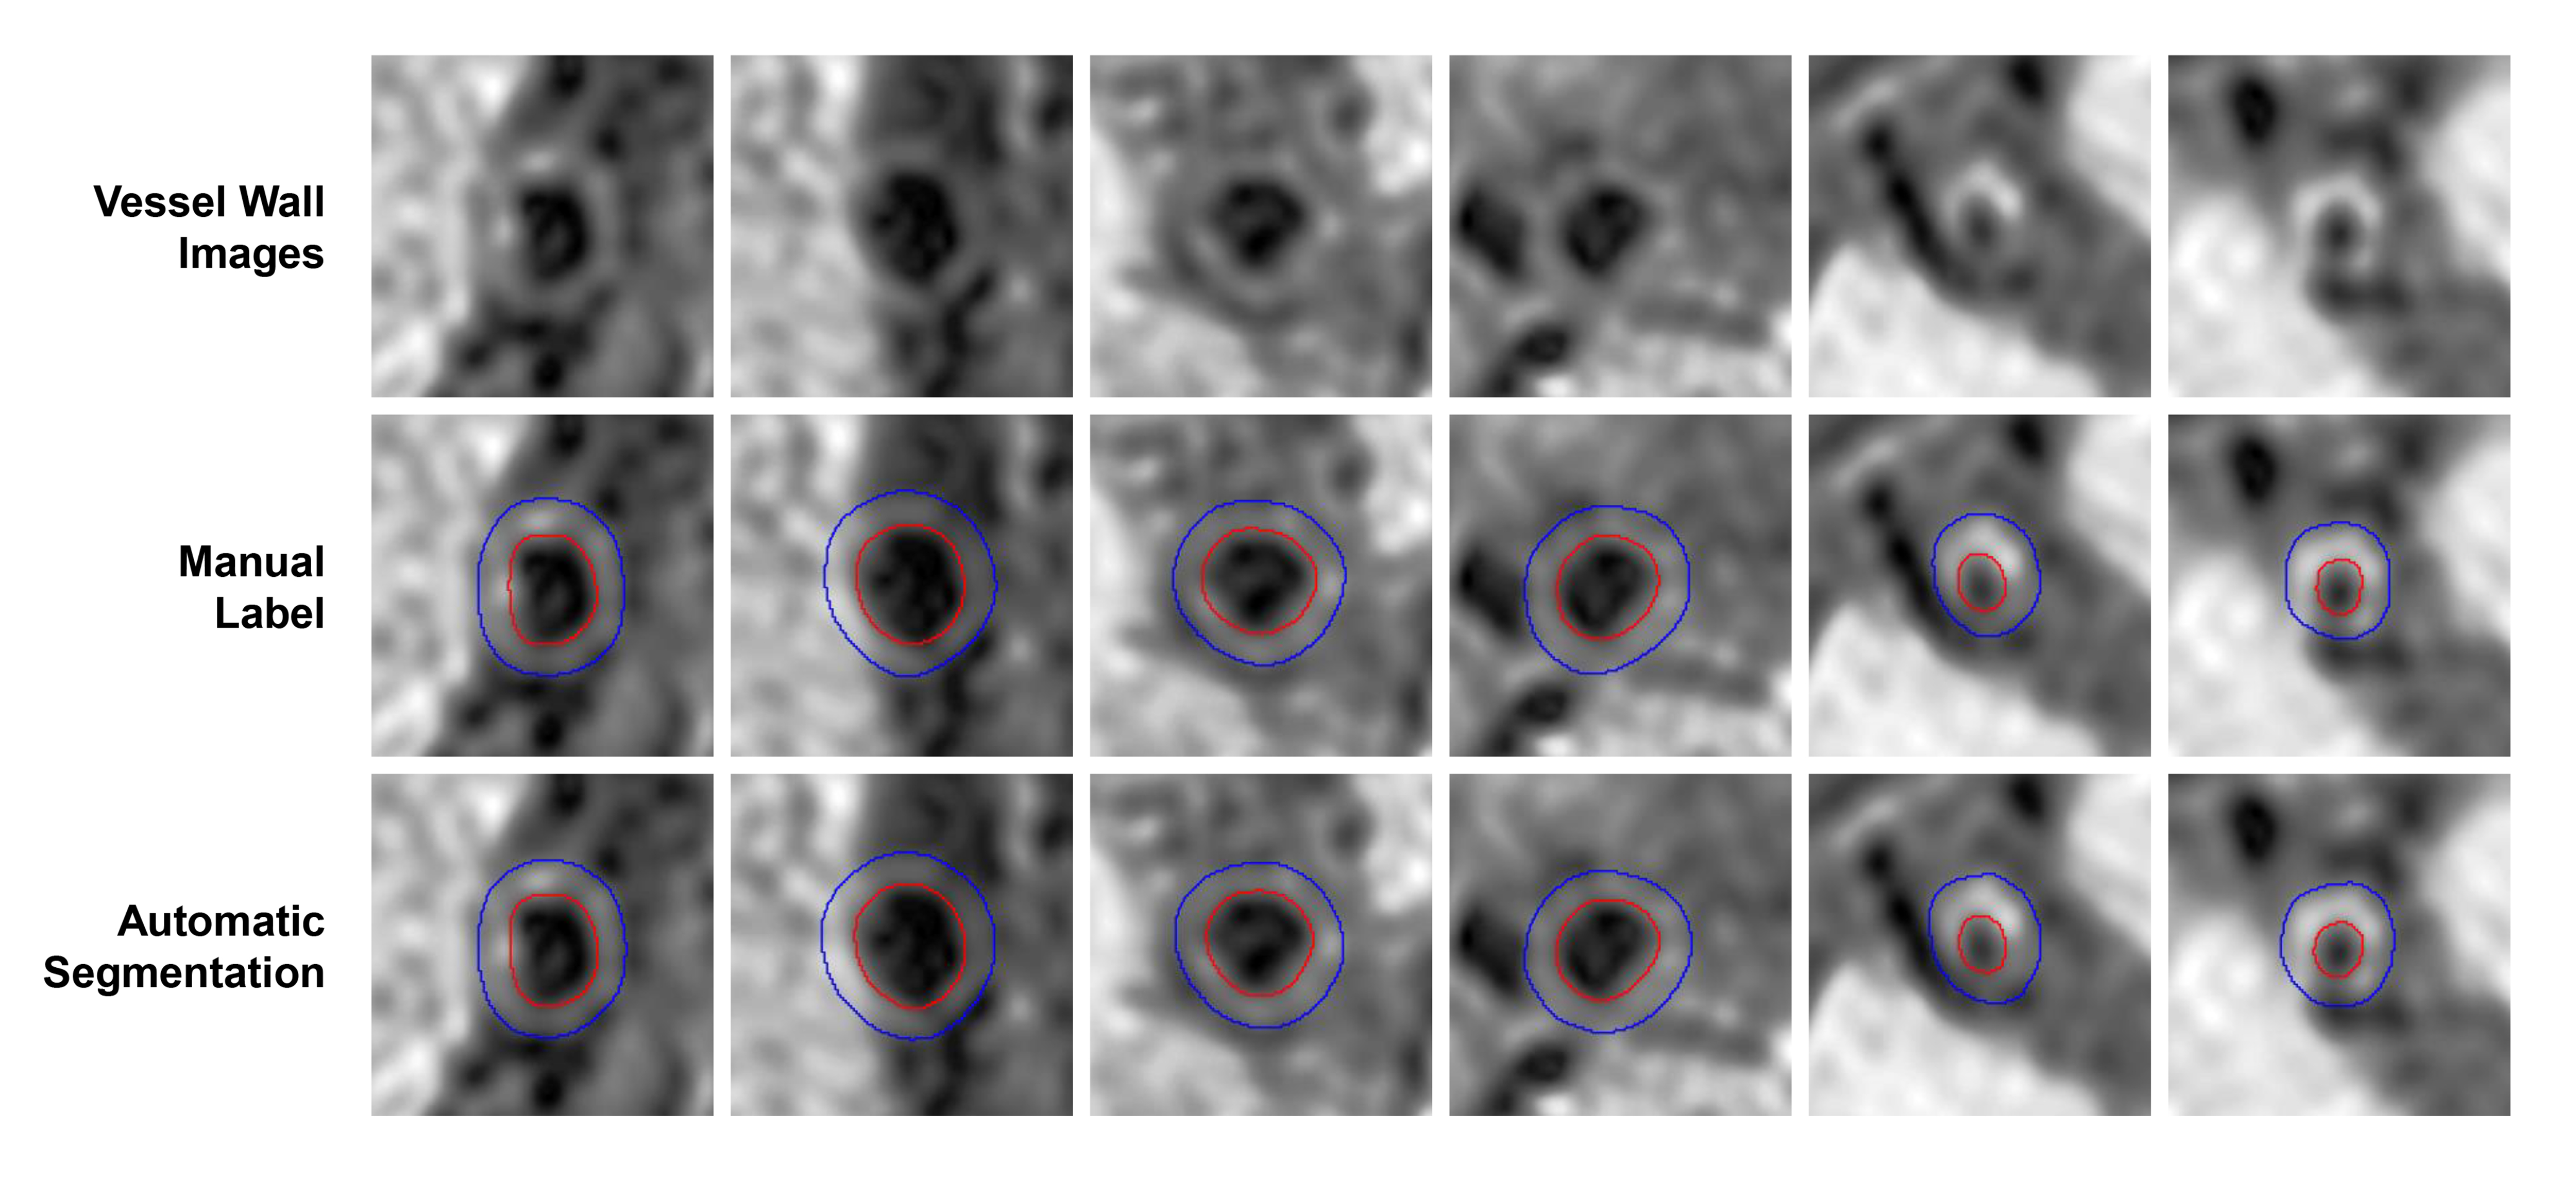
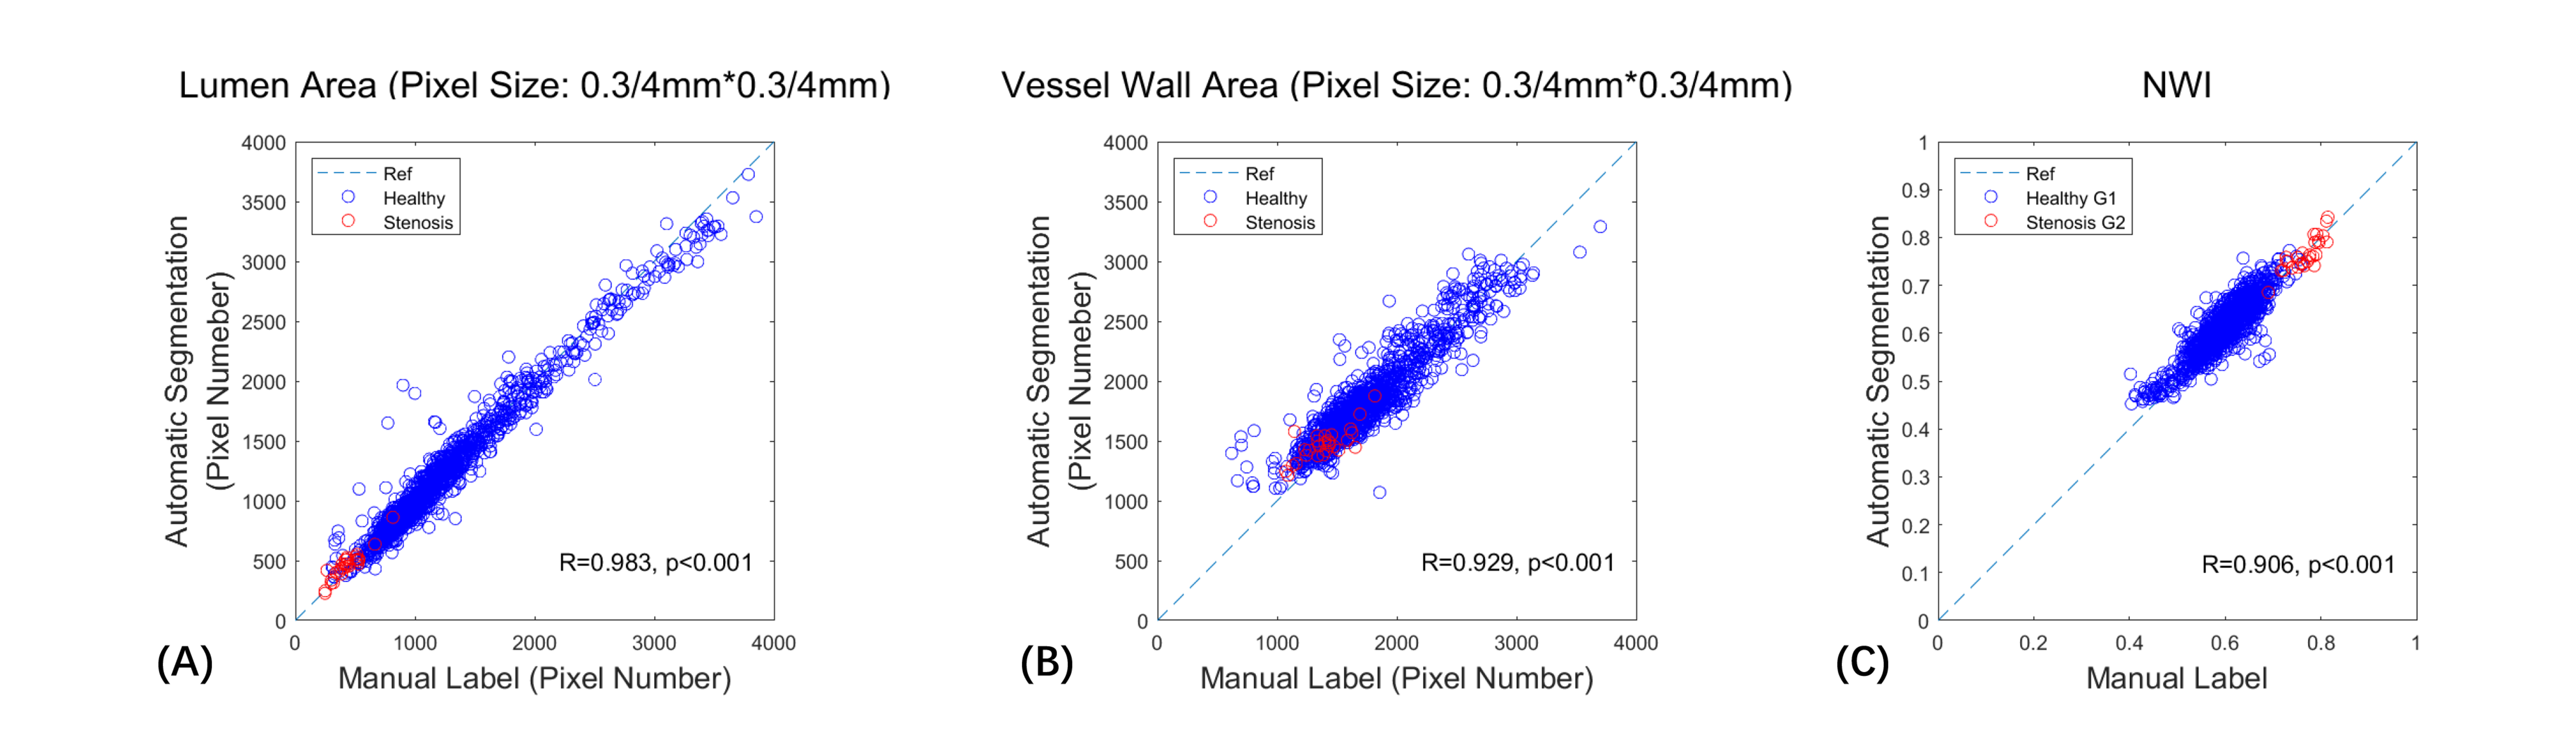
Vessel wall segmentation performance
Figure 3 showed the agreement between automatic segmentation and manual labeling results for both normal and stenotic arteries in 2D. High segmentation DICE of 0.941 (lumen) and 0.894 (vessel wall) were obtained for Healthy G1 dataset. And for Stenosis G2 dataset, the lumen and vessel wall segmentation achieved DICE of 0.922 and 0.896, respectively (Table 1). For vascular morphological measurements, the correlation coefficients of manual and automatic segmentation were 0.983 for lumen area, 0.929 for wall area, and 0.906 for NWI (Figure 4). And the results were statistically significant (p<0.001).
Discussion and Conclusion
In this study, a fully automated deep learning framework was proposed for 3D intracranial vessel wall segmentation with 3D black-blood images. The proposed framework was fully automatic and required no manual intervention and extra sequences. Moreover, this study demonstrated a high segmentation performance for both normal and stenotic arteries. Thus, it may provide a possible tool for quantitative intracranial atherosclerosis analyses in large population studies.Acknowledgements
None.References
1. Bogousslavsky, J., G. Vanmelle, and F. Regli, The Lausanne Stroke Registry: Analysis of 1,000 Consecutive Patients with Fisrt Stroke. Stroke, 1988. 19(9): p. 1083-1092.
2. Gorelick, P.B., et al., Large artery intracranial occlusive disease - A large worldwide burden but a relatively neglected frontier. Stroke, 2008. 39(8): p. 2396-2399.
3. Choi, Y.J., S.C. Jung, and D.H. Lee, Vessel Wall Imaging of the Intracranial and Cervical Carotid Arteries. Journal of Stroke, 2015. 17(3): p. 238-255.
4. Qiao, Y., et al., Intracranial Arterial Wall Imaging Using Three-Dimensional High Isotropic Resolution Black Blood MRI at 3.0 Tesla. Journal of Magnetic Resonance Imaging, 2011. 34(1): p. 22-30.
5. Li, C., et al., Automated Artery Localization and Vessel Wall Segmentation of Magnetic Resonance Vessel Wall Images using Tracklet Refinement and Polar Conversion arXiv. arXiv, 2019: p. 7 pp.-7 pp.
6. Chen, L., et al., Fully automated and robust analysis technique for popliteal artery vessel wall evaluation (FRAPPE) using neural network models from standardized knee MRI. Magnetic Resonance in Medicine, 2020. 84(4): p. 2147-2160.
7. Shi, F., et al., Intracranial Vessel Wall Segmentation Using Convolutional Neural Networks. Ieee Transactions on Biomedical Engineering, 2019. 66(10): p. 2840-2847.
8. Wan, L., et al., Automated Morphology Analysis of Intracranial and Extracranial Vessel Wall Using Convolutional Neural Network. International Society for Magnetic Resonance in Medicine, 2020. 1024.
9. Cicek, O., et al., 3D U-Net: learning dense volumetric segmentation from sparse annotation. Medical Image Computing and Computer-Assisted Intervention - MICCAI 2016. 19th International Conference. Proceedings: LNCS 9901, ed. S. Ourselin, et al. 2016. 424-32.
10. Lee, T.C., R.L. Kashyap, and C.N. Chu, Building Skeleton Models via 3D Medial Surface Axis Thinging Algorithms. Cvgip-Graphical Models and Image Processing, 1994. 56(6): p. 462-478.
11. Oktay, O., et al., Attention u-net: Learning where to look for the pancreas. arXiv preprint arXiv:.03999, 2018.
12. Lafferty, J.D., A. McCallum, and F.C. Pereira. Conditional Random Fields: Probabilistic Models for Segmenting and Labeling Sequence Data. in Proceedings of the Eighteenth International Conference on Machine Learning. 2001.
Figures