2405
MRI denoising using native noise1Columbia University, New York, NY, United States, 2Department of Radiology, University College Hospital(UCH) Ibadan, Ibadan, Nigeria
Synopsis
The benefits of deep learning (DL) based denoising of MR images include reduced acquisition time and improved image quality at low field strength. However, simulating noisy images require biophysical models that are field and acquisition dependent. Scaling these simulations is complex and computationally intensive. In this work, we instead leverage the native noise of the data, dubbed “native noise denoising network” (NNDnet). We applied NNDnet to three different MR data types and computed the peak signal-to-noise ratio (> 38dB) for training performance and image entropy (> 4.25) for testing performance in the absence of a reference image.
Introduction:
The benefits of deep learning (DL) based denoising of MR images include reduced acquisition time (1) and improved image quality at low field strength (2). However, most studies involve simulating the noise level relative to the signal and its structure, for training the models. These simulations require biophysical models that incorporate a variety of tissue parameters that are field and acquisition dependent (2). Scaling these simulations is often complex and computationally intensive. Also, this requires vast data to train and validate. In this work, we instead leverage the native noise of the data that needs to be denoised, dubbed “native noise denoising network” (NNDnet). We applied NNDnet to three different data types: (i) T1-weighted and (ii) T2-weighted images from Tailored MR Fingerprinting (TMRF) (3,4) that allows rapid acquisition of six, non-synthetic contrasts and two quantitative tissue parametric maps; (iii) low field (0.36T) brain T1 weighted imaging which suffers from lower signal to noise ratio (SNR) compared to the widely used 1.5T system.Methods:
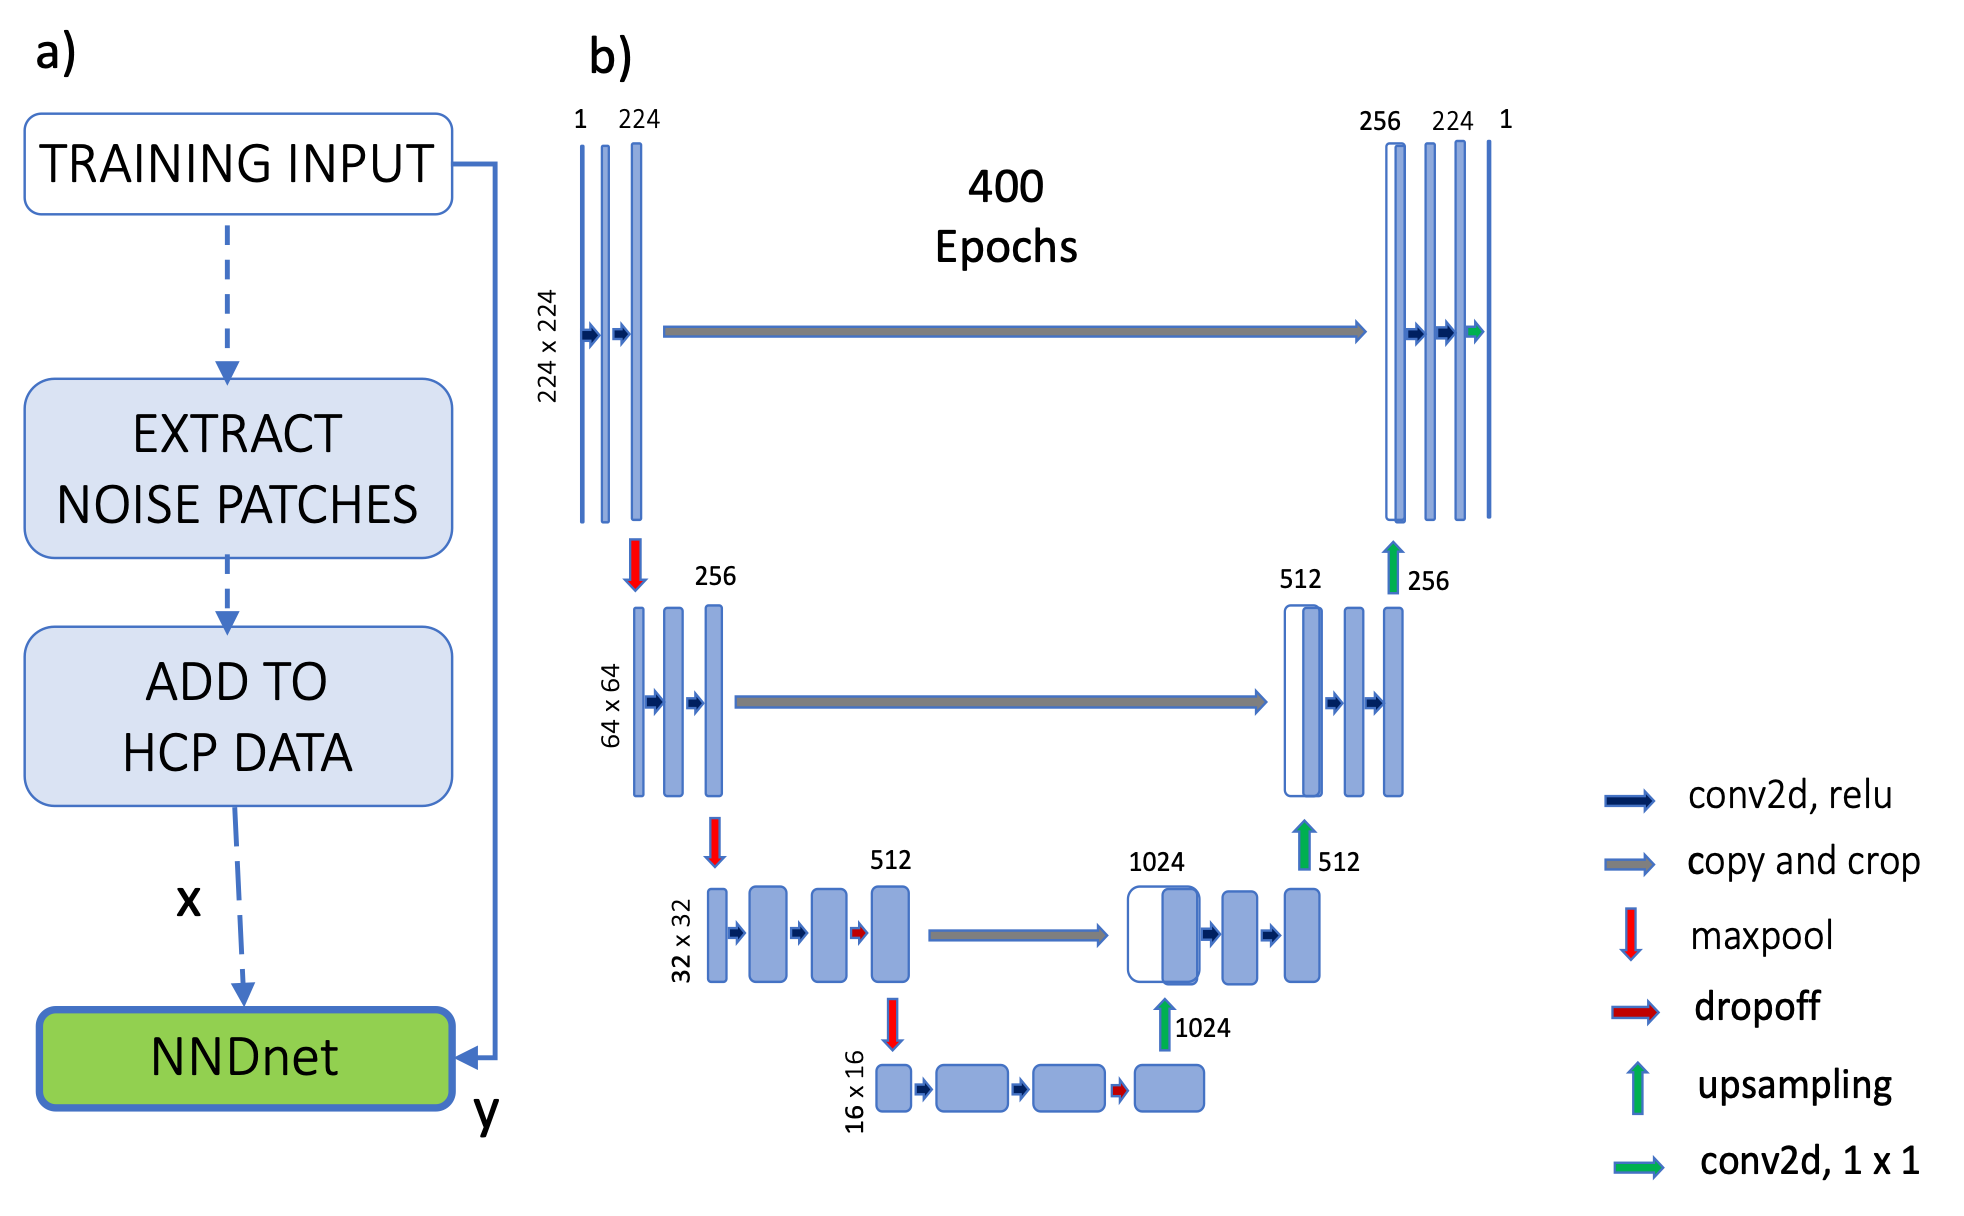
The training data included 8295 T1 MPRAGE and 6622 T2 weighted images from the human connectome project (5). The forward modeling of noisy data included extracting noise patches from a target application data set that is noisy. This extraction was performed by cropping and storing the corners of the noisy images. These noisy patches were then collaged and added to the HCP data at a noise level relative to the maximum image intensity level found in the native data set. The noisy and clean HCP datasets were used to train the native noise denoising (NND) network (NNDnet) using a U-net (Fig. 1) with the rectified linear unit as the activation function over 400 epochs on a four GPU computer. This model was expected to account for noise and signal levels. Previously acquired T1-weighted images on a 0.36T Mindray and TMRF data on a 3T GE Premier were used in this study. For the three types of data, we extracted the noise patches of size 14 x 14 from 50% of the data and tested on the other half. This resulted in testing 3420 slices for low field imaging, 2220 slices for TMRF-T1, and 900 slices for TMRF-T2. We evaluated the training denoising performance of the NNDnet images using peak SNR (PSNR) with respect to the clean HCP data. The test images from the three applications were denoised using the gradient anisotropic diffusion denoising (AD) in the 3D Slicer tool (6), NNDnet, and the combination of the two denoising methods. The test images from the three applications did not have a gold standard (no reference). Hence, image entropy that reflects the detail in an image was calculated for the three denoising combinations and compared.Results and discussion:
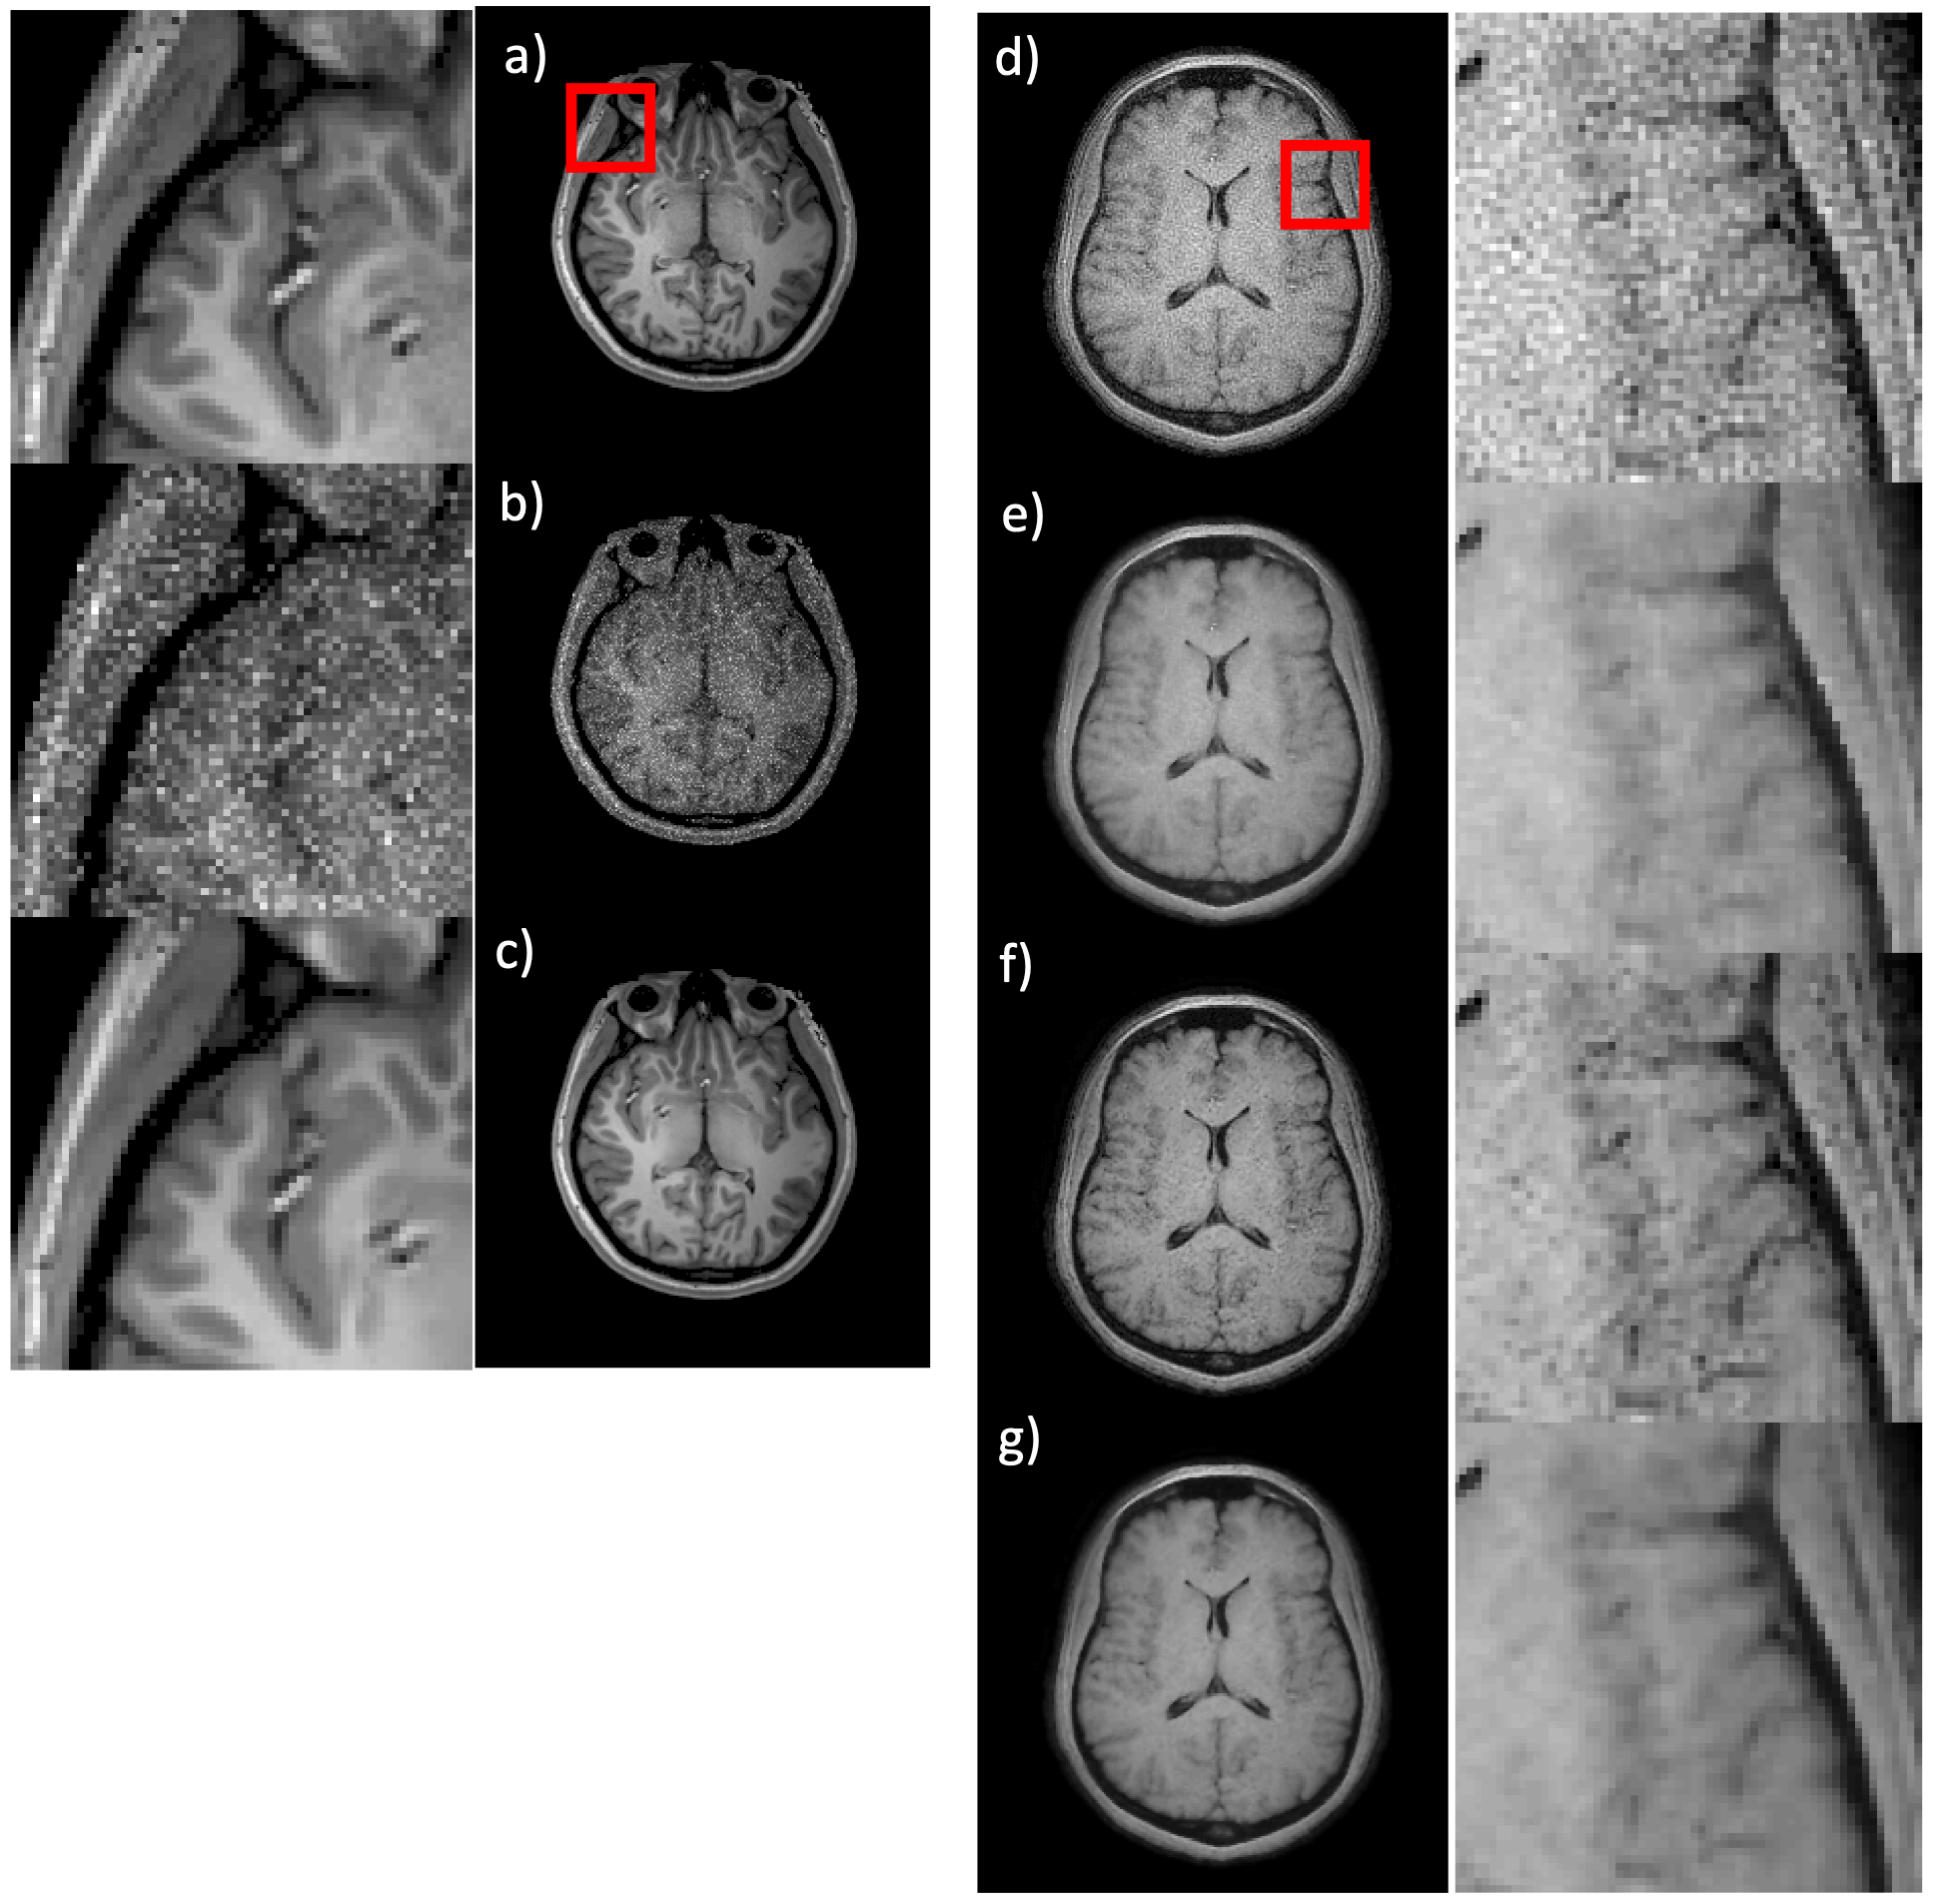
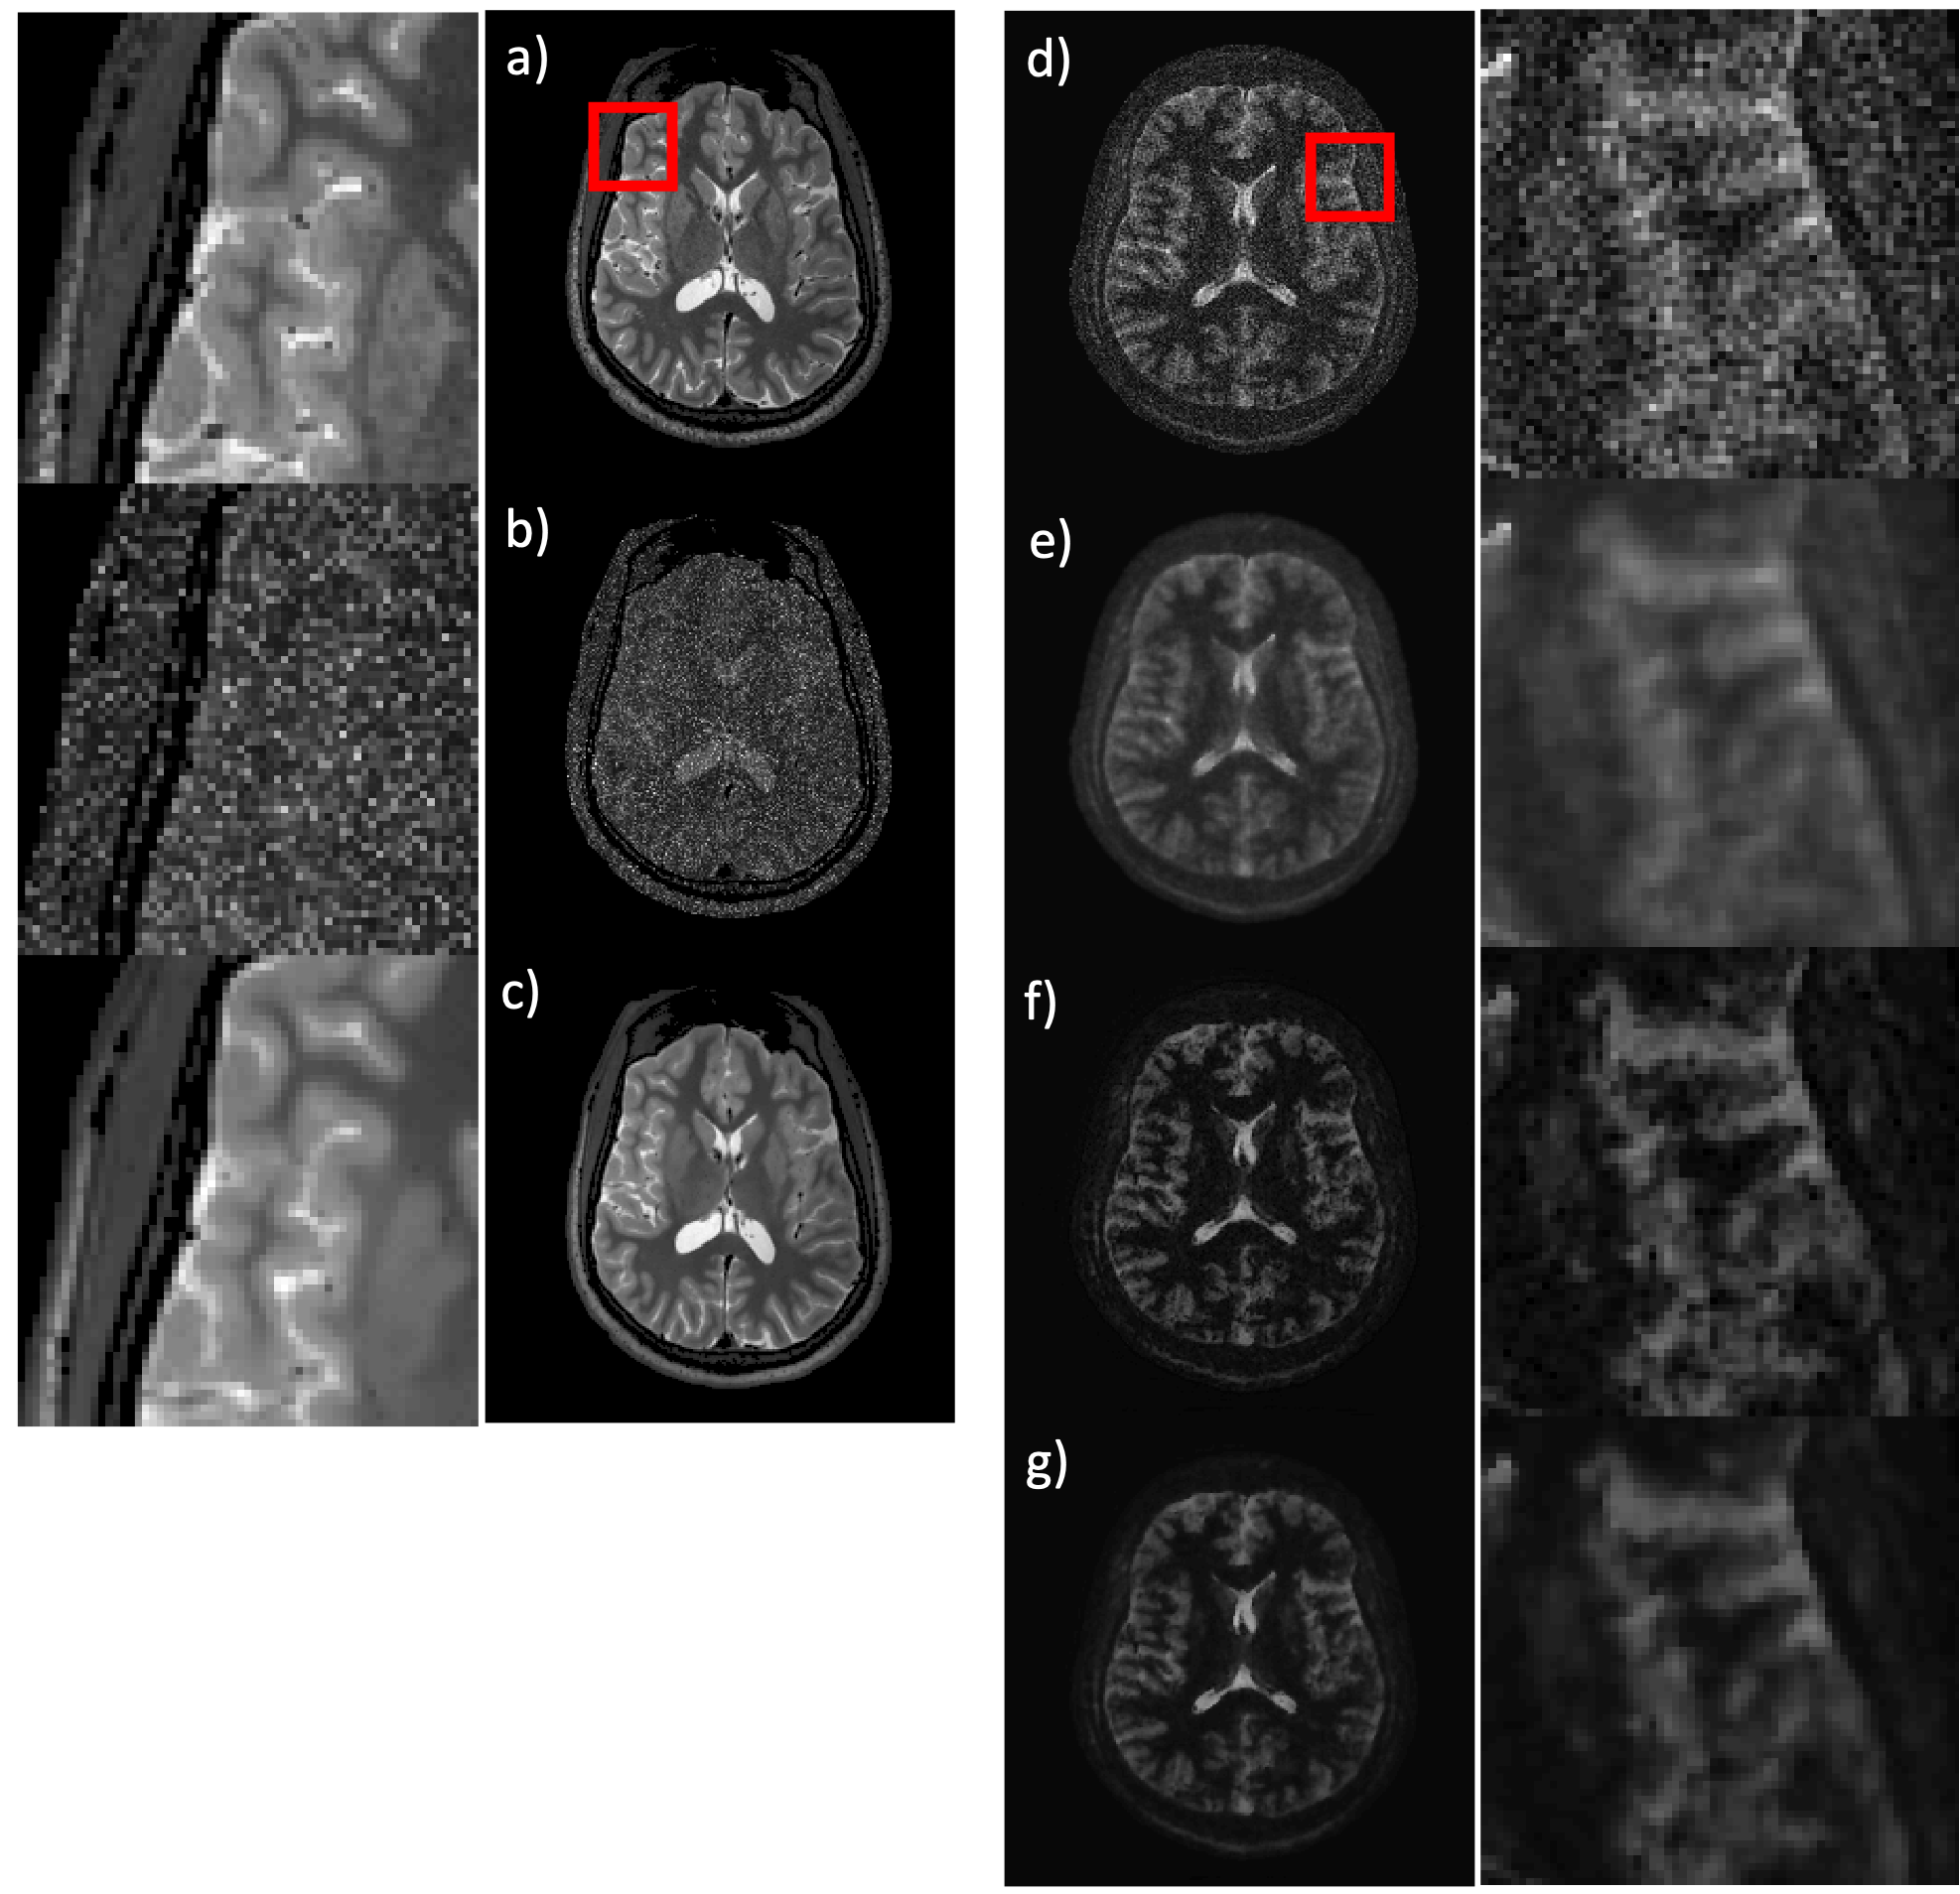
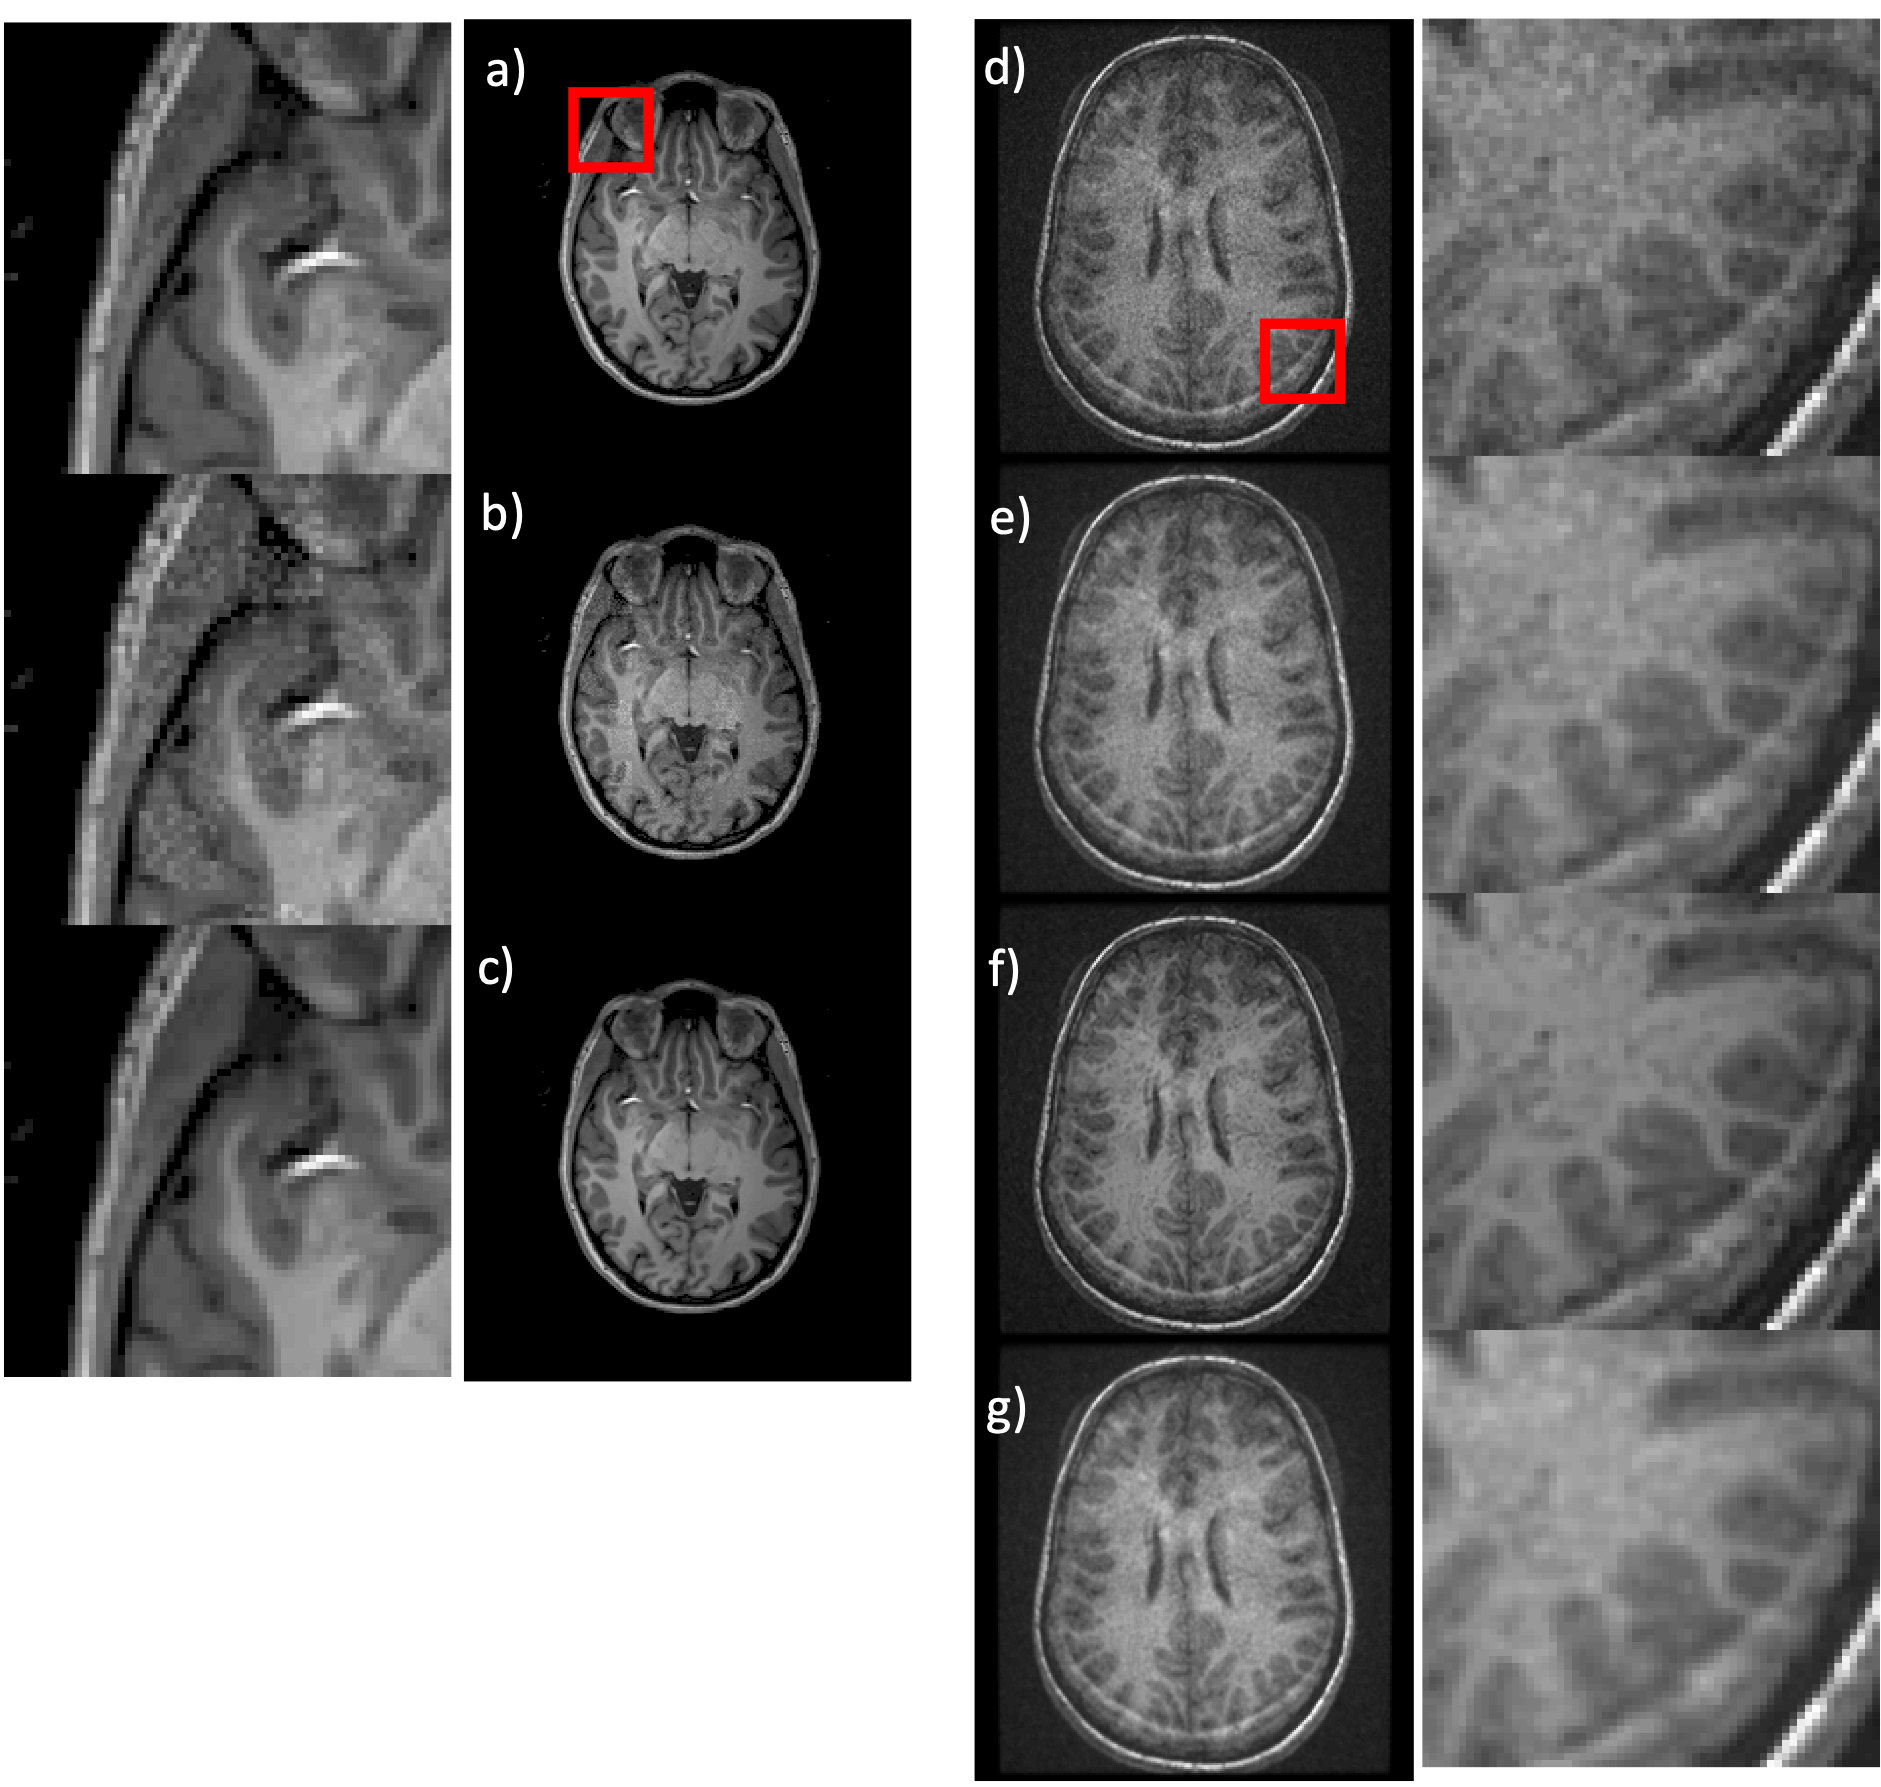
The training performance of the NNDnet is shown in fig. 2(a-c). Fig. 2c depicts the denoised image similar to 2a. The training required twenty-two hours on a four GPU computer. The noise structure and relative amplitude to the signal seen in fig. 2b is reflected in the test image in 2d. The AD filtering results in blurring shown in fig 2e while NNDnet retains the edge information (2f). The combination of the two denoising methods provides a balance between edge preservation and denoising. Figs. 3 and 4 illustrate similar representative results for TMRF T2 and low field T1 denoising. Fig. 5 depicts the training and testing performance of NNDnet. The PSNR for NNDnet denoised images increases for the three applications (fig. 5a). The mean+/- SD entropy of AD, NNDnet, and the combination of the two methods computed over slices show NNDnet performing better than AD and the combination of the two methods provides the highest entropy. The denoising of these three different contrasts at two different field strengths demonstrate the benefits of the native noise approach: i) inherently learn the structure and level of the noise of the specific noisy images ii) not requiring the acquisition of gold standard data for the noisy images iii) easily adapting to different noise structures and amplitudes without a vast amount of noisy training data as each image produces four patches of noise to learn. Current and future work involves integrating NNDnet with the scanner to enable online or offline denoising.Conclusion:
We have demonstrated the denoising of three different types of MR images without the need for acquiring corresponding gold standard images or simulations requiring sophisticated biophysical models and image quality transfer methods.Acknowledgements
This work was supported, in part, by GE-Columbia research partnership grant and also performed at Zuckerman Mind Brain Behavior Institute MRI Platform, a shared resource, and Columbia MR Research Center siteReferences
1.Keerthi Sravan Ravi, Sairam Geethanath, Patrick Quarterman, Maggie Fung, and John Thomas Vaughan Jr., Intelligent Protocolling for Autonomous MRI, ISMRM 2020
2. Figini, M., Lin, H., Ogbole, G., Arco, F.D., Blumberg, S.B., Carmichael, D.W., Tanno, R., Kaden, E., Brown, B.J., Lagunju, I. and Cross, H.J., 2020. Image Quality Transfer Enhances Contrast and Resolution of Low-Field Brain MRI in African Paediatric Epilepsy Patients. arXiv preprint arXiv:2003.07216.
3. Sairam Geethanath*, Sachin Jambawalikar, Maggie Fung, Angela Lingelli, John Thomas Vaughan Jr., Rapid, simultaneous non-synthetic multi-contrast andquantitative imaging using Tailored MR Fingerprinting, ISMRM 2019
4. Pavan Poojar, Enlin Qian, Maggie Fung, and Sairam Geethanath; Natural, multi-contrast and quantitative imaging of the brain using tailored MR fingerprinting, ISMRM 2020
5. Van Essen, D.C., Smith, S.M., Barch, D.M., Behrens, T.E., Yacoub, E., Ugurbil, K. and Wu-Minn HCP Consortium, 2013. The WU-Minn human connectome project: an overview. Neuroimage, 80, pp.62-79.
6. Pieper, S., Lorensen, B., Schroeder, W. and Kikinis, R., 2006, April. The NA-MIC Kit: ITK, VTK, pipelines, grids and 3D slicer as an open platform for the medical image computing community. In 3rd IEEE International Symposium on Biomedical Imaging: Nano to Macro, 2006. (pp. 698-701). IEEE.
Figures