2404
Task-Based Assessment for Neural Networks: Evaluating Undersampled MRI Reconstructions based on Signal Detection1Mathematics Department, Manhattan College, Riverdale, NY, United States, 2Roy J. Carver Department of Biomedical Engineering, University of Iowa, Iowa City, IA, United States
Synopsis
Artifacts from neural network reconstructions are difficult to characterize. It is important to assess the image quality in terms of the task for which the images will be used. In this work, we evaluated the effect of undersampling on detection of signals in images reconstructed with a neural network by both human and ideal observers. We compared these results to standard metrics (SSIM and NRMSE). Our results suggest that the undersampling level chosen by SSIM, NRMSE and ideal observer would likely be different than that of a human observer on a detection task for a small signal.
Purpose
Undersampling during data acquisition in magnetic resonance imaging (MRI) reduces the time the patient is in the scanner. The larger the undersampling, the larger the time reduction. This reduction also comes at a cost in terms of image quality, typically thought of in terms of increased artifacts. Recently, various neural network reconstruction algorithms have been explored for removal of those artifacts1-2. However, evaluations of reconstructions generally use measures of distance from a fully sampled image e.g. normalized root mean squared error (NRMSE) or structural similarity (SSIM)3. In this work, we evaluate undersampled reconstructions with a U-Net and a SSIM loss function using task-based assessment of image quality4, specifically for signal detection. We compared the choice of undersampling that would best balance image quality and acquisition speed resulting from NRMSE and SSIM with the choice that would arise from detecting a small signal in the reconstructed images by humans and an approximation to the ideal observer5.Methods
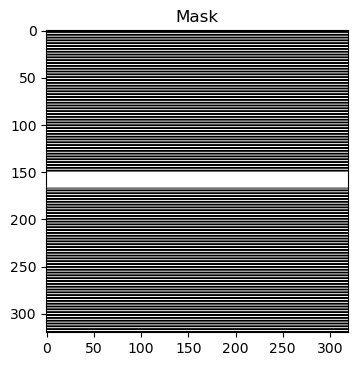
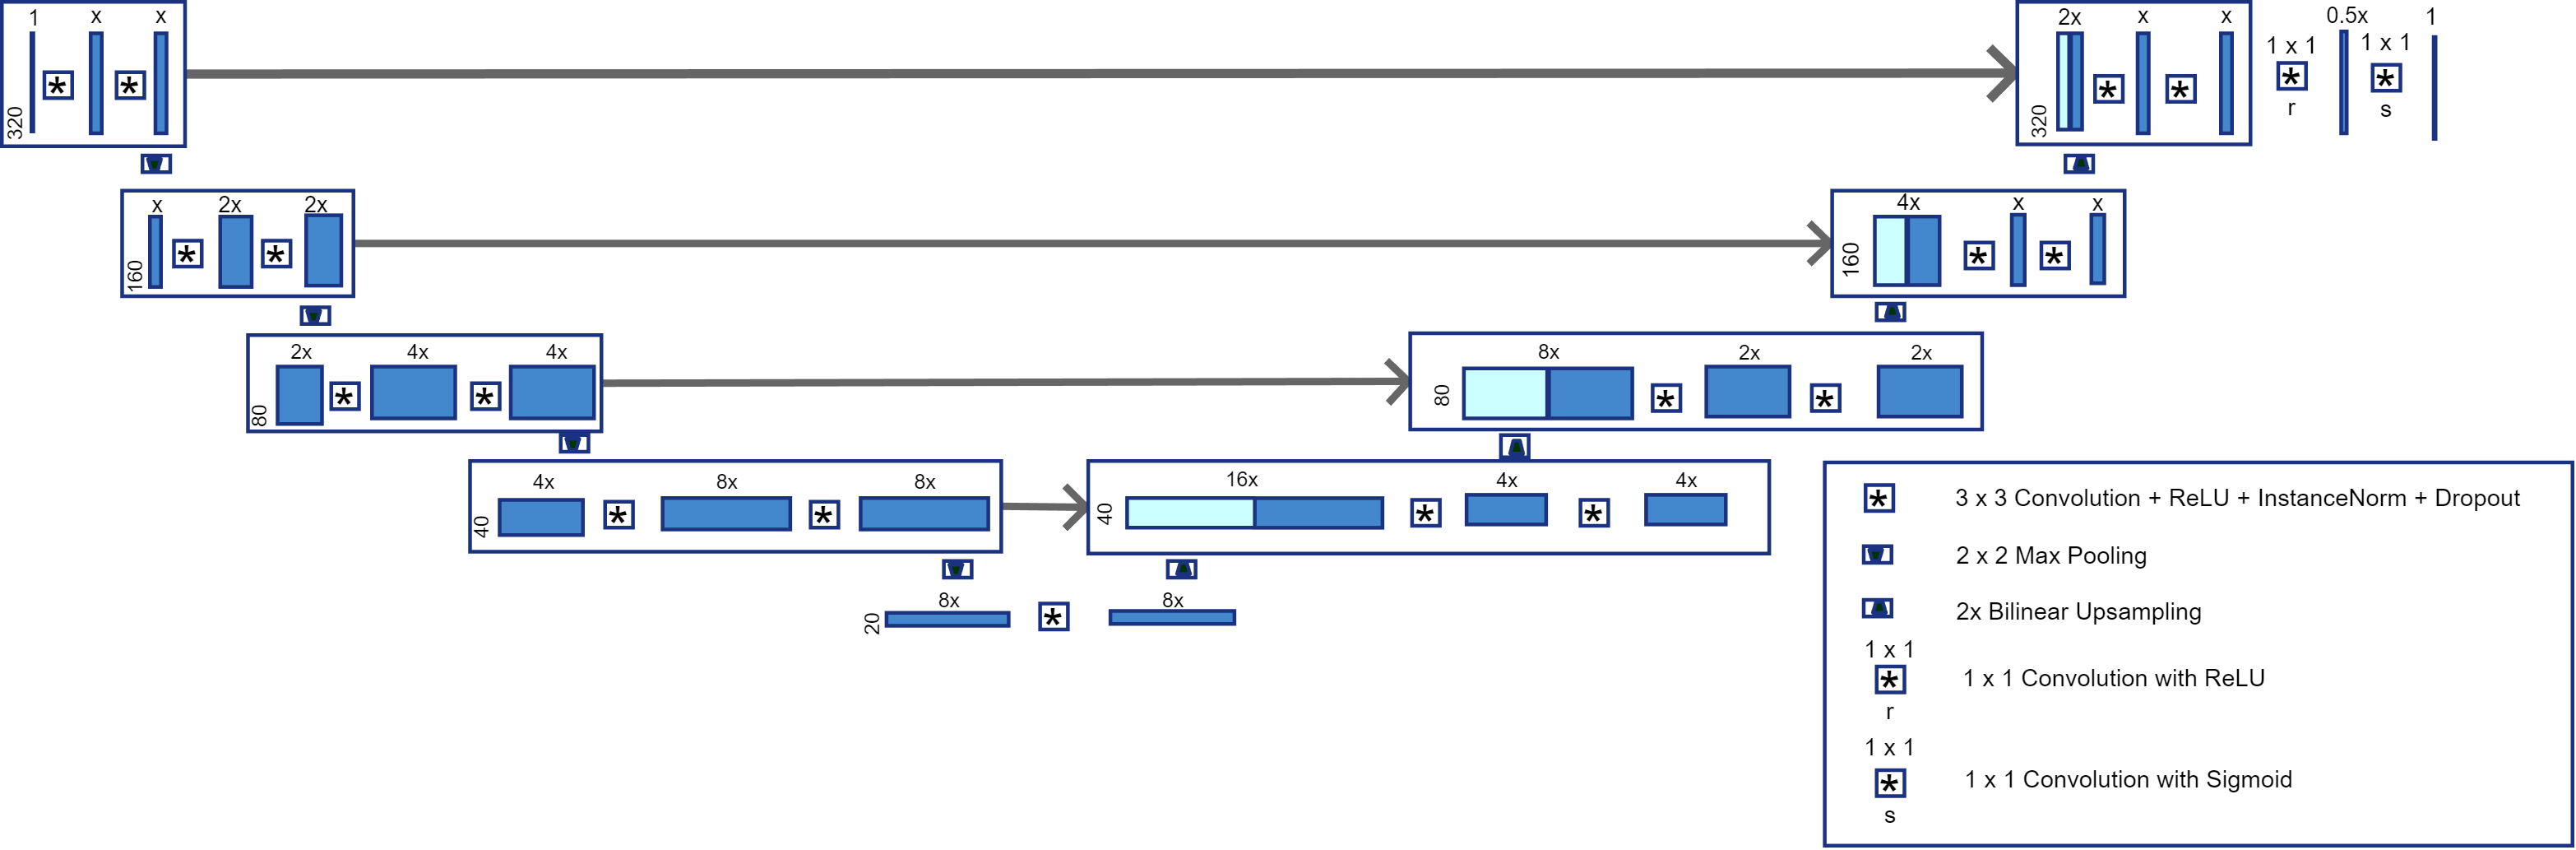
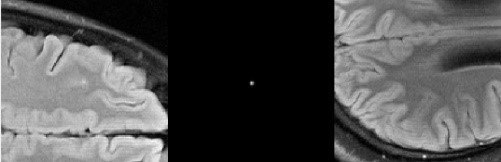
We performed retrospective one-dimensional undersampling on fully sampled fluid-attenuated inversion recovery (FLAIR) images reconstructed from the fastMRI open source dataset2. The reconstructions of the fully sampled 320 x 320 background images were generated in the BART environment from the multi-coil data by R=1 SENSE combination with coil maps estimated via the sum of squares approach using the central 16 k-space lines6. In order to generate the fully sampled images with the signal, the multi-coil k-space data of the signal (a small disk with radius = 0.25 pixels blurred by a Gaussian kernel, σ=1 pixel) was added to the background image data before reconstruction. Once the fully sampled images single coil images where obtained, the undersampling for the different accelerations were done from the single coil image. We kept 16 k-space lines around the zero frequency (5% of the data) and everywhere else collected every k line with k = 2,3,4 and 5 (Figure 1). A U-Net2 with 64 channels in the first layer, a 0.1 dropout and a 1-SSIM loss was used but with a ReLU and sigmoid activation functions at the end (Figure 2). We ran a 5-fold cross validation study with 500 background images to evaluate the undersampling based on SSIM and NRMSE. The standard deviation for these metrics were computed from the five folds.For the observer studies, we trained the network on all 500 background images used in the cross-validated study and used the network to reconstruct the under-sampled data from 50 testing images. Four signals were placed in each background image to generate 200 sub-images (matrix size 128 x 128) for use in the observer studies. Each background and signal combination was generated separately to avoid possible interaction between the signals. Four human observers were trained for performing the two-alternative forced-choice (2AFC) trials in which the observer determines which of two locations contains the signal (Figure 3)4. From a detection task-based perspective, our measure of image quality is the fraction of times that the observer correctly detects the signal, i.e. the fraction correct (FC). The signal amplitude was chosen to result in a reasonable range of fraction correct for the human observer study (about 0.84 in the 3x observer trial). An ideal observer has the largest true-positive fraction for any false-positive fraction. We used an approximation to the ideal observer, the channelized Hotelling observer with Laguerre Gauss (LG-CHO) channels5. The standard deviation for the fraction correct for the human observer study was computed using the four observers. For the LG-CHO, the standard deviation was computed using 10,000 bootstrap samples.
Results & Discussion
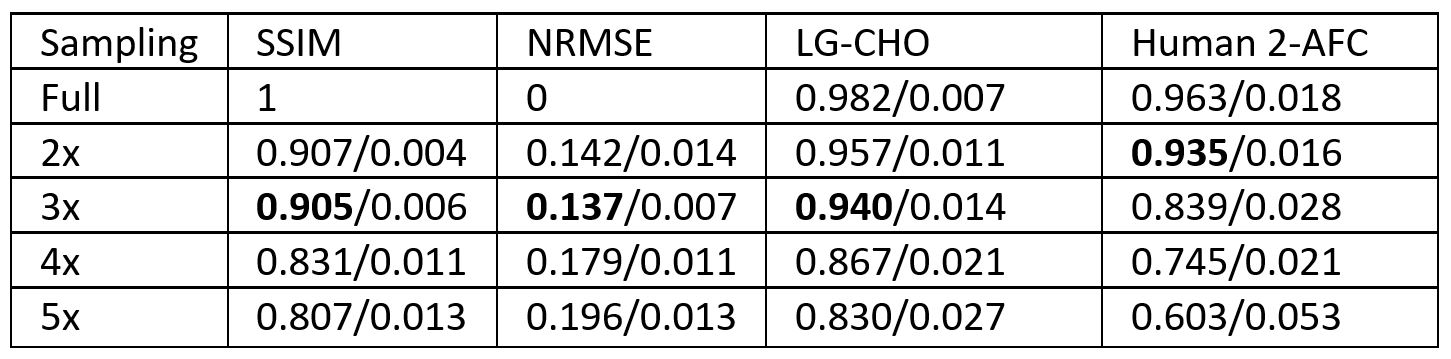
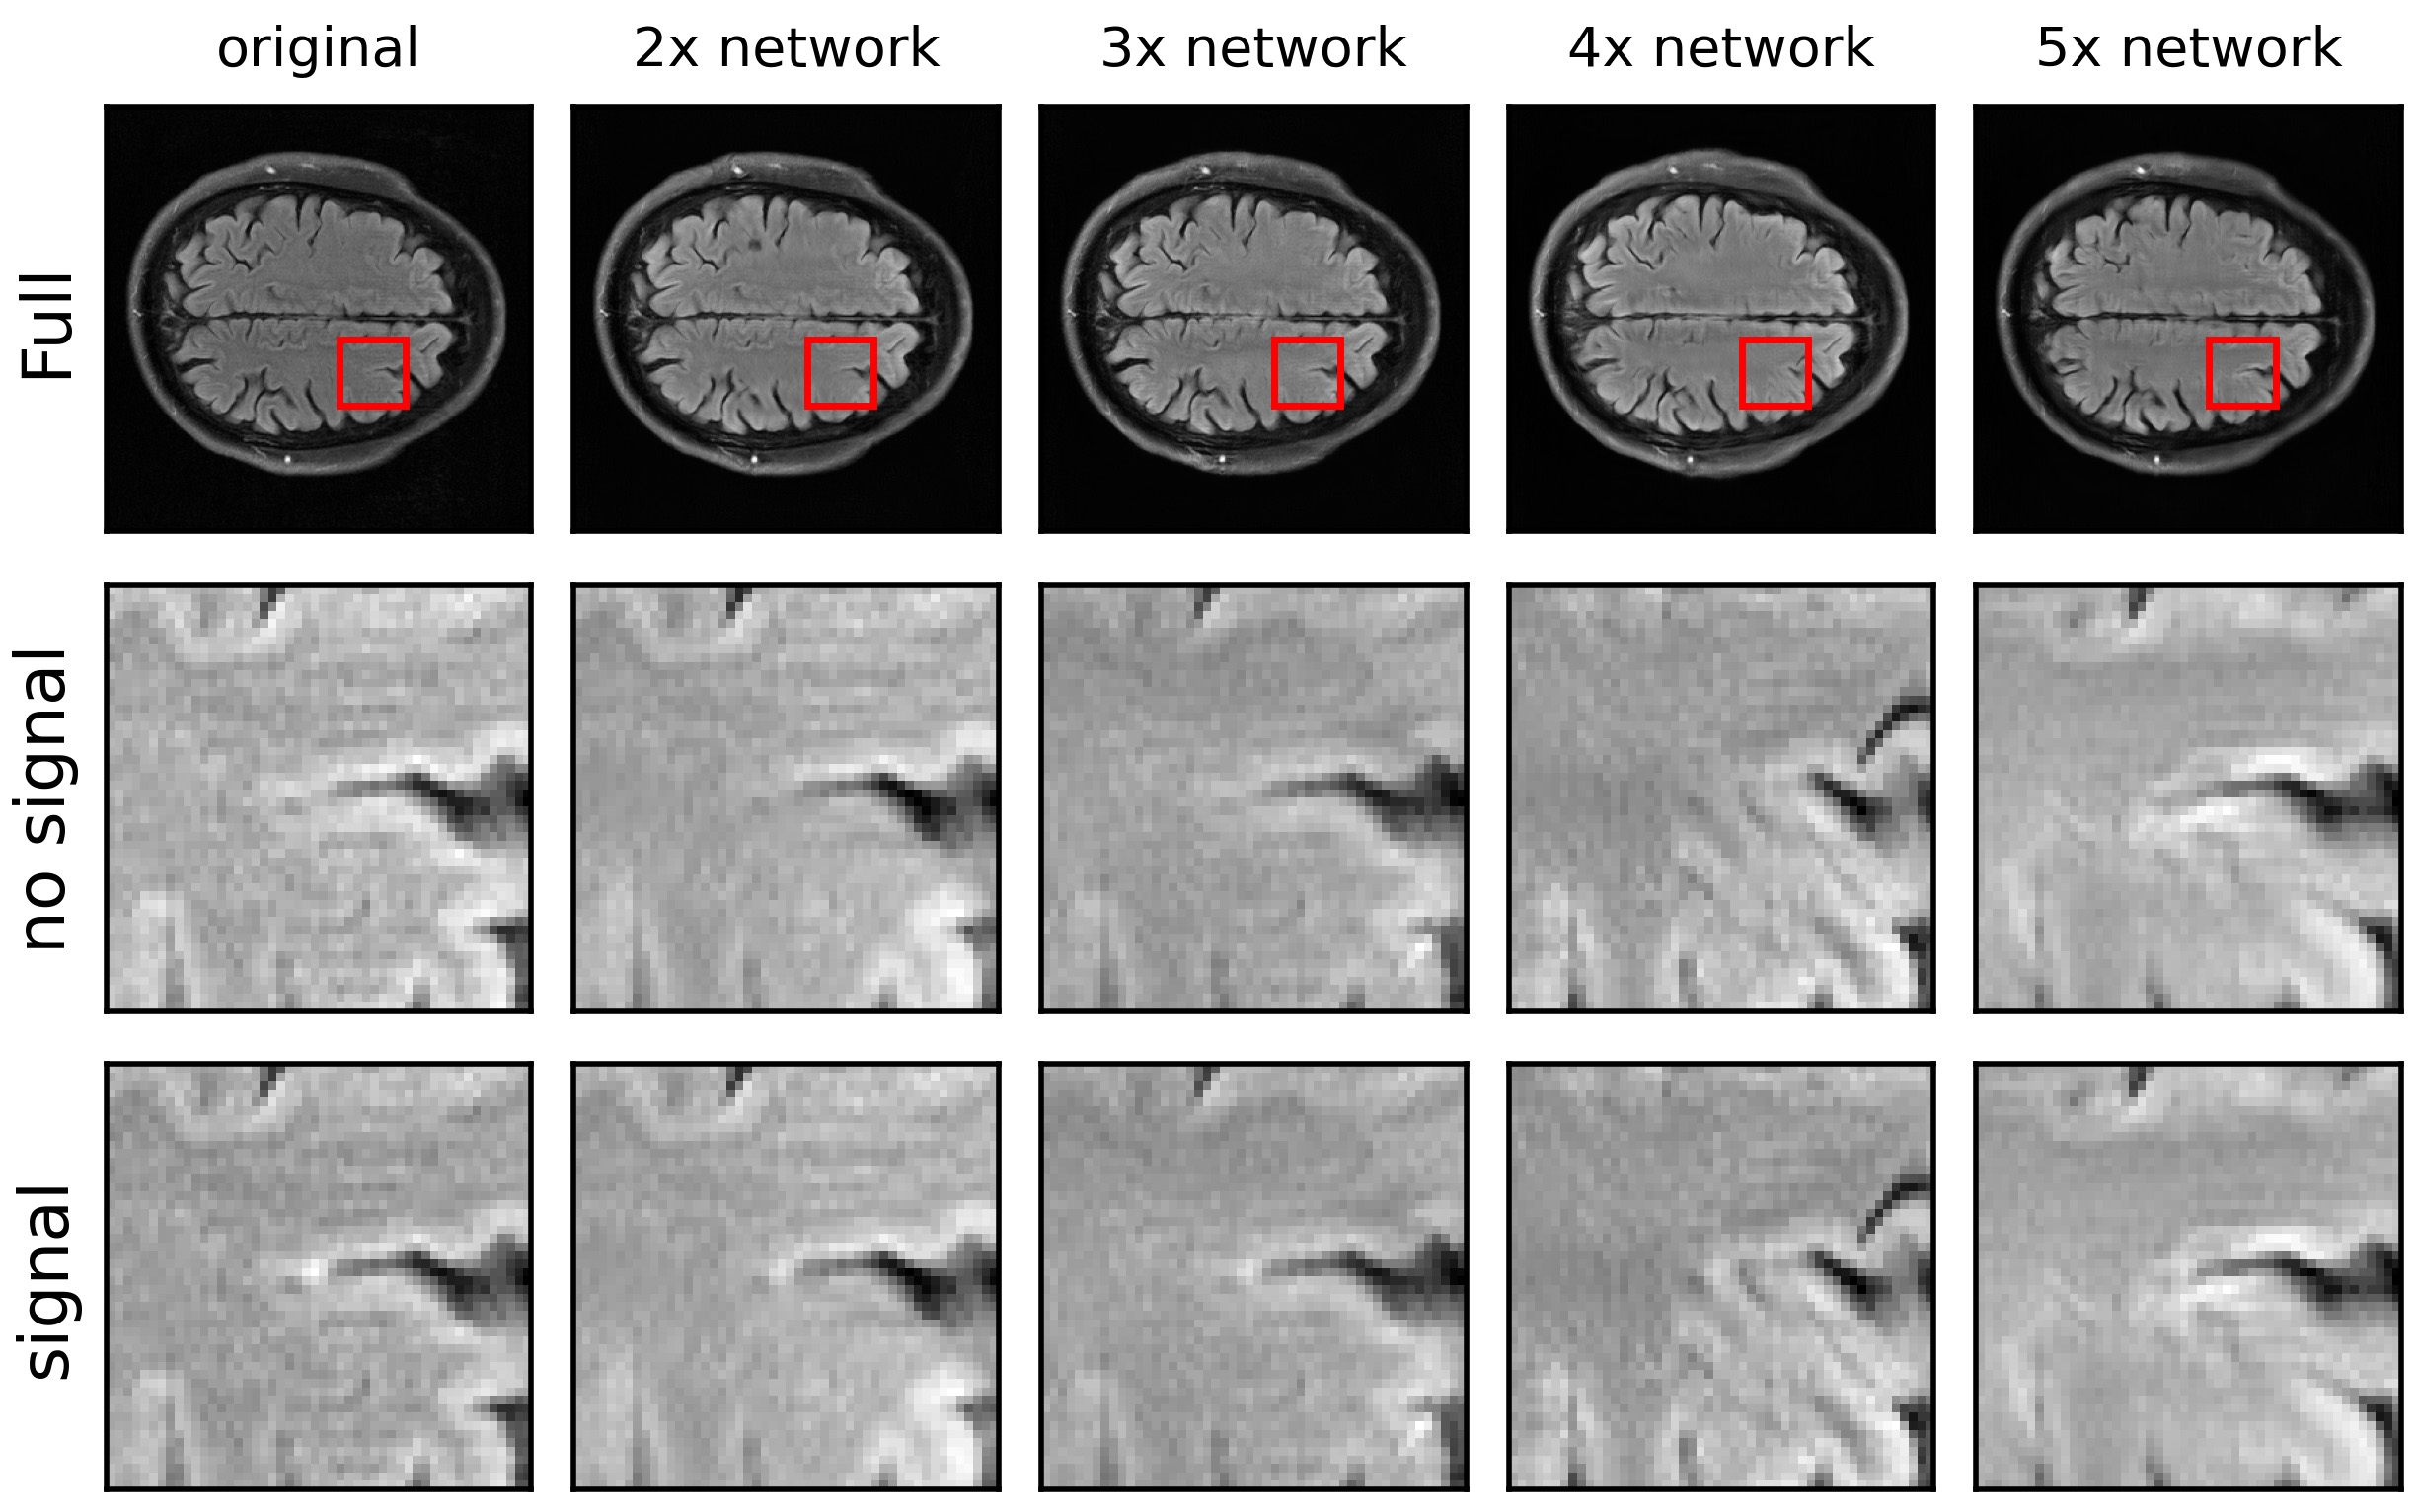
The results from the cross-validation and observer studies are summarized in Table 1. Using a 2-AFC detection task with human observers leads to a more conservative undersampling than what would likely be chosen with LG-CHO, NRMSE or SSIM. Sample images which illustrate the results at the different levels of undersampling are shown in Figure 4. In these images we observe a decrease in visibility of the signal and an increase in artifacts as the undersampling increases. These images allow for a subjective evaluation of the image quality for that specific image but to evaluate image quality for the reconstruction method it is necessary to evaluate the performance over an ensemble of images. In particular, one would not necessarily choose the same level of undersampling based on these images compared to what would be chosen by the 2-AFC study. Future work will include using a larger training set, an L2 loss function for the U-Net, other network architectures, model observers to predict human performance and tasks involving signal and location uncertainty.Conclusion
Our results suggest that the undersampling level chosen by SSIM, NRMSE and LG-CHO would likely be different than that of a human observer on a 2-AFC task for detection of a small signal. This implies that a task-based approach to image quality can provide choices in acquisition which are different than error metrics (NRMSE), general metrics of image quality (SSIM) or even ideal observers for 2-AFC tasks (LG-CHO) when the tasks are carried out by human observers.Acknowledgements
We acknowledge support from NIH R15-EB029172 and thank Dr. Krishna S. Nayak and Dr. Craig K. Abbey for their thoughtful feedback.References
1. K Hammernik, T Klatzer, E Kobler, et al, "Learning a variational network for reconstruction of accelerated MRI data", Magn Reson Med, 79: 3055-3071 (2018)
2. J Zbontar, F Knoll, A Sriram, et al, "fastMRI: An Open Dataset and Benchmarks for Accelerated MRI", arXiv: 1811.08839v1 (2018)
3. Z Wang, AC Bovik, HR Sheikh, et al, "Image quality assessment: from error visibility to structural similarity", IEEE TMI, 13: 600-612 (2004)
4. CK Abbey, HH Barrett, "Human-and model-observer performance in ramp-spectrum noise: effects of regularization and object variability", JOSA A, 18: 1237-1242 (1994)
5. AR Pineda, "Laguerre-Gauss and sparse difference-of-Gaussians observer models for signal detection using constrained reconstruction in magnetic resonance imaging", Proc. SPIE 10952:53-58 (2019)
6. M Uecker, F Ong, JI Tamir, et al, "Berkeley Advanced Reconstruction Toolbox", Proc. Intl. Soc. Mag. Reson. Med, 23, 2486 (2015)
Figures