2400
Interpretability Techniques for Deep Learning based Segmentation Models1Department of Biomedical Magnetic Resonance, Otto von Guericke University, Magdeburg, Germany, 2Data and Knowledge Engineering Group, Otto von Guericke University, Magdeburg, Germany, 3Faculty of Computer Science, Otto von Guericke University, Magdeburg, Germany, 4German Centre for Neurodegenerative Diseases, Magdeburg, Germany, 5Leibniz Institute for Neurobiology, Magdeburg, Germany, 6Center for Behavioral Brain Sciences, Magdeburg, Germany
Synopsis
In medical image analysis, it is desirable to decipher the black-box nature of Deep Learning models in order to build confidence in clinicians while using such methods. Interpretability techniques can help understand the model’s reasonings, e.g. by showcasing the anatomical areas the network focuses on. While most of the available interpretability techniques work with classification models, this work presents various interpretability techniques for segmentation models and shows experiments on a vessel segmentation model. In particular, we focus on input attributions and layer attribution methods which give insights on the critical features of the image identified by the model.
Introduction
Artificial Intelligence based support systems are widely used today for Medical Image Analysis. However, in order to gain the trust of the radiologists and clinicians, it is imperative to do away with the black-box nature of the Deep Learning techniques, as the impact of a model’s erroneous output can be high in the medical domain. Interpretability in machine learning can be defined as the extraction of relevant knowledge from a machine-learning model concerning relationships either contained in data or learned by the model[7]. Interpretability of Deep Learning techniques answers the question as to why a neural network model provides a particular output. In other words, the neural network should provide human-understandable justifications for its output leading to insights about the inner workings. For classification models, where we have one final output obtained from C final layer neurons, where C being the number of classes, there are multiple interpretability techniques supported by various libraries like Torchray[2] and CNN Visualization library[3]. However, for segmentation, this is more challenging as the output contains C features maps, and each feature map contains the same number of pixels as the input. In this research, the authors have adapted various interpretability techniques[3][4][5][6] used for classifications models, to work with segmentation models. This techniques were then explored while interpreting the results of a vessel segmentation model trained on Time-of-fight (TOF) Magnetic Resonance Angiogram (MRA) images of the human brain called DS6[1]. The model automatically segments Lenticulostriate Arteries (LSA) using 3D 7 Tesla TOF-MRA Images. On applying these interpretability techniques[3][4][5][6], one can visualize key features/areas of the MRI images that the model thinks are critical in determining the output. We also implement layer-wise attributions to understand the focus of individual layers of the model.Methods
The goal of the research was to develop a pipeline to implement various interpretability techniques for segmentation models. A pre-trained U-Net MSS model with Deformation[1] was used for testing our approach. We mainly focused on two third-party libraries: Torchray[2] and CNN Visualization library[3]. The libraries were extended for segmentation models using a wrapper. The wrapper first assigns the class for each pixel of the model output using argmax and then it sums up all the pixels that belong to the same class finally outputting a vector of shape C x 1 for each input image, where C being the number of classes. We have implemented more than 25 interpretability techniques, which covers almost every technique available today, in the pipeline. Among them, we find the attributions from the following methods, to give us the most promising results:1. Guided Backpropagation: The guided backpropagation (GBP)[5] algorithm computes the gradient of the output with respect to the input but overrides the ReLU function gradients, thereby backpropagating only the non-negative gradients.
2. Deconvolution: In this attribution method[6], the target output’s gradient is computed with respect to the input. However, only the non-negative gradients are propagated through the network by overriding the gradients of the ReLU functions. The ReLU of the output gradient gives the gradient of the ReLU input.
3. Integrated Gradients: Integrated Gradients[4] is an axiomatic model interpretability algorithm that assigns an importance score to each input feature by approximating the integral of gradients of the model’s output with respect to the inputs along the path (straight line) from given baselines / references to inputs. Gauss-Legendre quadrature rule or Riemann sum are used to approximate the integral.
Furthermore, layer-wise attributions were also investigated.
Layer Activation with GBP: The guided backpropagation function is looped through layers in this process[3] to show the activations taking place in each layer during this attribution process.
Results
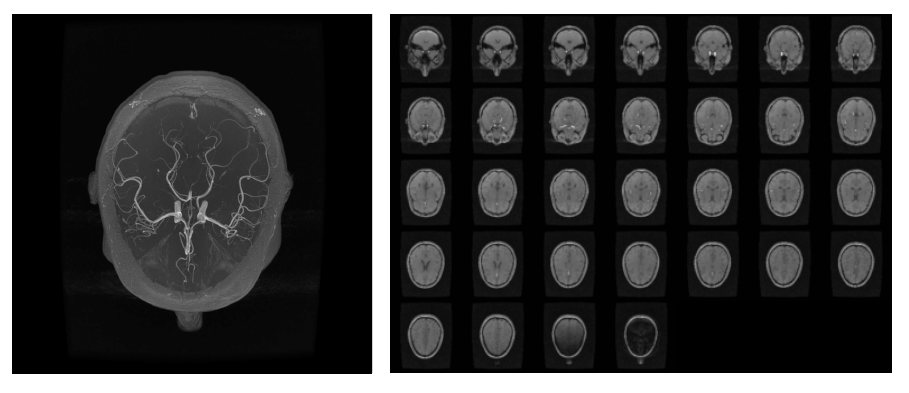
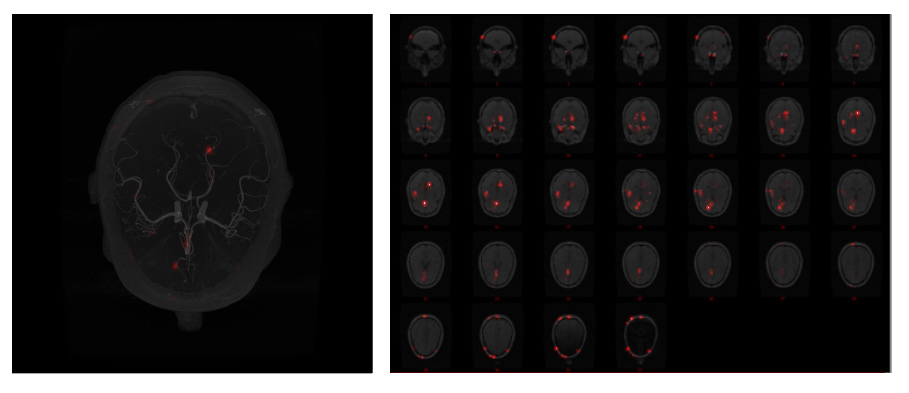
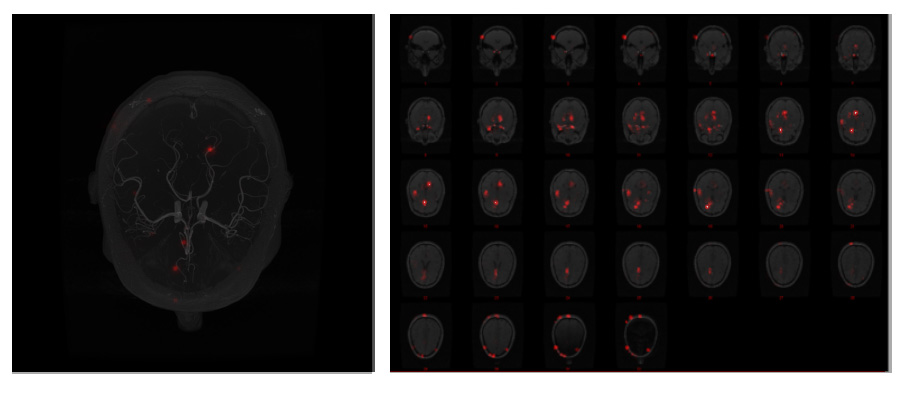
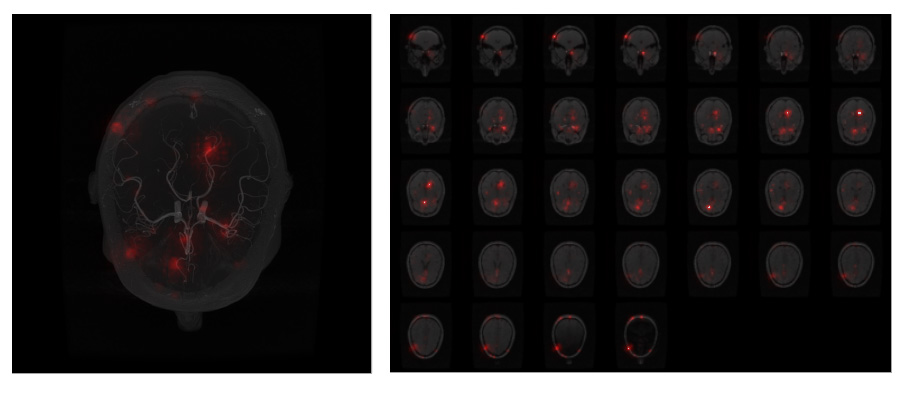
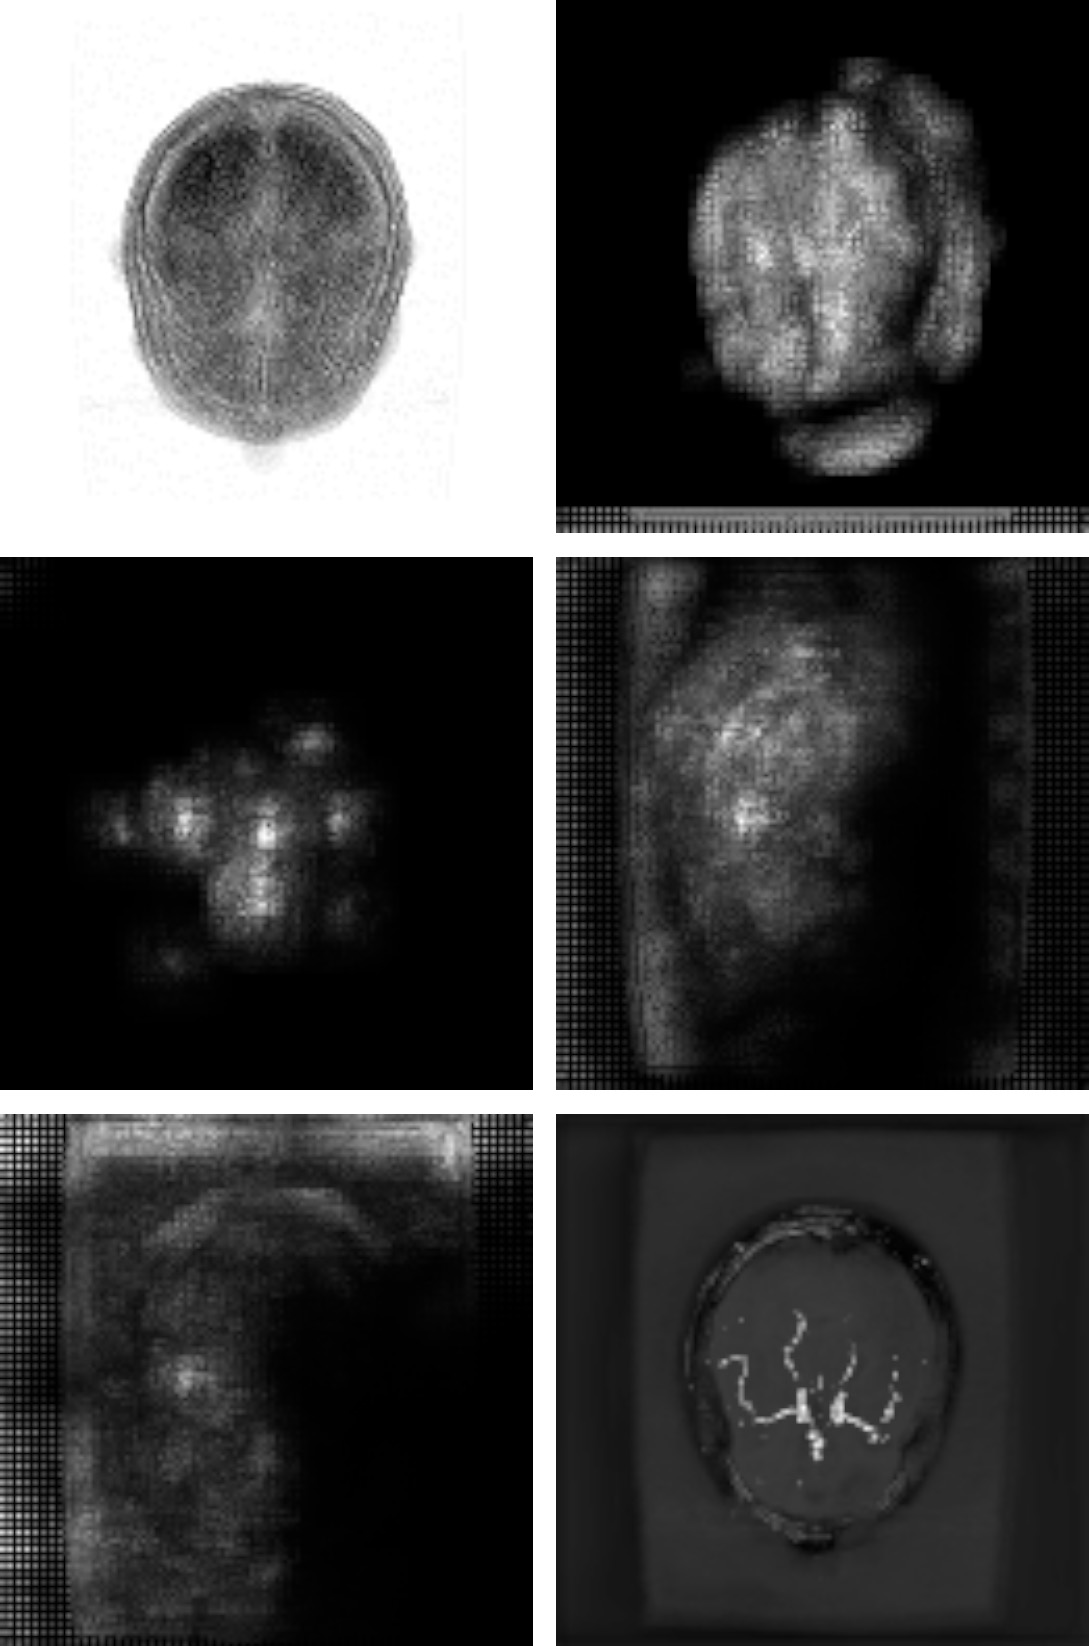
Due to the 3D nature of the data, all the visualizations have been performed with the help of maximum intensity projection (MIP) or montage of slices. Fig.1 shows the input volume. Fig.2 to Fig.4 show the model attribution given by the GBP, Deconvolution and Integrated Gradients respectively. Fig.5 shows the GBP attributions for every layer of the network. In all of these attribution maps, a pixel value of one (white) represents highest activation, indicating the most important pixels in the input; and zero (black) represents no activation.Discussion
While interpreting DS6, it was observed that all the three model attribution methods have attributed similar focus areas, mostly agreeing with each other. It can be observed that the focus area of the network didn’t directly co-relate with the vessels, rather than focusing on the posterior region of the brain. With the layer-wise attribution, it can be observed that in the first layer of the network, it focused outside the brain, followed by in the second layer it focused on the whole brain and in the third layer if focused mostly on the brainstem region. The focus of the fourth and fifth layer were somewhat distributed all over the image.Conclusion
In this work, various interpretability methods were adopted for segmentation models, and were interpret the network properly. The experiments were shown using DS6 model. Further investigations are underway to develop methods to provide scoring to the interpretations, to judge which method is more reliable for a given network.Acknowledgements
This work was in part conducted within the context of the International Graduate School MEMoRIAL at Otto von Guericke University (OVGU) Magdeburg, Germany, kindly supported by the European Structural and Investment Funds (ESF) under the programme "Sachsen-Anhalt WISSENSCHAFT Internationalisierung“ (project no. ZS/2016/08/80646).References
1. Chatterjee, S., Prabhu, K., Pattadkal, M., Bortsova, G., Dubost, F., Mattern, H., de Bruijne, M., Speck, O. and Nürnberger, A., 2020. DS6: Deformation-aware learning for small vessel segmentation with small, imperfectly labeled dataset. arXiv preprint arXiv:2006.10802.
2. Vedaldi, A., Fong, R. and Patrick, M., 2020. Understanding deep networks via extremal perturbations and smooth masks.
3. https://github.com/utkuozbulak/pytorch-cnn-visualizations
4. Sundararajan, M., Taly, A. and Yan, Q., 2017. Axiomatic attribution for deep networks. arXiv preprint arXiv:1703.01365.
5. Springenberg, J.T., Dosovitskiy, A., Brox, T. and Riedmiller, M., 2014. Striving for simplicity: The all convolutional net. arXiv preprint arXiv:1412.6806.
6. Zeiler, M.D. and Fergus, R., 2014, September. Visualizing and understanding convolutional networks. In European conference on computer vision (pp. 818-833). Springer, Cham.
7. W. James Murdocha,1, Chandan Singhb,1, Karl Kumbiera,2, Reza Abbasi-Aslb,c,d,2, and Bin Yua,b,3. Definitions, methods, and applications in interpretable machine learning
Figures