2397
Multidimensional analysis and detection of informative features in diffusion MRI measurements of human white matter
Adam C Richie-Halford1, Jason Yeatman2, Noah Simon3, and Ariel Rokem4
1eScienceInstitute, University of Washington, Seattle, WA, United States, 2Graduate School of Education and Division of Developmental and Behavioral Pediatrics, Stanford University, Stanford, CA, United States, 3Department of Biostatistics, University of Washington, Seattle, WA, United States, 4Department of Psychology, University of Washington, Seattle, WA, United States
1eScienceInstitute, University of Washington, Seattle, WA, United States, 2Graduate School of Education and Division of Developmental and Behavioral Pediatrics, Stanford University, Stanford, CA, United States, 3Department of Biostatistics, University of Washington, Seattle, WA, United States, 4Department of Psychology, University of Washington, Seattle, WA, United States
Synopsis
We present a novel method for the analysis of diffusion MRI tractometry data based on the sparse group lasso. It capitalizes on natural anatomical grouping of diffusion metrics, providing both accurate prediction of phenotypic information and results that are readily interpretable. We show the effectiveness of this approach in two settings. In a classification setting, patients with amyotrophic lateral sclerosis (ALS) are accurately distinguished from matched controls and SGL automatically identifies known anatomical correlates of ALS. In a regression setting, we accurately predict “brain age” in two previous dMRI studies. We demonstrate that our approach is both accurate and interpretable.
Introduction
Tractometry uses diffusion-weighted magnetic resonance imaging (dMRI) to quantify tissue properties along the trajectories of white matter connections1. Tractometry results are usually analyzed using mass univariate approaches, computed separately for each point along the tracts2, akin to voxel-wise analysis of functional MRI (fMRI) data. Alternatively, an a priori hypothesis-based approach is used, where tissue properties are computed for a specific tract of interest. In the present work, we introduce a method based on the sparse group lasso3 that uses all of the data, selecting informative features by enforcing sparsity and accounting for the natural anatomical grouping of tractometry data. The method is implemented as open-source software and available at https://github.com/richford/AFQ-Insight.Methods
The sparse group lasso (SGL) fits a linear model to the data, $$$y = \mathbf{X} \cdot \beta$$$, (Figure 1) where $$$y$$$ is a phenotype, either categorical, such as a clinical diagnosis, or numerical, such as a subject's age. The tractometry data is represented by the matrix $$$\mathbf{X}$$$, where rows correspond to subjects and columns correspond to tissue properties at different locations in the tracts. The relationship between tractometric features and phenotypic targets is characterized by the coefficients, $$$\beta$$$. The high dimensionality of the data - $$$\mathcal{O}$$$(10k) features - requires regularization, to avoid overfitting and generate interpretable results. SGL is a regularization procedure that fits the linear model while subjecting it to constraints on both global feature sparsity, and sparsity of anatomical groups of features, for example all of the tissue properties along a particular white matter tract. The sparsity penalties for these constraints are identified using a cross-validation scheme and sequential model based optimization. Thus, our approach recovers the minimal set of anatomical features to make accurate predictions. To further prevent overfitting and account for nonlinear relationships between the diffusion features and the target data, we construct bagging meta-estimators with SGL components, wherein the predicted outcome is the average of predictions from multiple SGL models trained on different bootstrap replicates of the original data. We validated our approach using data from three previous studies and compared to a baseline model using the LASSO4. An example dataset for classification contained data from 24 patients with ALS and 24 matched controls5. An example dataset for age regression contains data from 76 healthy subjects, ranging between 6 years and 50 years of age6. A larger dataset for validation of the regression approach contained 978 subjects between 5 years and 21 years of age from the Healthy Brain Network Study7.Results
Using data from a previous study that measured dMRI in patients with amyotrophic lateral sclerosis (ALS) and matched controls5, we demonstrate that this method competes with previous results, based on a priori feature selection, in classifying patients and controls with an accuracy of 86% (Figure 2), improving upon the LASSO baseline by 10%. Moreover, our method automatically identifies the corticospinal tract as the critical feature for differentiating ALS patients from controls: thus, well-known features of the disease can be recovered through an automated, data-driven approach. In a regression setting, data from another previous study6 can be used to accurately predict "brain age" with a median absolute error (MAE) of 3.9 years and a coefficient of determination of 0.52 (Figure 3), compared to the LASSO baseline of 4.9 MAE. On a larger pediatric dataset7, the SGL approach can predict “brain age” with an MAE of 1.5 years and a coefficient of determination of 0.56 (Figure 4). Thus, this multivariate analysis approach both (a) achieves high cross-validated accuracy for precision medicine applications of dMRI data and (b) identifies relevant features of brain anatomy to further our neuroscientific understanding of clinical disorders.Discussion and Conclusions
We introduce a novel method for analysis of dMRI tractometry data that provides both accurate prediction of phenotypic information, as well as results that are readily interpretable. SGL also presents a significant departure from previous methods for analysis of tractometry data: rather than providing p-values for each individual location in the brain, the statistical accuracy of this method focuses on the accuracy of the predictions of phenotypic data. More broadly, AFQ-Insight, the open-source software that implements the method described here fits into a broader ecosystem of tools including the AFQ software1, which analyzes the dMRI data to produce the initial tractometry results, and AFQ-Browser8, which can be used to visualize, analyze and share these results.Acknowledgements
This work was supported by BRAIN Initiative grant 1RF1MH121868-01 from the National Institutes for Mental Health and by a grant from the Gordon & Betty Moore Foundation and the Alfred P. Sloan Foundation to the University of Washington eScience Institute Data Science Environment. We would like to thank Scott Murray for a useful discussion of the SGL method and Mareike Grotheer for helpful comments on the abstract.References
- Yeatman, J. D., Dougherty, R. F., Myall, N. J., Wandell, B. A. & Feldman, H. M. Tract Profiles of White Matter Properties: Automating Fiber-Tract Quantification. PLoS One 7, e49790 (2012).
- Colby, J. B., Soderberg, L., Lebel, C., Dinov, I. D., Thompson, P. M. & Sowell, E. R. Along-tract statistics allow for enhanced tractography analysis. Neuroimage 59, 3227–3242 (2012).
- Simon, N., Friedman, J., Hastie, T. & Tibshirani, R. A Sparse-Group Lasso. J. Comput. Graph. Stat. 22, 231–245 (2013).
- Tibshirani, R. Regression Shrinkage and Selection via the Lasso. J. R. Stat. Soc. Series B Stat. Methodol. 58, (1996).
- Sarica, A., Cerasa, A., Valentino, P., Yeatman, J., Trotta, M., Barone, S., Granata, A., Nisticò, R., Perrotta, P., Pucci, F. & Quattrone, A. The corticospinal tract profile in amyotrophic lateral sclerosis. Hum. Brain Mapp. 38, 727–739 (2017).
- Yeatman, J. D., Wandell, B. A. & Mezer, A. A. Lifespan maturation and degeneration of human brain white matter. Nat. Commun. 5, 4932 (2014).
- Alexander, L. M., Escalera, J., Ai, L., Andreotti, C., Febre, K., Mangone, A., Vega-Potler, N., Langer, N., Alexander, A., Kovacs, M., Litke, S., O’Hagan, B., Andersen, J., Bronstein, B., Bui, A., Bushey, M., Butler, H., Castagna, V., Camacho, N., Chan, E., Citera, D., Clucas, J., Cohen, S., Dufek, S., Eaves, M., Fradera, B., Gardner, J., Grant-Villegas, N., Green, G., Gregory, C., Hart, E., Harris, S., Horton, M., Kahn, D., Kabotyanski, K., Karmel, B., Kelly, S. P., Kleinman, K., Koo, B., Kramer, E., Lennon, E., Lord, C., Mantello, G., Margolis, A., Merikangas, K. R., Milham, J., Minniti, G., Neuhaus, R., Levine, A., Osman, Y., Parra, L. C., Pugh, K. R., Racanello, A., Restrepo, A., Saltzman, T., Septimus, B., Tobe, R., Waltz, R., Williams, A., Yeo, A., Castellanos, F. X., Klein, A., Paus, T., Leventhal, B. L., Craddock, R. C., Koplewicz, H. S. & Milham, M. P. An open resource for transdiagnostic research in pediatric mental health and learning disorders. Scientific Data 4, 170181 (2017).
- Yeatman, J. D., Richie-Halford, A., Smith, J. K., Keshavan, A. & Rokem, A. A browser-based tool for visualization and analysis of diffusion MRI data. Nat. Commun. 9, 940 (2018).
Figures
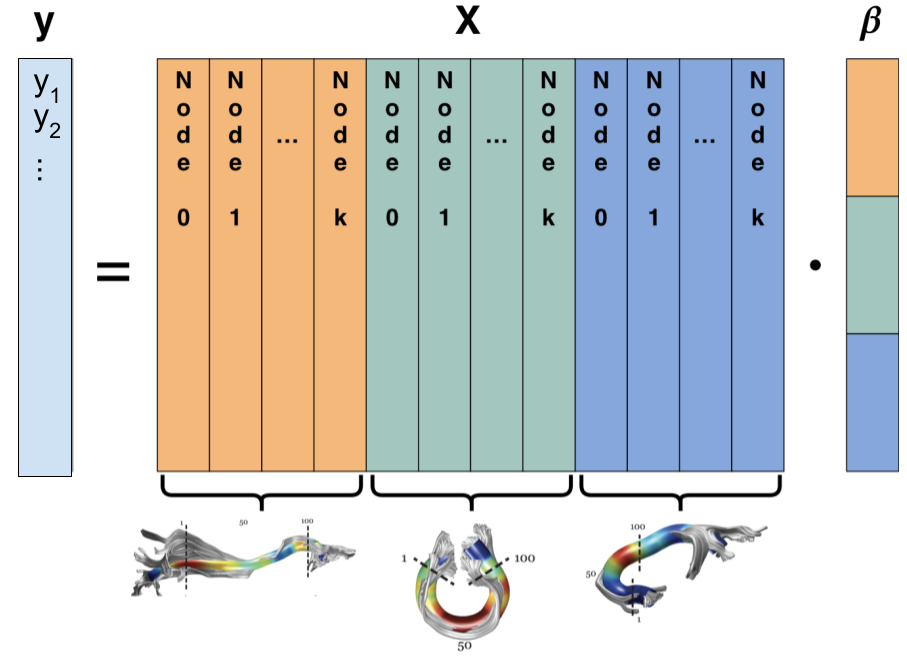
Figure 1: dMRI group structure. The phenotypical target data and tractometric
features can be organized into a linear model, $$$y = \mathbf{X} \cdot \beta$$$. The feature matrix $$$\mathbf{X}$$$ is
color-coded to reveal a natural group structure: the left (orange) group contains $$$k$$$ features from the inferior fronto-occipital fascicle (IFOF), the middle (green) group
contains $$$k$$$ features from the corpus callosum, and the right (blue) group contains $$$k$$$ features from the uncinate. The coefficients in $$$\beta$$$ follow the same natural grouping.
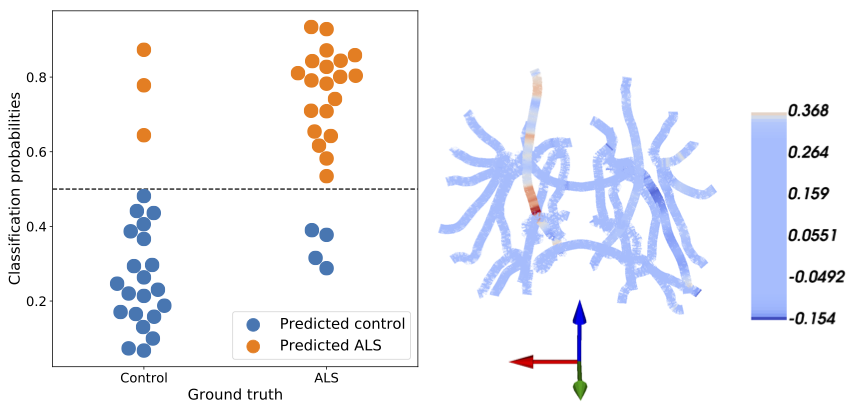
Figure 2: SGL accurately predicts ALS. Left: classification probabilities for each
subject’s ALS diagnosis. Controls are on the left, patients are on the right, predicted controls are in blue, and predicted patients are in orange. The SGL algorithm achieves 86% accuracy. Right: SGL coefficients are presented on a skeleton of the major white matter fiber tracts. The
brain is oriented with the right hemisphere to our left and anterior out of the page. As
expected large coefficients are in the fractional anisotropy of the corticospinal tract.
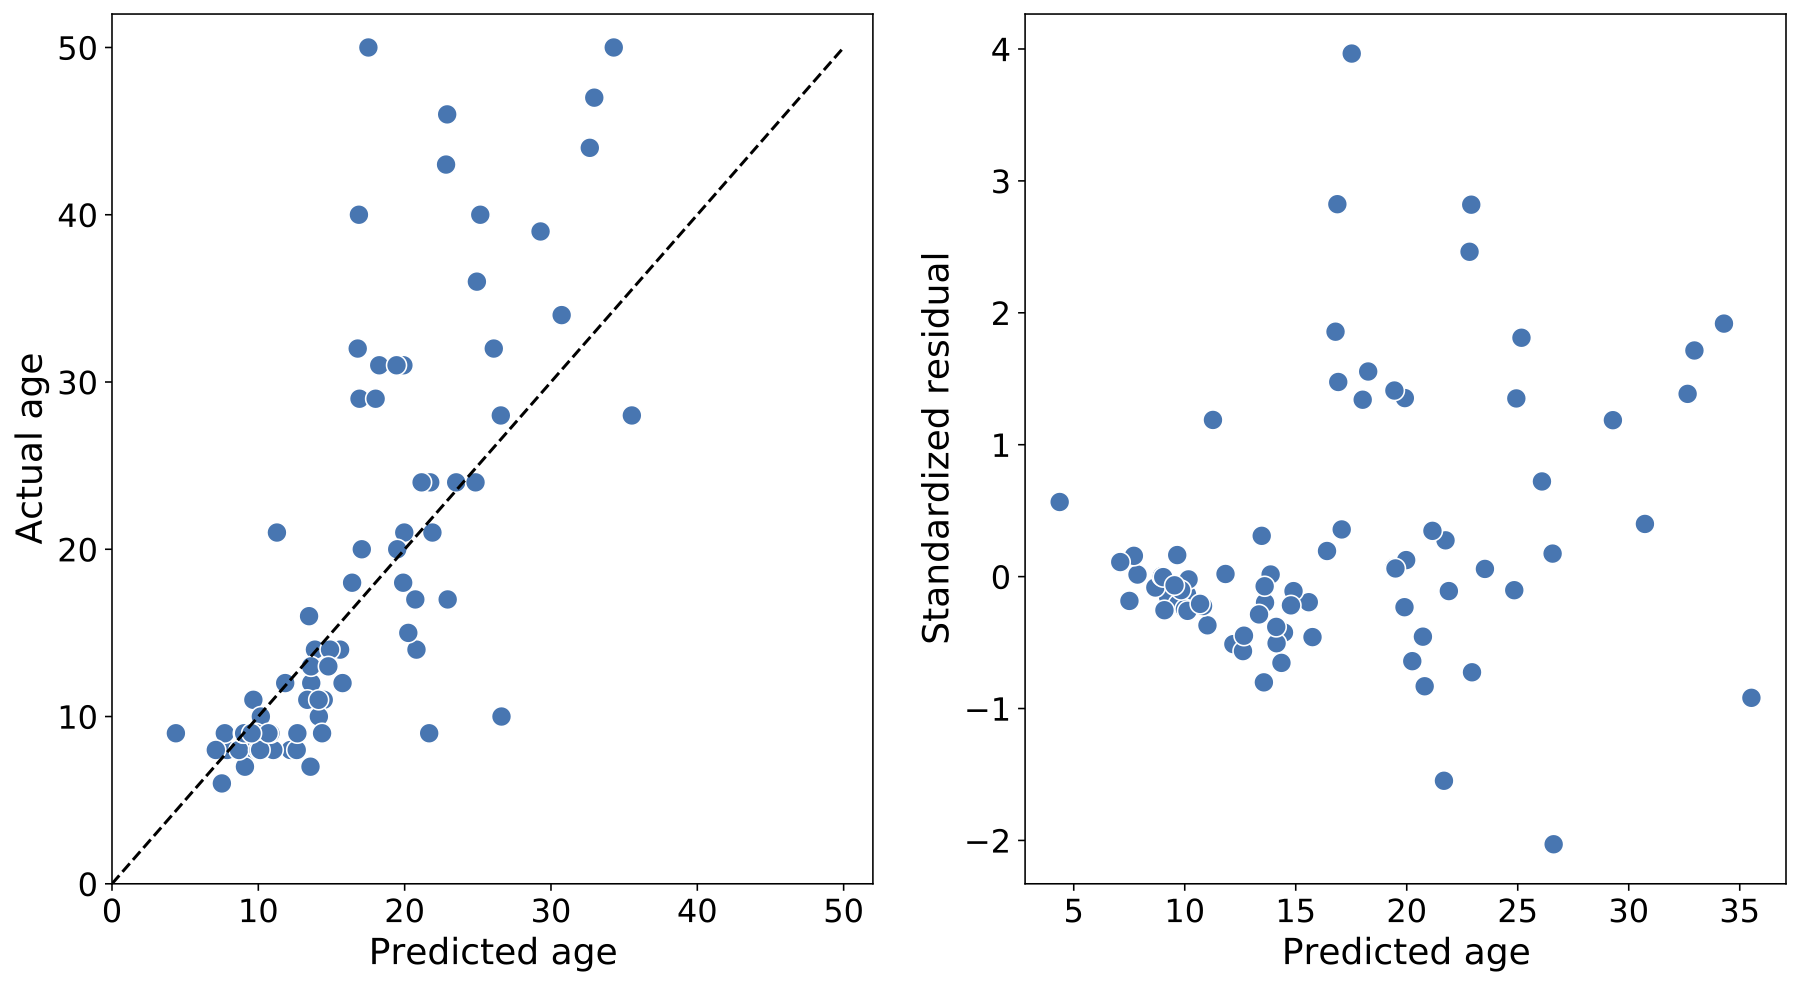
Figure 3: Predicting age with tractometry and SGL. Left: The predicted age of
each individual (on the abscissa) and true age (on the ordinate), from the test splits
(i.e., when each subject’s data was held out in fitting the model); an accurate prediction
falls close to the $$$y = x$$$ line (dashed). The mean absolute error in this case is 3.9 years
and, the coefficient of determination R2 = 0.52. Right: Standardized residuals (on the
abscissa) as a function of the true age (on the ordinate). Predictions are generally more
accurate for younger individuals.
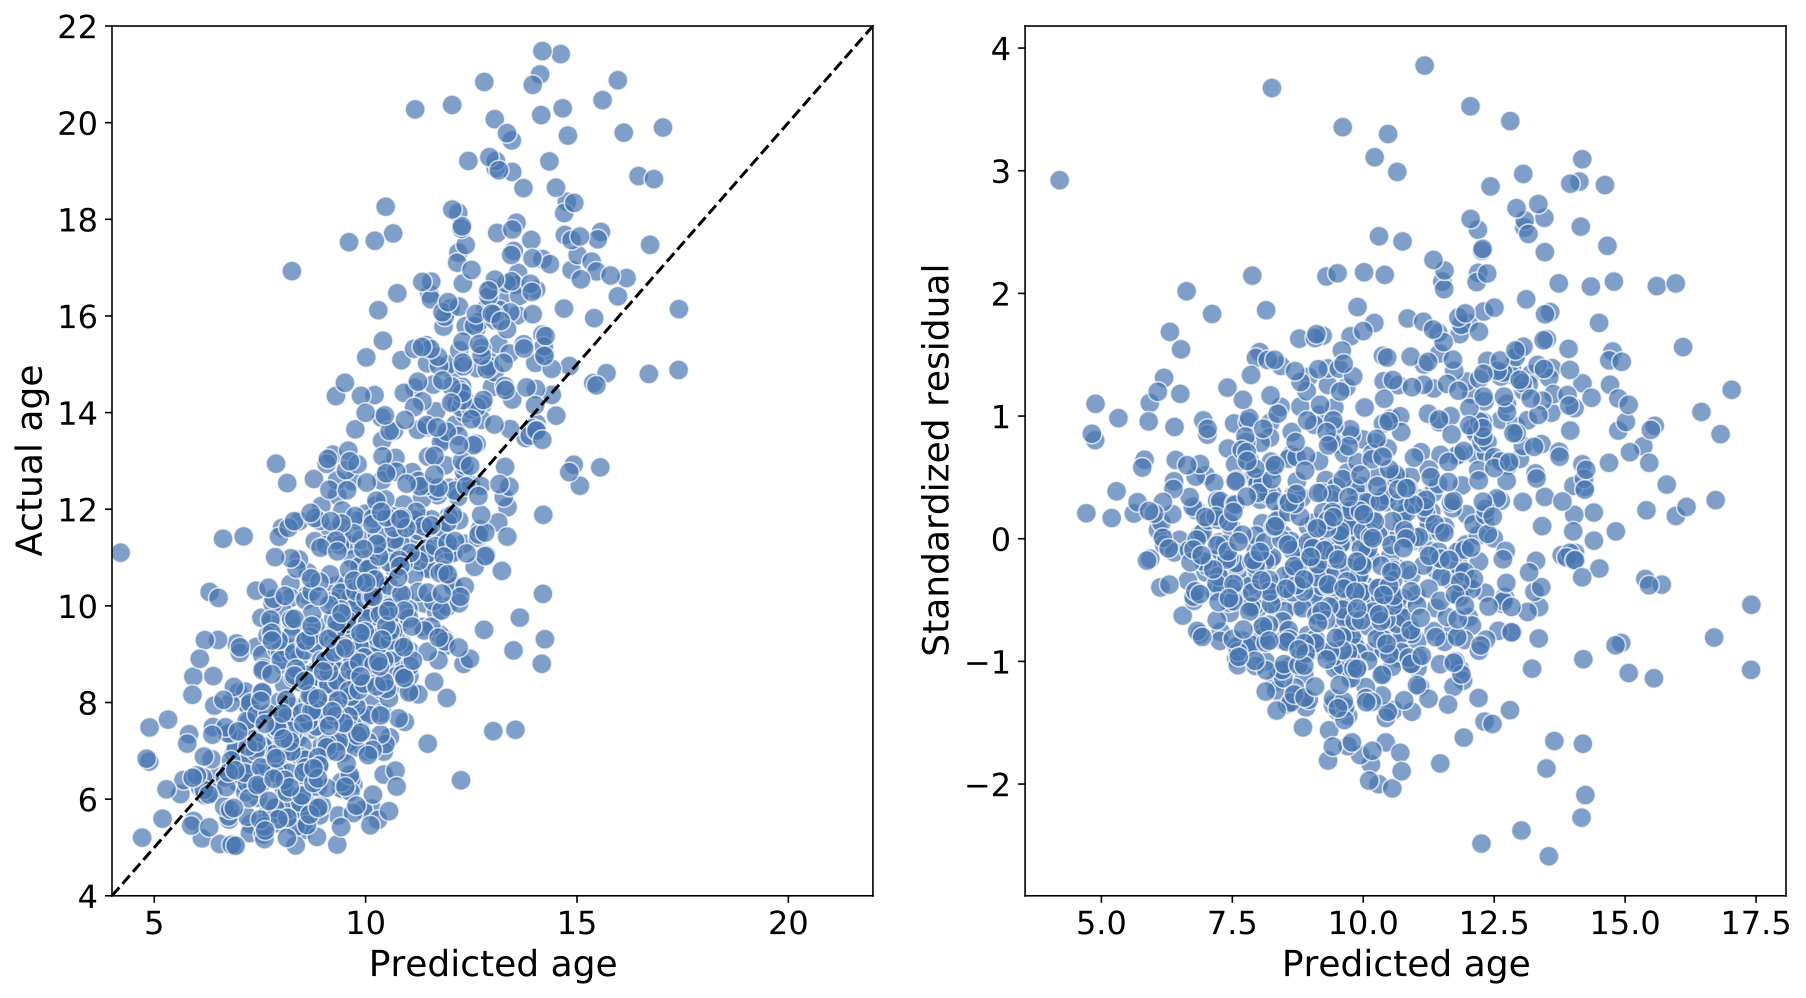
Figure 4: Predicting age in the Healthy Brain Network, a large pediatric neuroimaging study. Left: The predicted age of each individual (on the abscissa) and true age (on the ordinate), from the test splits (i.e., when each subject’s data was held out in fitting the model); an accurate prediction falls close to the $$$y = x$$$ line (dashed). The mean absolute error in this case is 1.5 years and R2 = 0.56. Right: Standardized residuals (on the abscissa) as a function of the true age (on the ordinate). Predictions are generally more accurate for younger individuals.