2395
Isotropic water content mapping employing super-resolution reconstruction with acquisition in three orthogonal orientations1Institute of Neuroscience and Medicine-4, Forschungszentrum Jülich, Jülich, Germany, 2RWTH Aachen University, Aachen, Germany, 3Department of Radiology and Nuclear medicine, Erasmus Medical Center, Rotterdam, Netherlands, 4Department of Neurology, RWTH Aachen University, Aachen, Germany, 5Institute of Neuroscience and Medicine 11, INM-11, JARA, Forschungszentrum Jülich, Jülich, Germany, 6JARA - BRAIN - Translational Medicine, Aachen, Germany
Synopsis
Tissue water content is highly regulated in the healthy brain, and even small changes are indicative of pathology. It also constitutes an important source of anatomic MRI contrast. However, this contrast remains insufficiently explored, partly due to lengthy measurement times and relatively low resolution. Super-resolution reconstruction techniques offer a trade-off between resolution, scan time and SNR.The goal of this work was to develop a technique to achieve high resolution, whole-brain water content maps by employing super-resolution reconstruction techniques. Results from the developed technique were evaluated with a carrageenan phantom and whole-brain water content maps acquired from a healthy volunteer.
Introduction
Tissue water content is highly regulated in the healthy brain, and even small changes are indicative of pathology1–3. Techniques to precisely measure water content in the human brain non-invasively with MRI have been previously developed4-8. It has been shown that MRI-based water content evaluation on a whole-brain level has discriminatory power to differentiate between diseased and healthy individuals9. Isotropic, high resolution water content maps can be achieved with 3D techniques10, however, these require long scan times such that motion artefacts become a concern. Shorter, clinically relevant, 2D acquisitions for water content mapping have been proposed4, but using non-isotropic voxels and slice gaps for whole-brain coverage. Slice selection in gradient echo-based sequences is limited in resolution, especially when short echo times are required. Therefore, we aim to use the time advantages afforded by 2D imaging while also achieving high isotropic resolution by combining data from several short scans using super-resolution reconstruction (SRR)11,12.Methods
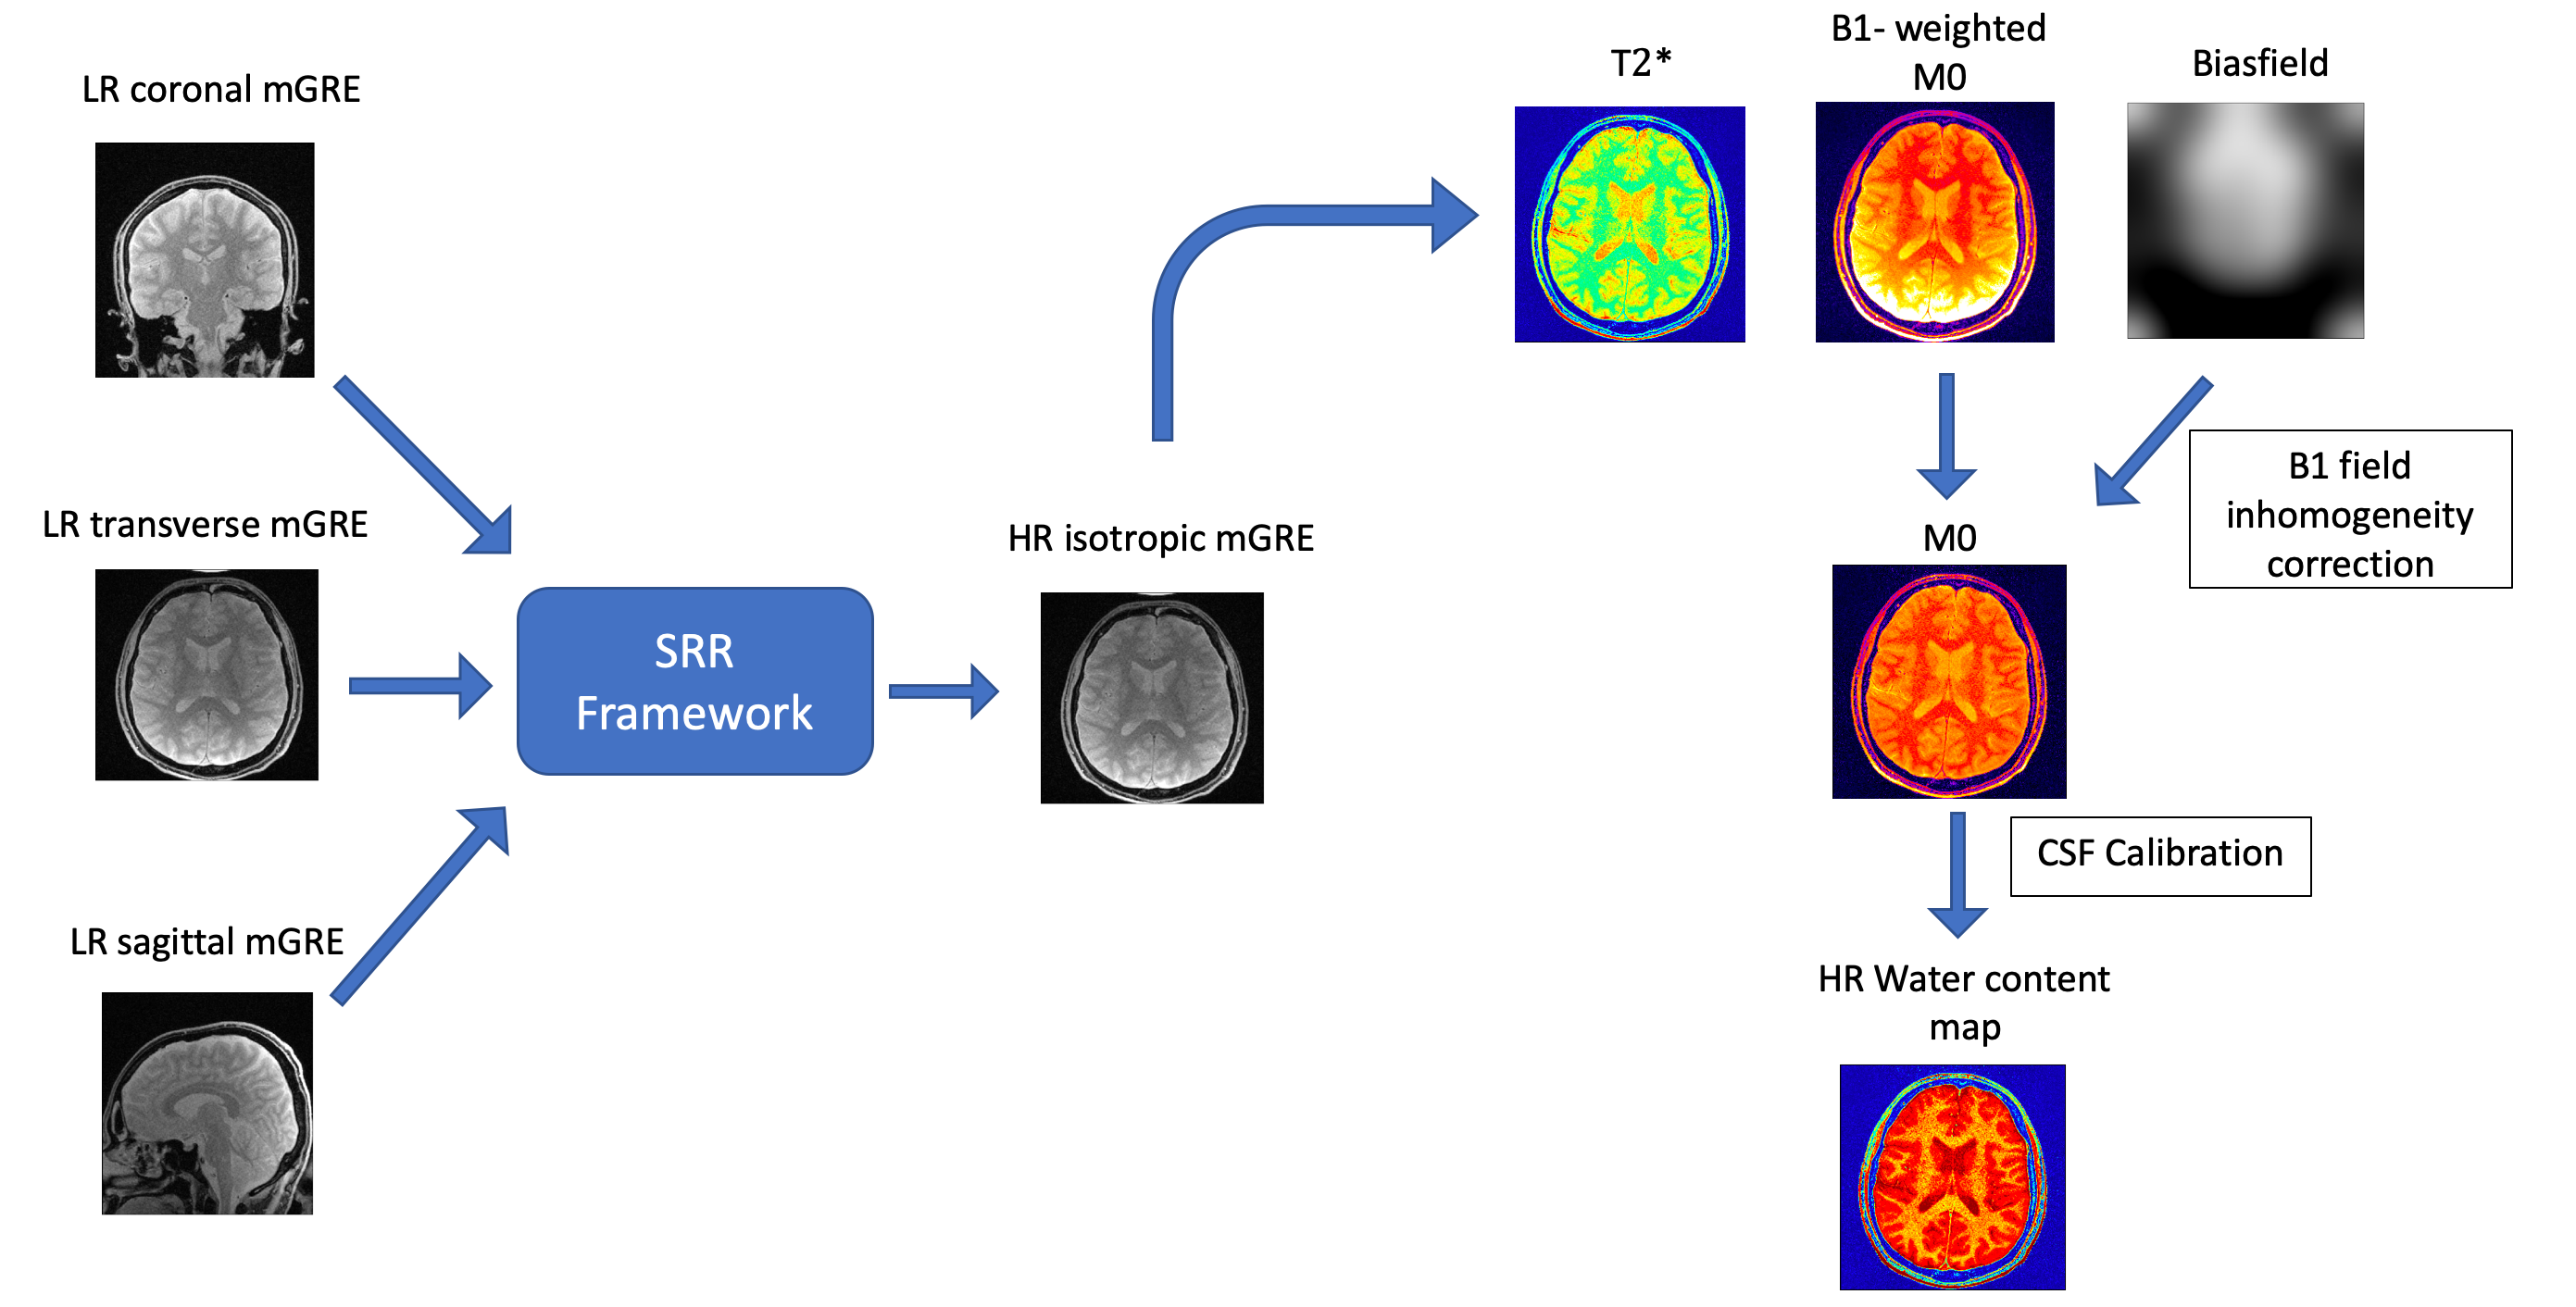
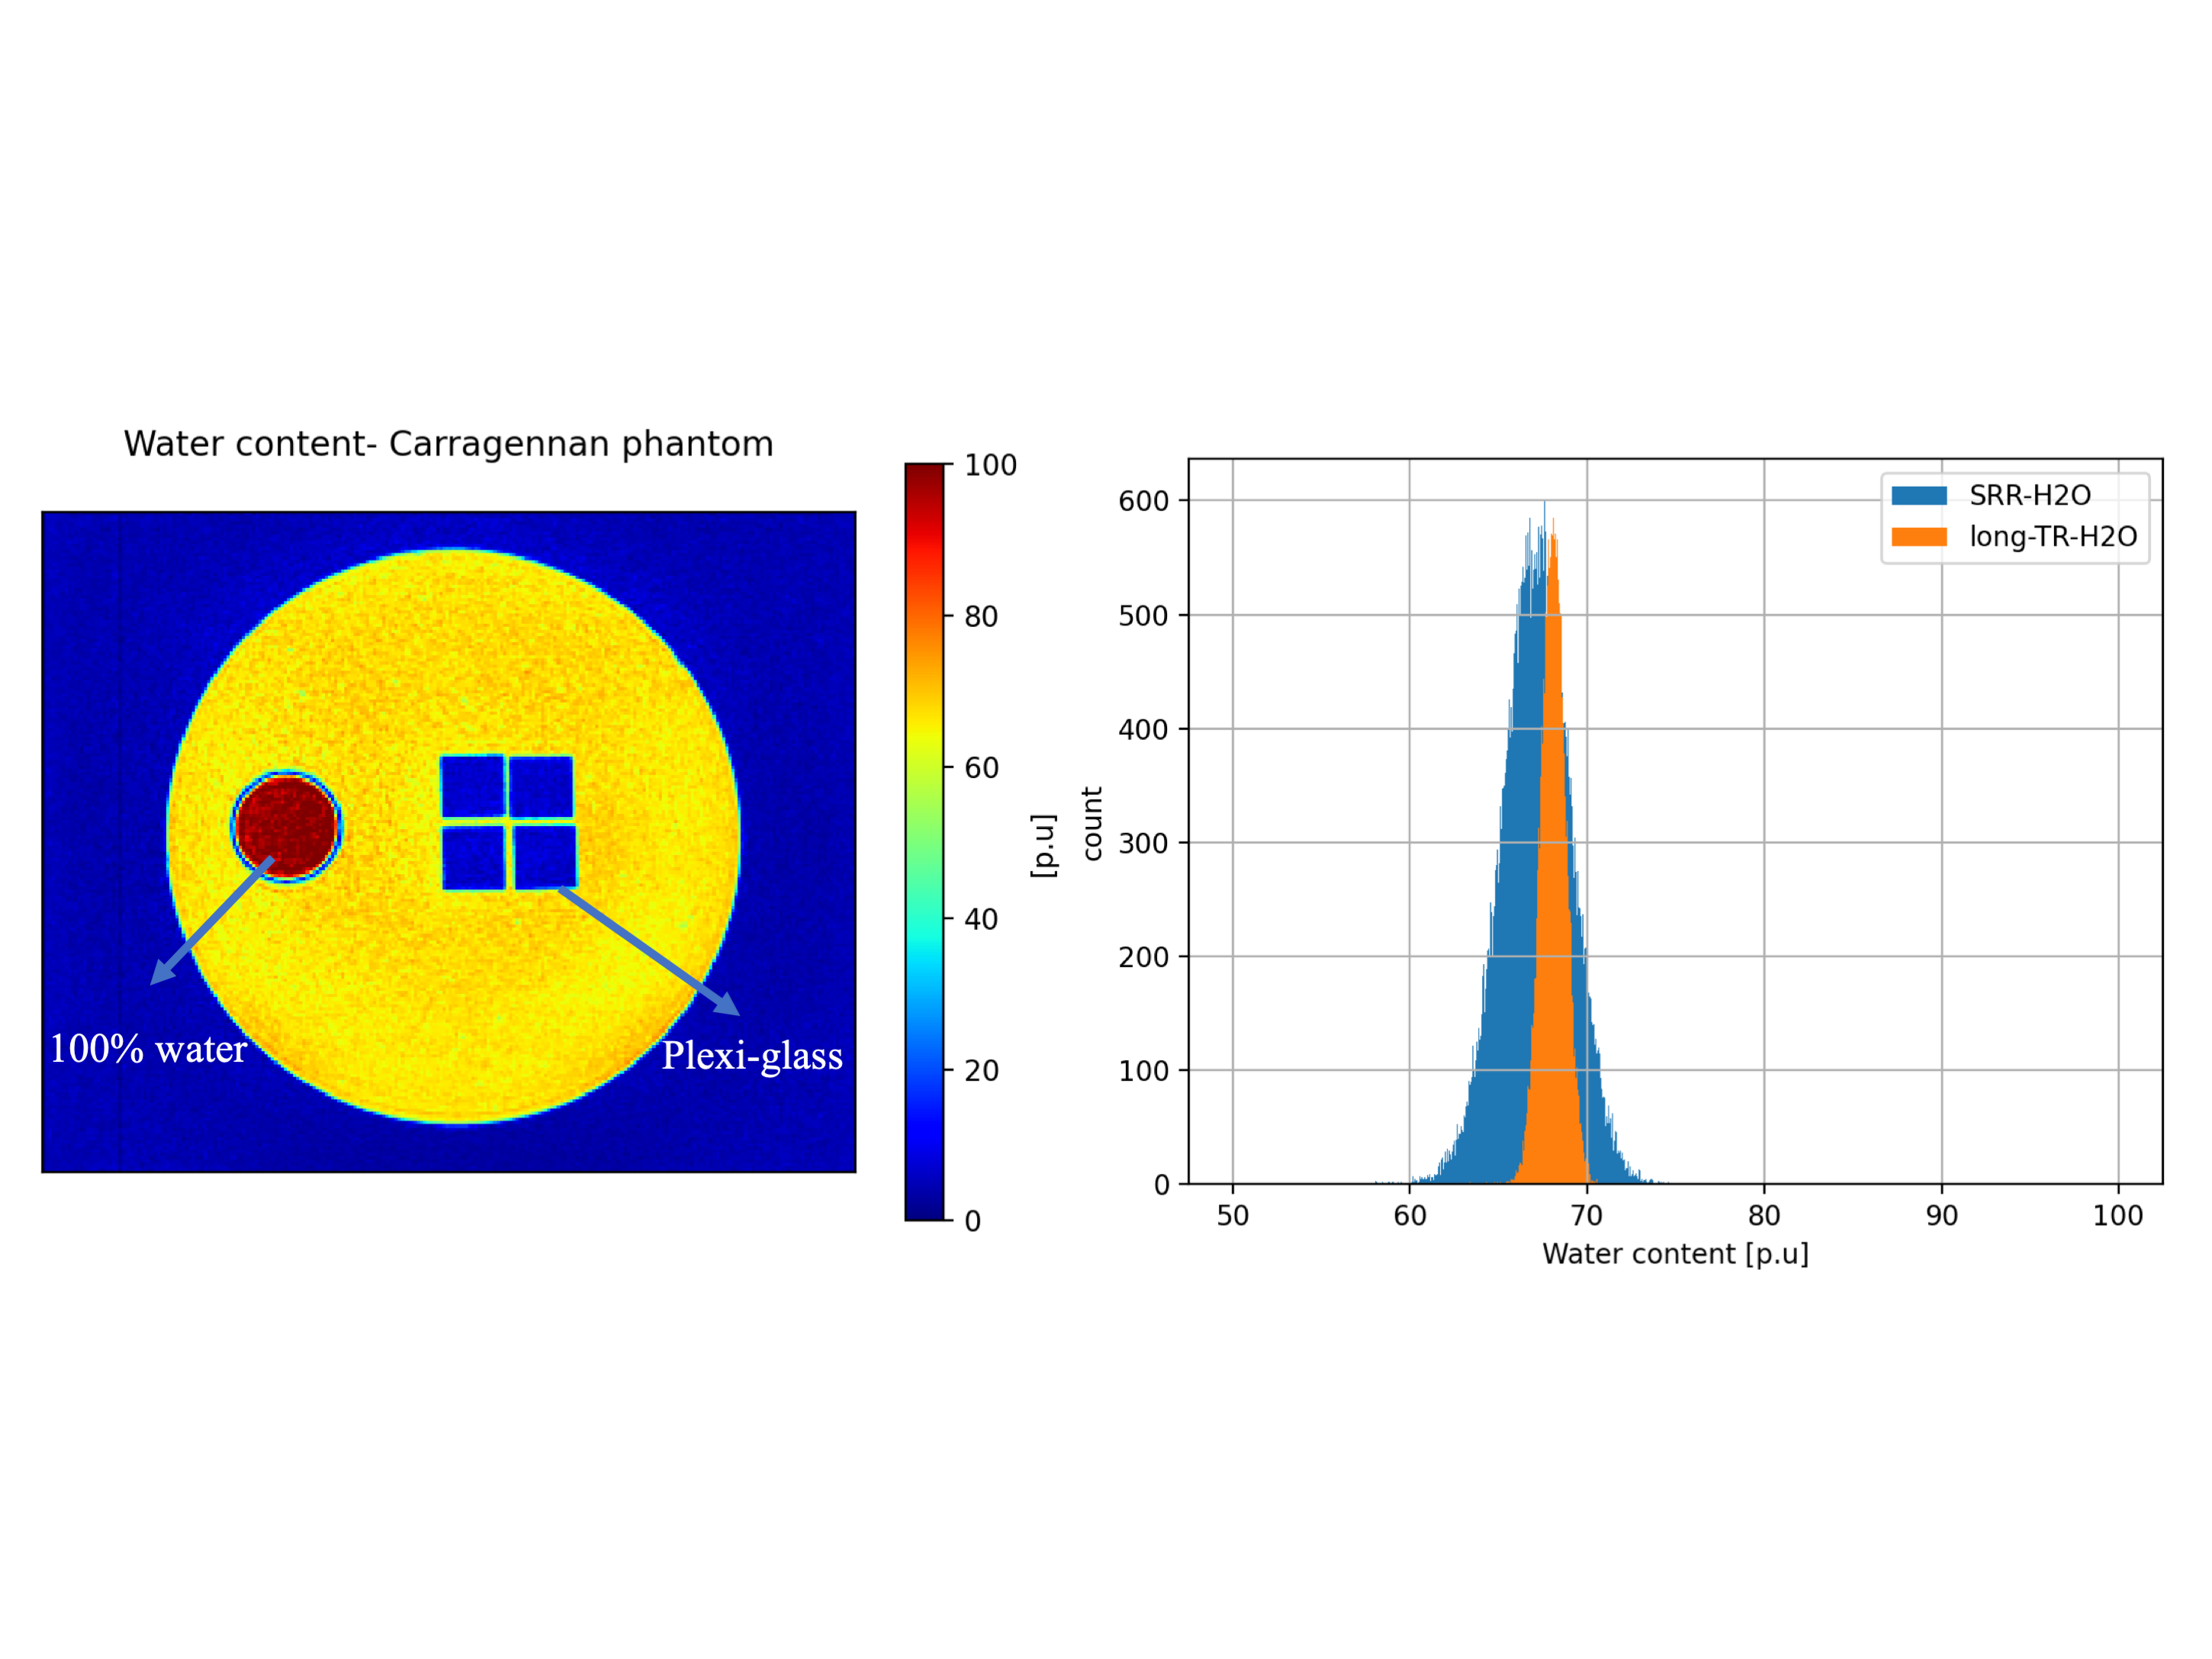
Super-resolution reconstruction- water content (SRR-H2O) mapping technique: For SRR-H2O, three low resolution (LR), multiple-echo spoiled gradient echo (mGRE) images were acquired in orthogonal orientations with slice thickness =$$$2mm$$$, in-plane resolution = $$$0.75mm×0.75mm$$$,$$$TR=3270ms$$$,$$$FA=15°$$$. The relatively low $$$TR$$$ value was chosen to decrease the total acquisition time ($$$TA$$$) (three times the $$$TA$$$ for a single LR dataset). The 15° flip angle ($$$FA$$$) ensures negligible T1 weighting. These LR images were then reconstructed to one high resolution (HR) mGRE image with isotropic resolution, using a conjugate-gradient based SRR method12. The original method describes the reconstruction of one HR image from multiple LR images for anatomical 2D multi-slice MRI data which was modified and adapted here for water content mapping (4D mGRE data) as follows. The first echo of the HR mGRE dataset was reconstructed with the original method from the first echo of each LR dataset. The affine transform parameters that aligned those images were then re-used to separately reconstruct the remaining echoes of the mGRE dataset to obtain an HR mGRE image of isotropic resolution , which was then used to perform water content mapping as described in 4 (schematic shown in figure 1).The developed technique was validated using a carrageenan phantom13,14 (figure 2). In order to assess potential influences from the SRR reconstruction on the quantitative performance of the method, the isotropic resolution H2O map obtained from the SRR-reconstructed data was compared to the H2O map obtained using the ‘long-TR’ method (reference method).
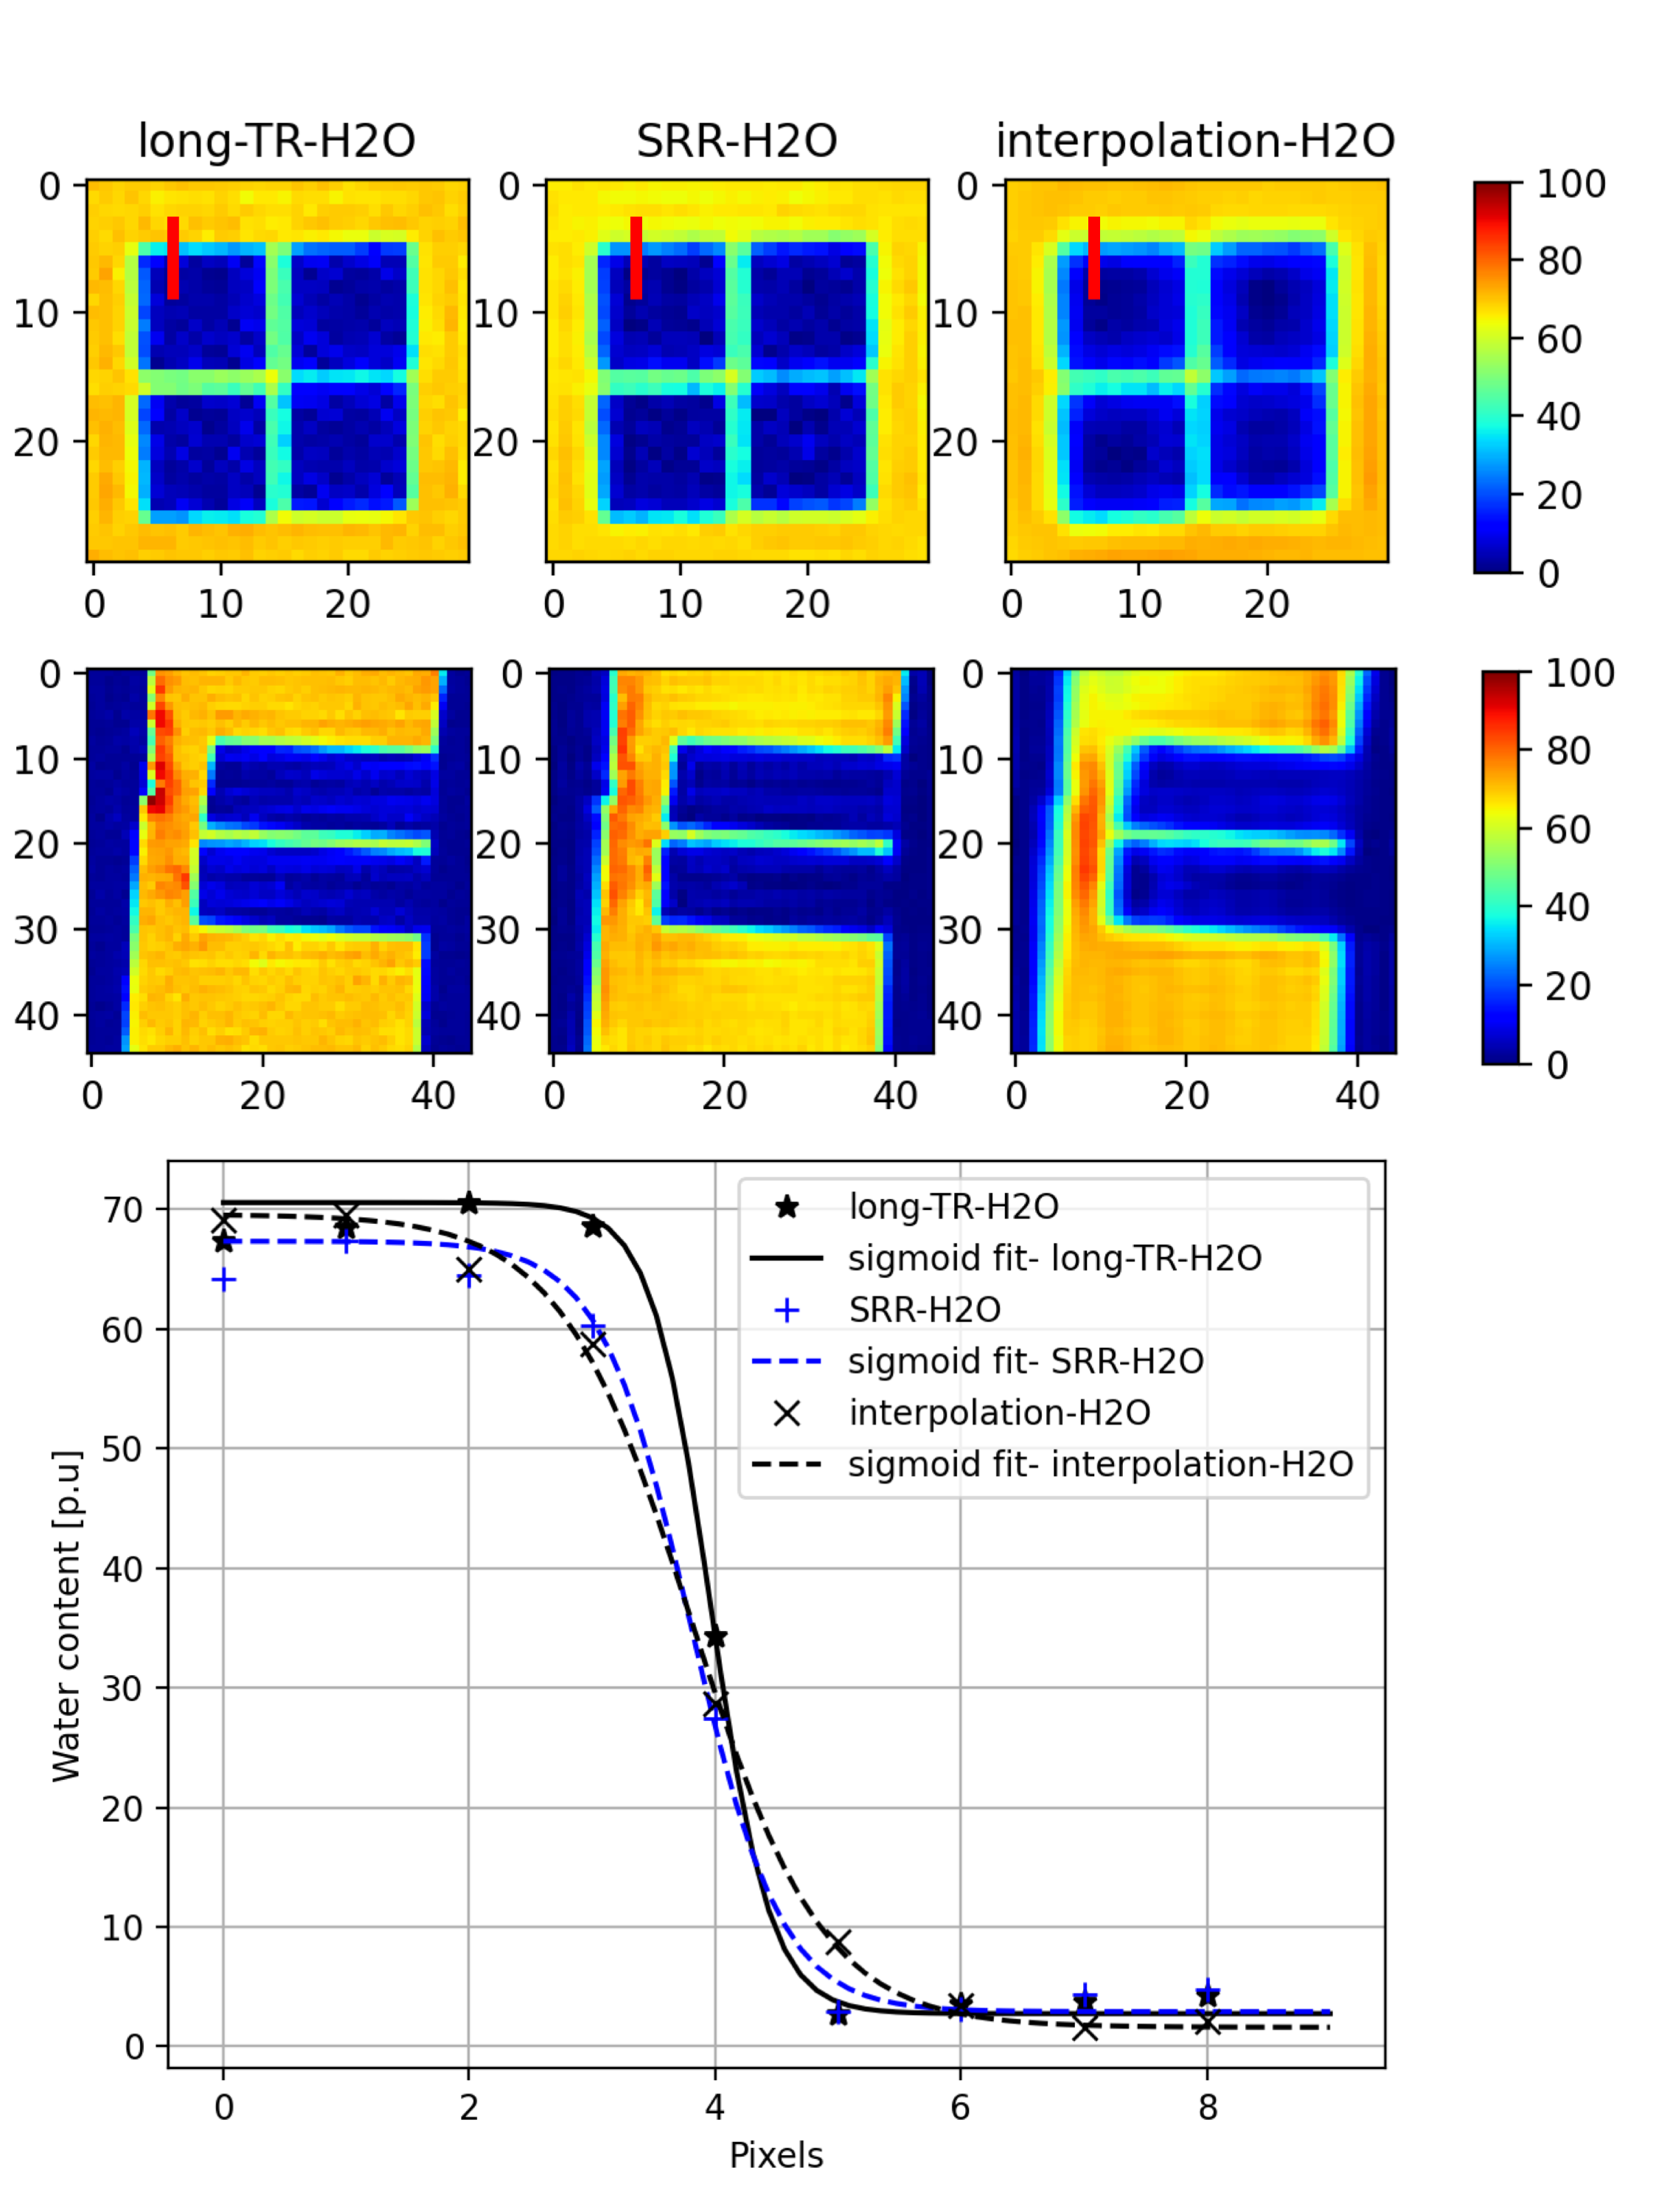
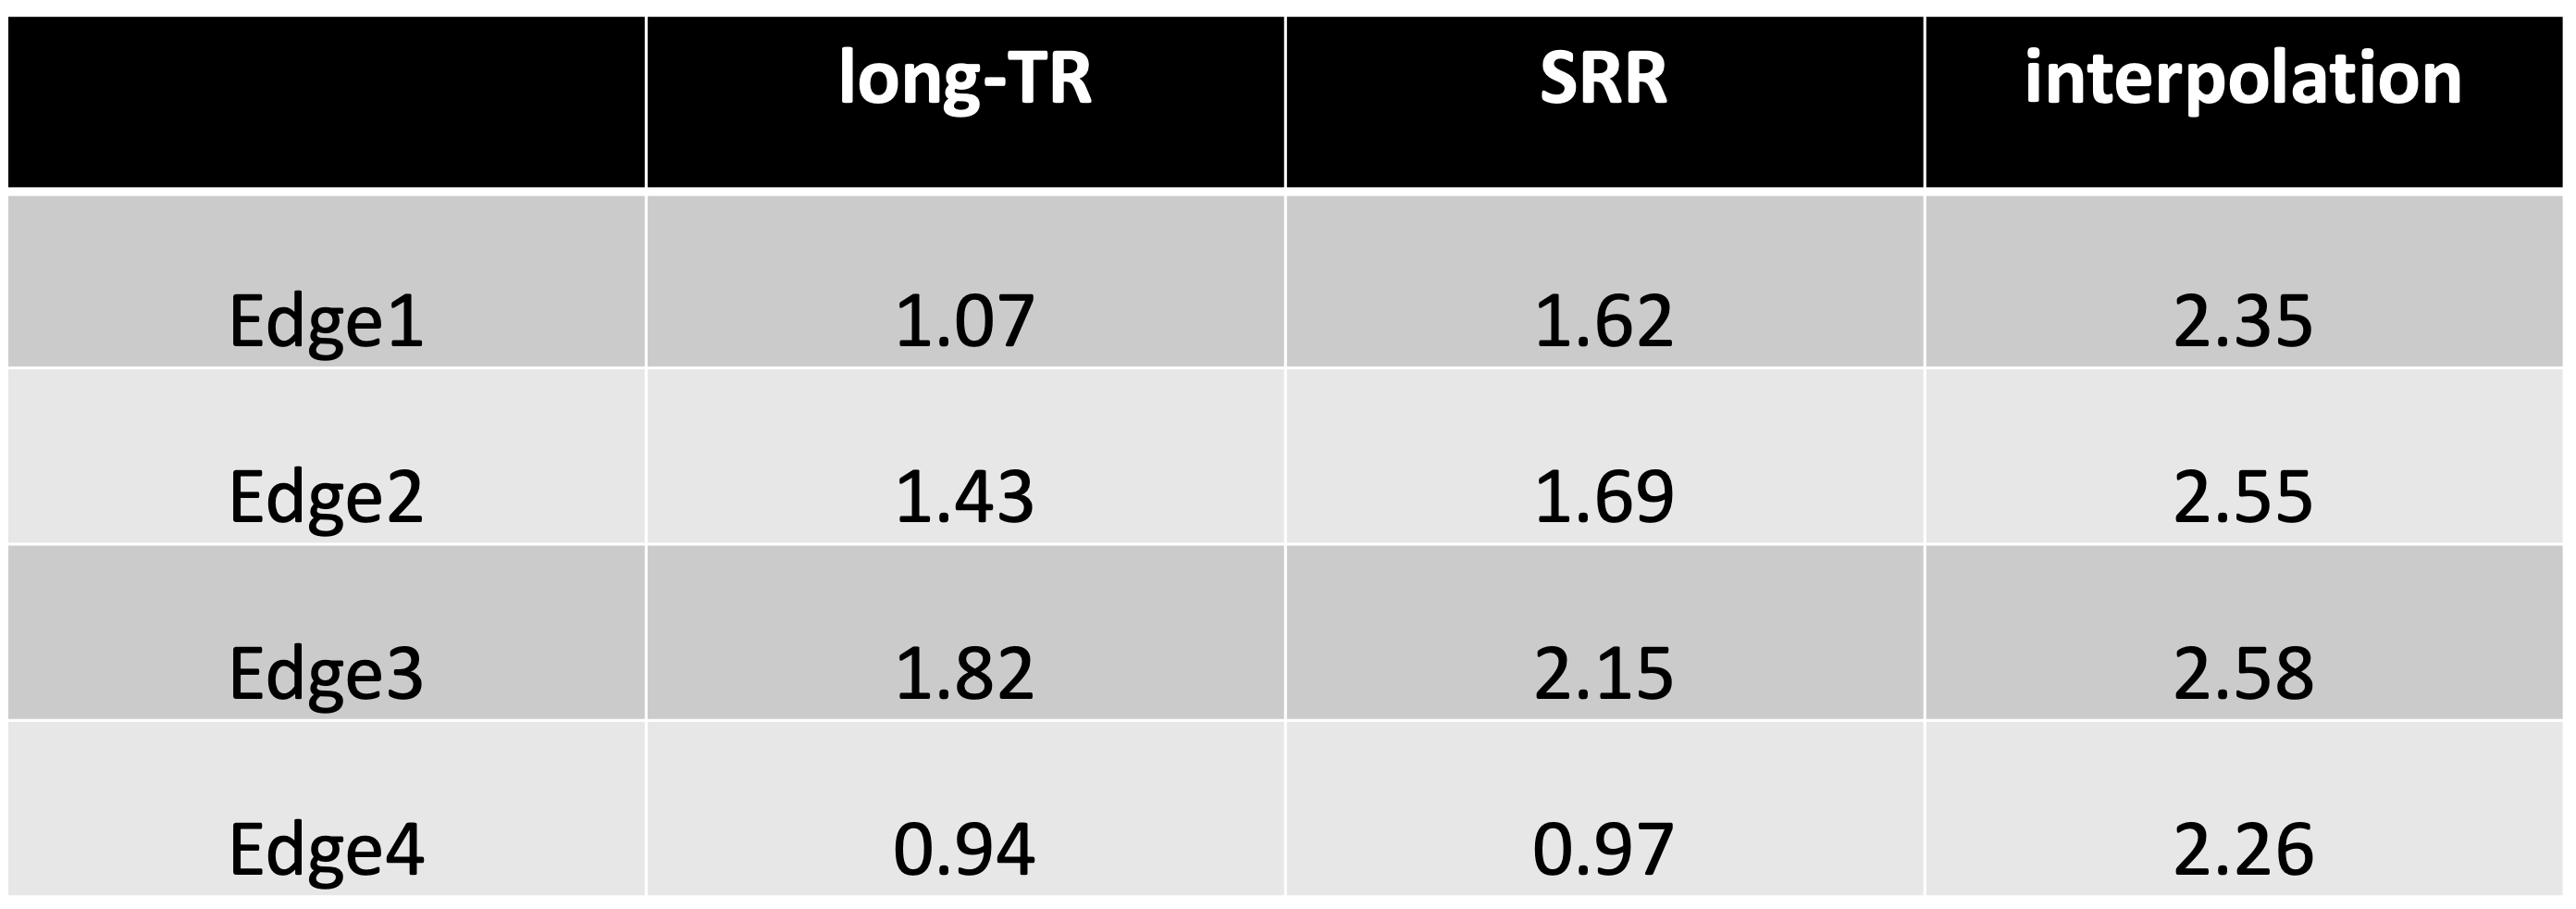
A separate set of LR acquisitions was made with voxel dimensions $$$1.5mm×1.5mm×4.5mm$$$to reconstruct $$$(1.5mm)^3$$$isotropic SRR-H2O maps. Edge width analysis15 was performed on SRR-H2O maps, interpolation-H2O maps (achieved by co-registration and zero-padding interpolation of the LR images acquired) and LongTR-H2O maps of $$$(1.5mm)^3$$$isotropic resolution.
In vivo results were obtained from a healthy volunteer (male, 26yrs). All measurements were carried out using 3T PRISMA scanner, Siemens, Erlangen, Germany.
Results
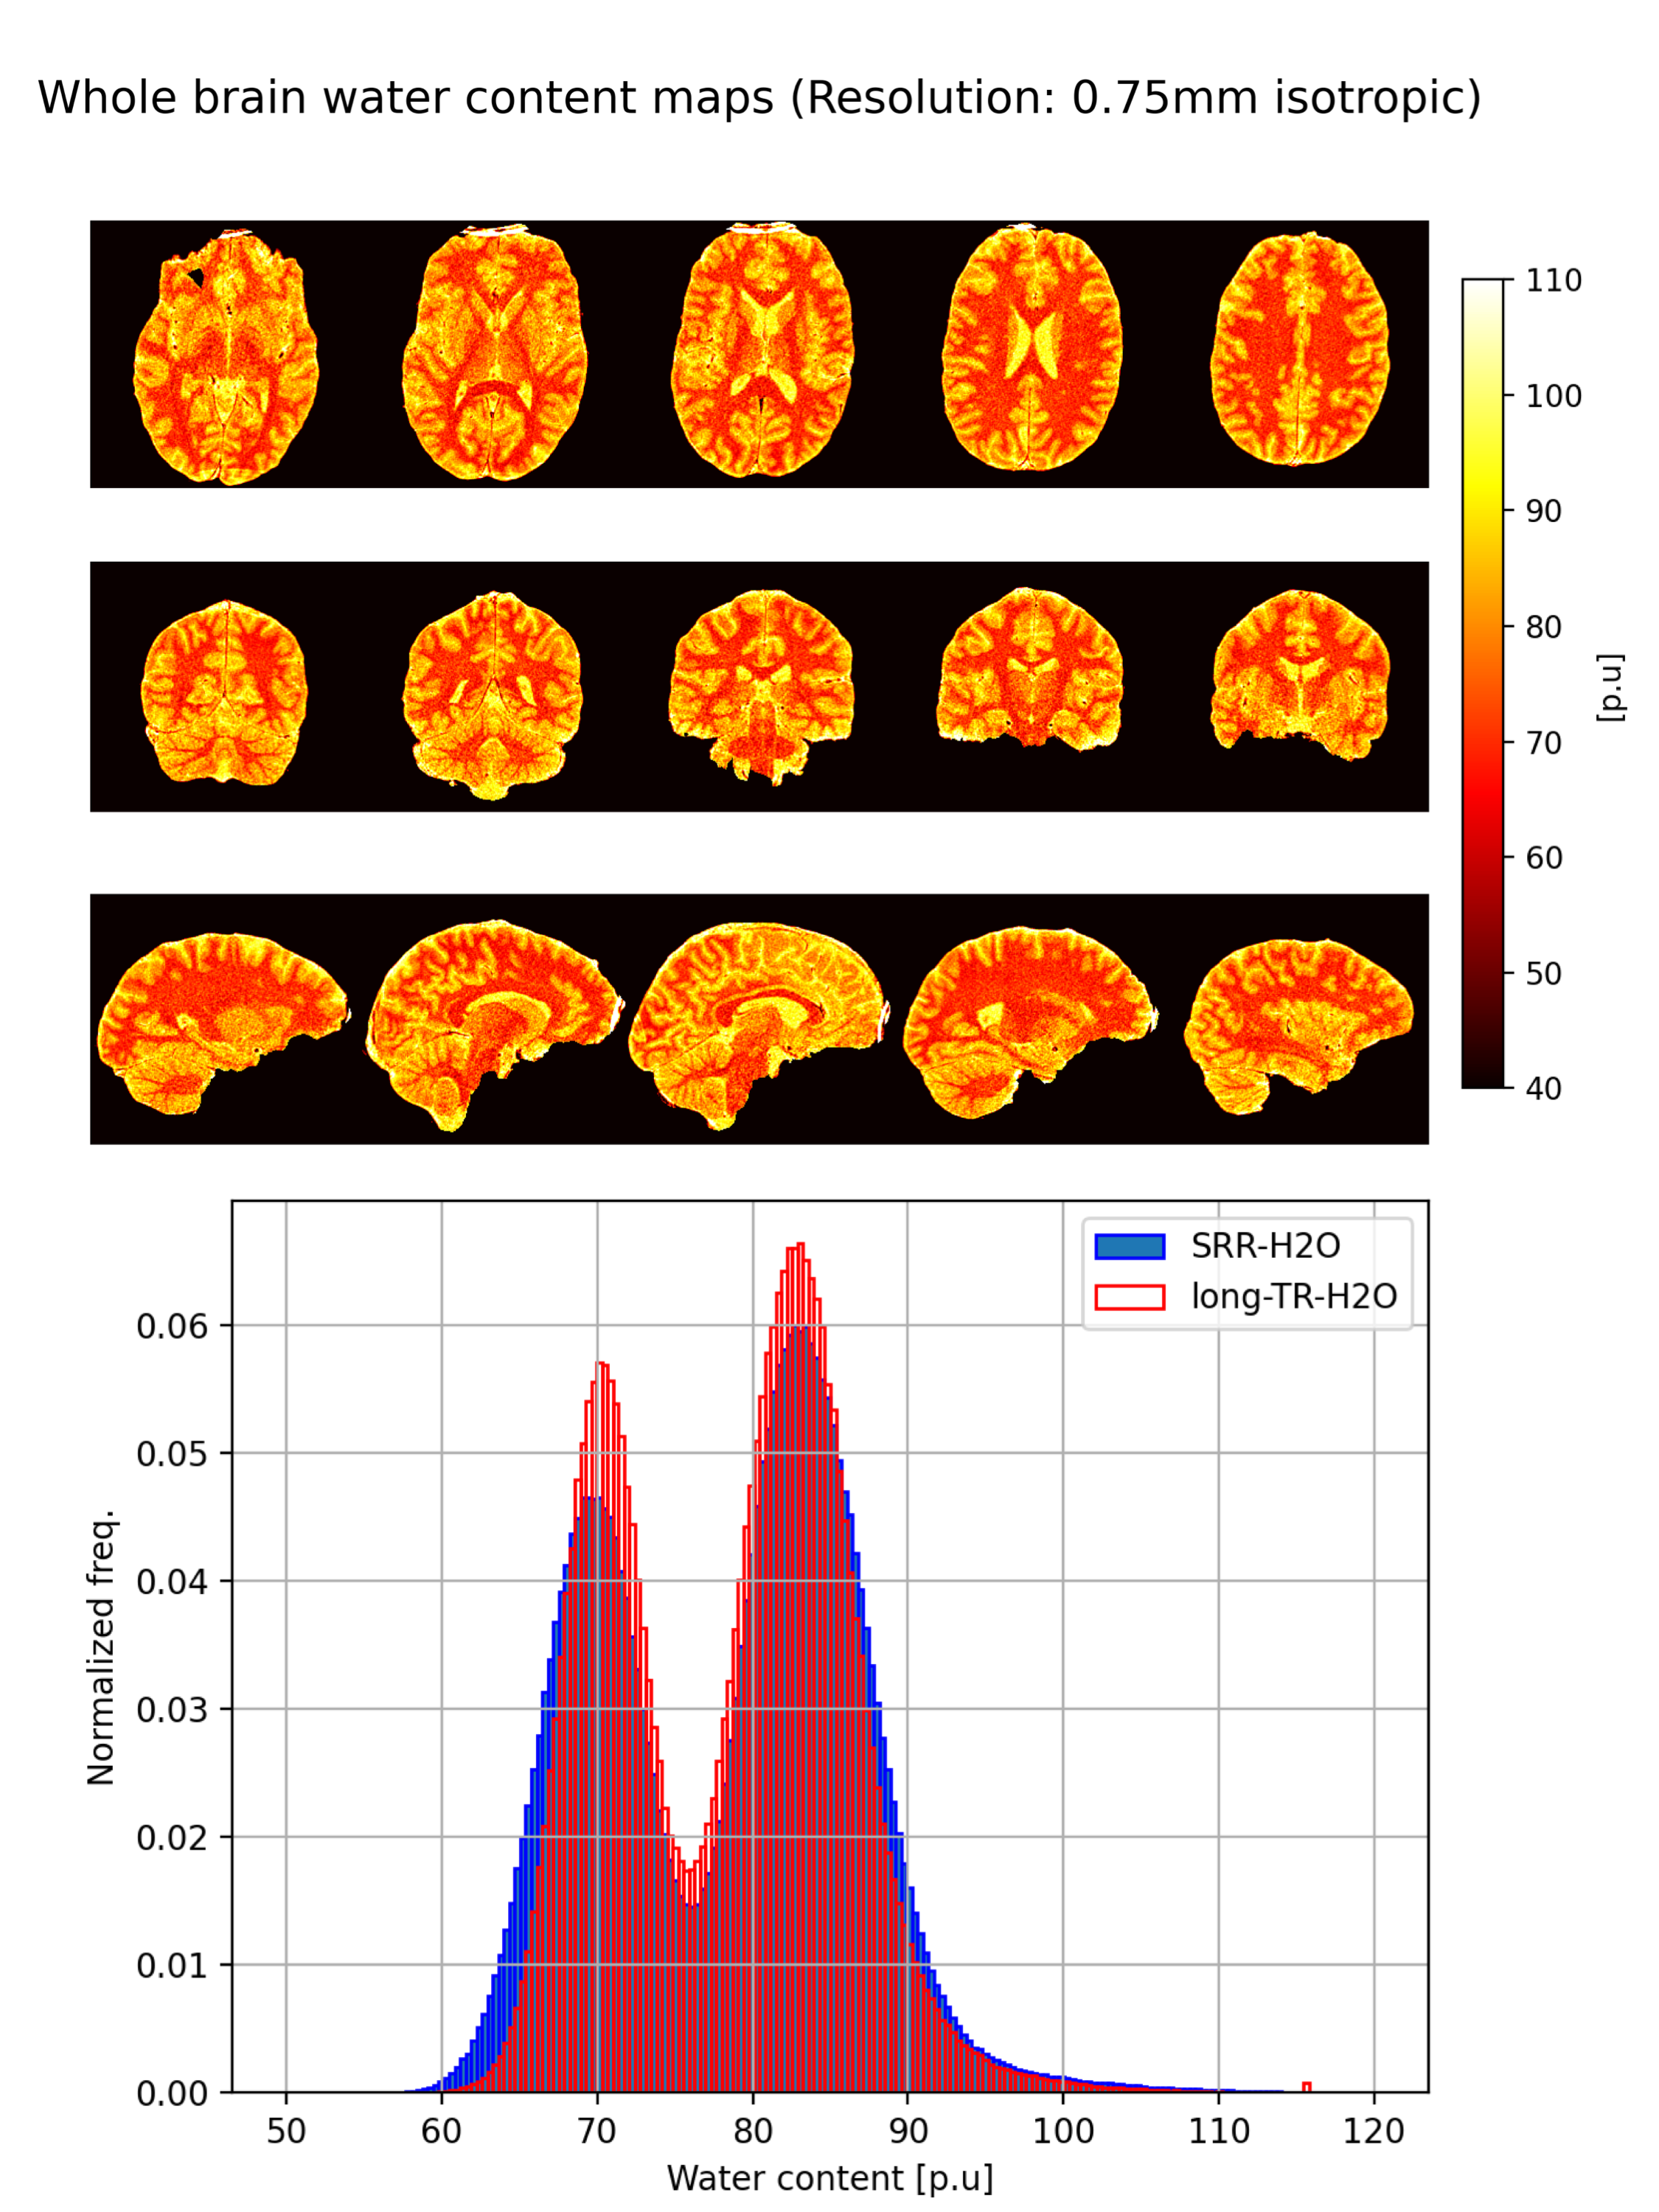
Figure 2 shows the H2O map of the carrageenan phantom obtained from the proposed SRR-H2O method. The H2O values for a selected ROI are compared between the SRR and long-TR method by evaluating their histogram distributions. Figure 3 shows the improvement in resolution obtained with the proposed method compared to the interpolation-H2O map. It is evident that the SRR-H2O method results in a better resolution compared to the interpolation method. This is further confirmed quantitatively with edge width analysis, as shown in table 1. Figure 4 demonstrates the whole-brain H2O map obtained with SRR-H2O for a healthy volunteer. The total acquisition time for the SRR-H2O method was TA=17:36 min (5:52 min per LR acquisition) and for the long-TR method was TA=18 min. The H2O histograms of both methods show the usual bimodal distribution of WM and GM values, with the proposed method showing mean±std, WM: 69.73±3.42p.u, GM: 84.23±4.72p.u. and the long-TR method showing mean±std, WM: 70.73±3.12p.u, GM: 83.52±4.52p.u.Discussion and Conclusion
The differences seen in the mean values of the H2O distributions from the phantom are likely due to the effect of rising temperature (from ~8C to room temperature during the 30 min of measurement time) on the T1 of the internal water standard. Although the saturation correction factor depends on T1, a constant T1 of 3000ms was assumed for the internal water standard. The broader distribution of values for the SRR-H2O is due to the smaller voxel volume (half the volume of long-TR-H2O) of the reconstructed data as well as to the 2.5 times lower SNR of the original LR images acquired with a low flip angle. The in vivo SRR-H2O values correspond well with the literature values and with the values obtained using the LongTR method. The acquisition time of the reference method was 18 min, yielding a H2O map of resolution $$$0.75mm×0.75mm×1.5mm$$$. In contrast, the acquisition time of the proposed SRR method was 17:36 min, yielding $$$0.75mm$$$ isotropic H2O maps. In summary, a technique for obtaining high-resolution, whole-brain water content maps with isotropic voxel size using SRR has been developed and validated. It is anticipated that this proof of concept will be of particular interest at higher field strengths, where the resolution can be further improved by using the increased SNR, or in animal imaging, where extremely high resolution is required for anatomical characterisation.Acknowledgements
This work was supported by the European Union’s Horizon 2020 research and innovation programme under the Marie Sklodowska-Curie grant agreement No. 764513. We would like to thank Fabian Küppers and Michael Schöneck for helping with the phantom preparation and Zaheer Abbas and Markus Zimmermann for fruitful discussions. We would also like to thank Claire Rick for proof reading the abstract.
References
1. Christiansen, P. et al. MR-visible water content in human brain: A proton MRS study. Magn. Reson. Imaging 12, 1237–1244 (1994).
2. Tofts, Paul S. Quantitative MRI of the brain: measuring changes caused by disease. (Wiley, 2003).
3. Neeb, H., Zilles, K. & Shah, N. J. A new method for fast quantitative mapping of absolute water content in vivo. NeuroImage 31, 1156–1168 (2006).
4. Oros-Peusquens, A.-M. et al. A Single-Scan, Rapid Whole-Brain Protocol for Quantitative Water Content Mapping With Neurobiological Implications. Front. Neurol. 10, 1333 (2019).
5. Abbas, Z. et al. Analysis of proton-density bias corrections based on T 1 measurement for robust quantification of water content in the brain at 3 Tesla: Quantitative Water Content Mapping at 3T. Magn. Reson. Med. 72, 1735–1745 (2014).
6. Volz, S. et al. Quantitative proton density mapping: correcting the receiver sensitivity bias via pseudo proton densities. NeuroImage 63, 540–552 (2012).
7. Abbas Z, Gras V, Möllenhoff K, Oros-Peusquens AM, Shah NJ. Quantitative water content mapping at clinically relevant field strengths: a comparative study at 1.5 T and 3 T. Neuroimage 106, 404-413 (2015)
8. Volz, S., Nöth, U. and Deichmann, R. Correction of systematic errors in quantitative proton density mapping. Magn. Reson. Med., 68: 74-85, (2012)
9. Shah, N. J. et al. Quantitative cerebral water content mapping in hepatic encephalopathy. NeuroImage 41, 706–717 (2008).
10. Schall, M. et al. A 3D two-point method for whole-brain water content and relaxation time mapping: Comparison with gold standard methods. PLOS ONE 13, e0201013 (2018).
11. Greenspan, H. Super-Resolution in Medical Imaging. Comput. J. 52, 43–63 (2008).
12. Poot, D. H. J., Van Meir, V. & Sijbers, J. General and Efficient Super-Resolution Method for Multi-slice MRI. in Medical Image Computing and Computer-Assisted Intervention – MICCAI 2010 (eds. Jiang, T., Navab, N., Pluim, J. P. W. & Viergever, M. A.) 615–622 (Springer Berlin Heidelberg, 2010).
13. Yoshimura, K. et al. Development of a tissue-equivalent MRI phantom using carrageenan gel. Magn. Reson. Med. 50, 1011–1017 (2003).
14. Stöcker, T. & Shah, N. J. MP-SAGE: A new MP-RAGE sequence with enhanced SNR and CNR for brain imaging utilizing square-spiral phase encoding and variable flip angles. Magn. Reson. Med. 56, 824–834 (2006).
15. Greenspan, H., Oz, G., Kiryati, N. & Peled, S. MRI inter-slice reconstruction using super-resolution. Magn. Reson. Imaging 10 (2002).
Figures