2390
Optimisation of multi-compartment relaxometry myelin water imaging (MCR-MWI)1Donders Institute for Brain, Cognition and Behaviour, Radboud University, Nijmegen, Netherlands
Synopsis
In this study, we optimise the variable flip angle acquisition protocol for GRE-based myelin water imaging using MCR model. We show numerically and via in vivo imaging that MCR-MWI can be performed with as few as 3 flip angles and still be able to achieve similar measurement performance as with 7 flip angles. We also conduct an analysis to investigate the usefulness of an image denoising method to improve MWI. Preliminary results suggest that MCR-MWI is very robust to noise and higher resolution data is needed to have a better insight.
Introduction
Myelin water imaging (MWI) using multi-echo gradient echo (mGRE) sequence to probe myelin in white matter (WM) is getting more attention because of its simple implementation and high scan time efficiency1-4. MGRE MWI requires fitting the signal decay with a 3-pool model which is a poorly-conditioned problem5. Recently, it was demonstrated that a variable flip angle (VFA) mGRE acquisition scheme combined with multi-compartment relaxometry (MCR-MWI) provided a more robust MWI measurement and insured convergence of the fitting process6. In the initial MCR-MWI implementation, the VFA scheme included 7 flip angles to ensure a variety of T1-weighting was introduced, which inevitably lengthened the scan time. In this study, we set out to investigate (1) if the acquisition time can be shortened by reducing the number of flip angles without affecting the robustness of MCR-MWI, and (2) if we can incorporate image denoising methods to further improve MWF estimation.Methods
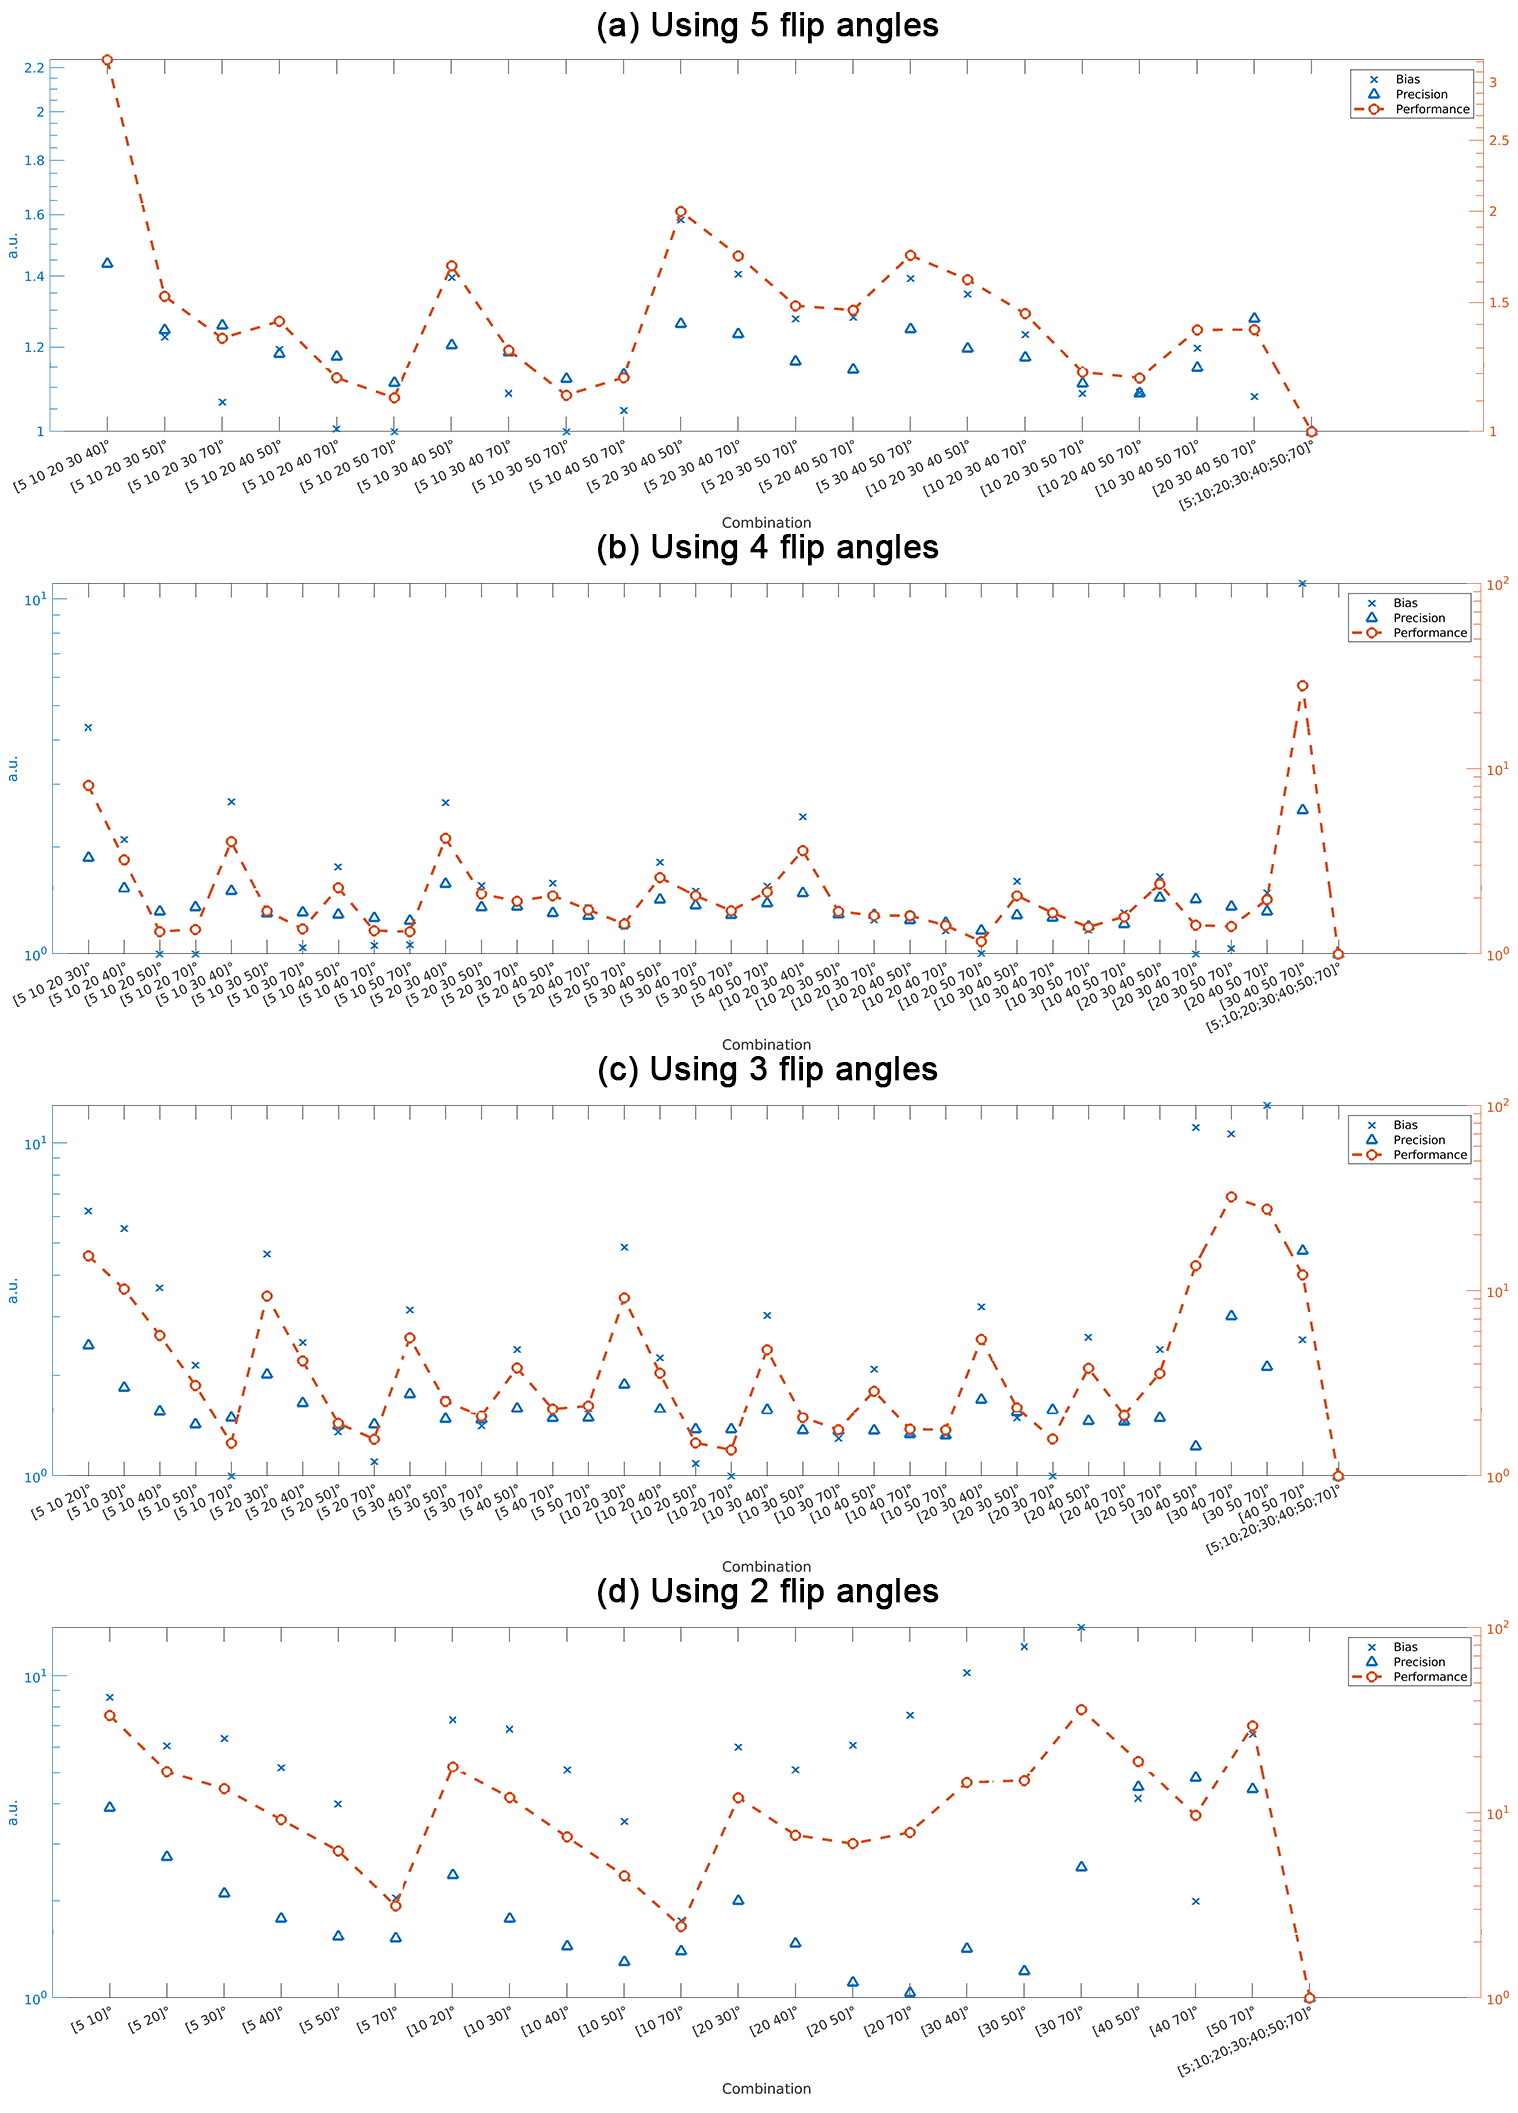
Numerical SimulationMonte Carlo simulations were conducted to study the effect of reducing the number of flip angles on MCR-MWI robustness. A 3-pool WM signal was simulated using MCR6 and hollow cylinder models7 using the same parameters as shown in 6 Simulation #4 of Table 1. Gaussian noise was added to the signal to simulate moderate SNR for each flip angle (SNRTE0=57 when α=20°, same noise level for all data). Data fitting was performed using all 7 flip angles and all subsets among the 7 flip angles, from data comprised only 5 to 2 flip angles. The process was repeated 4000 times such that statistical analysis can be performed.
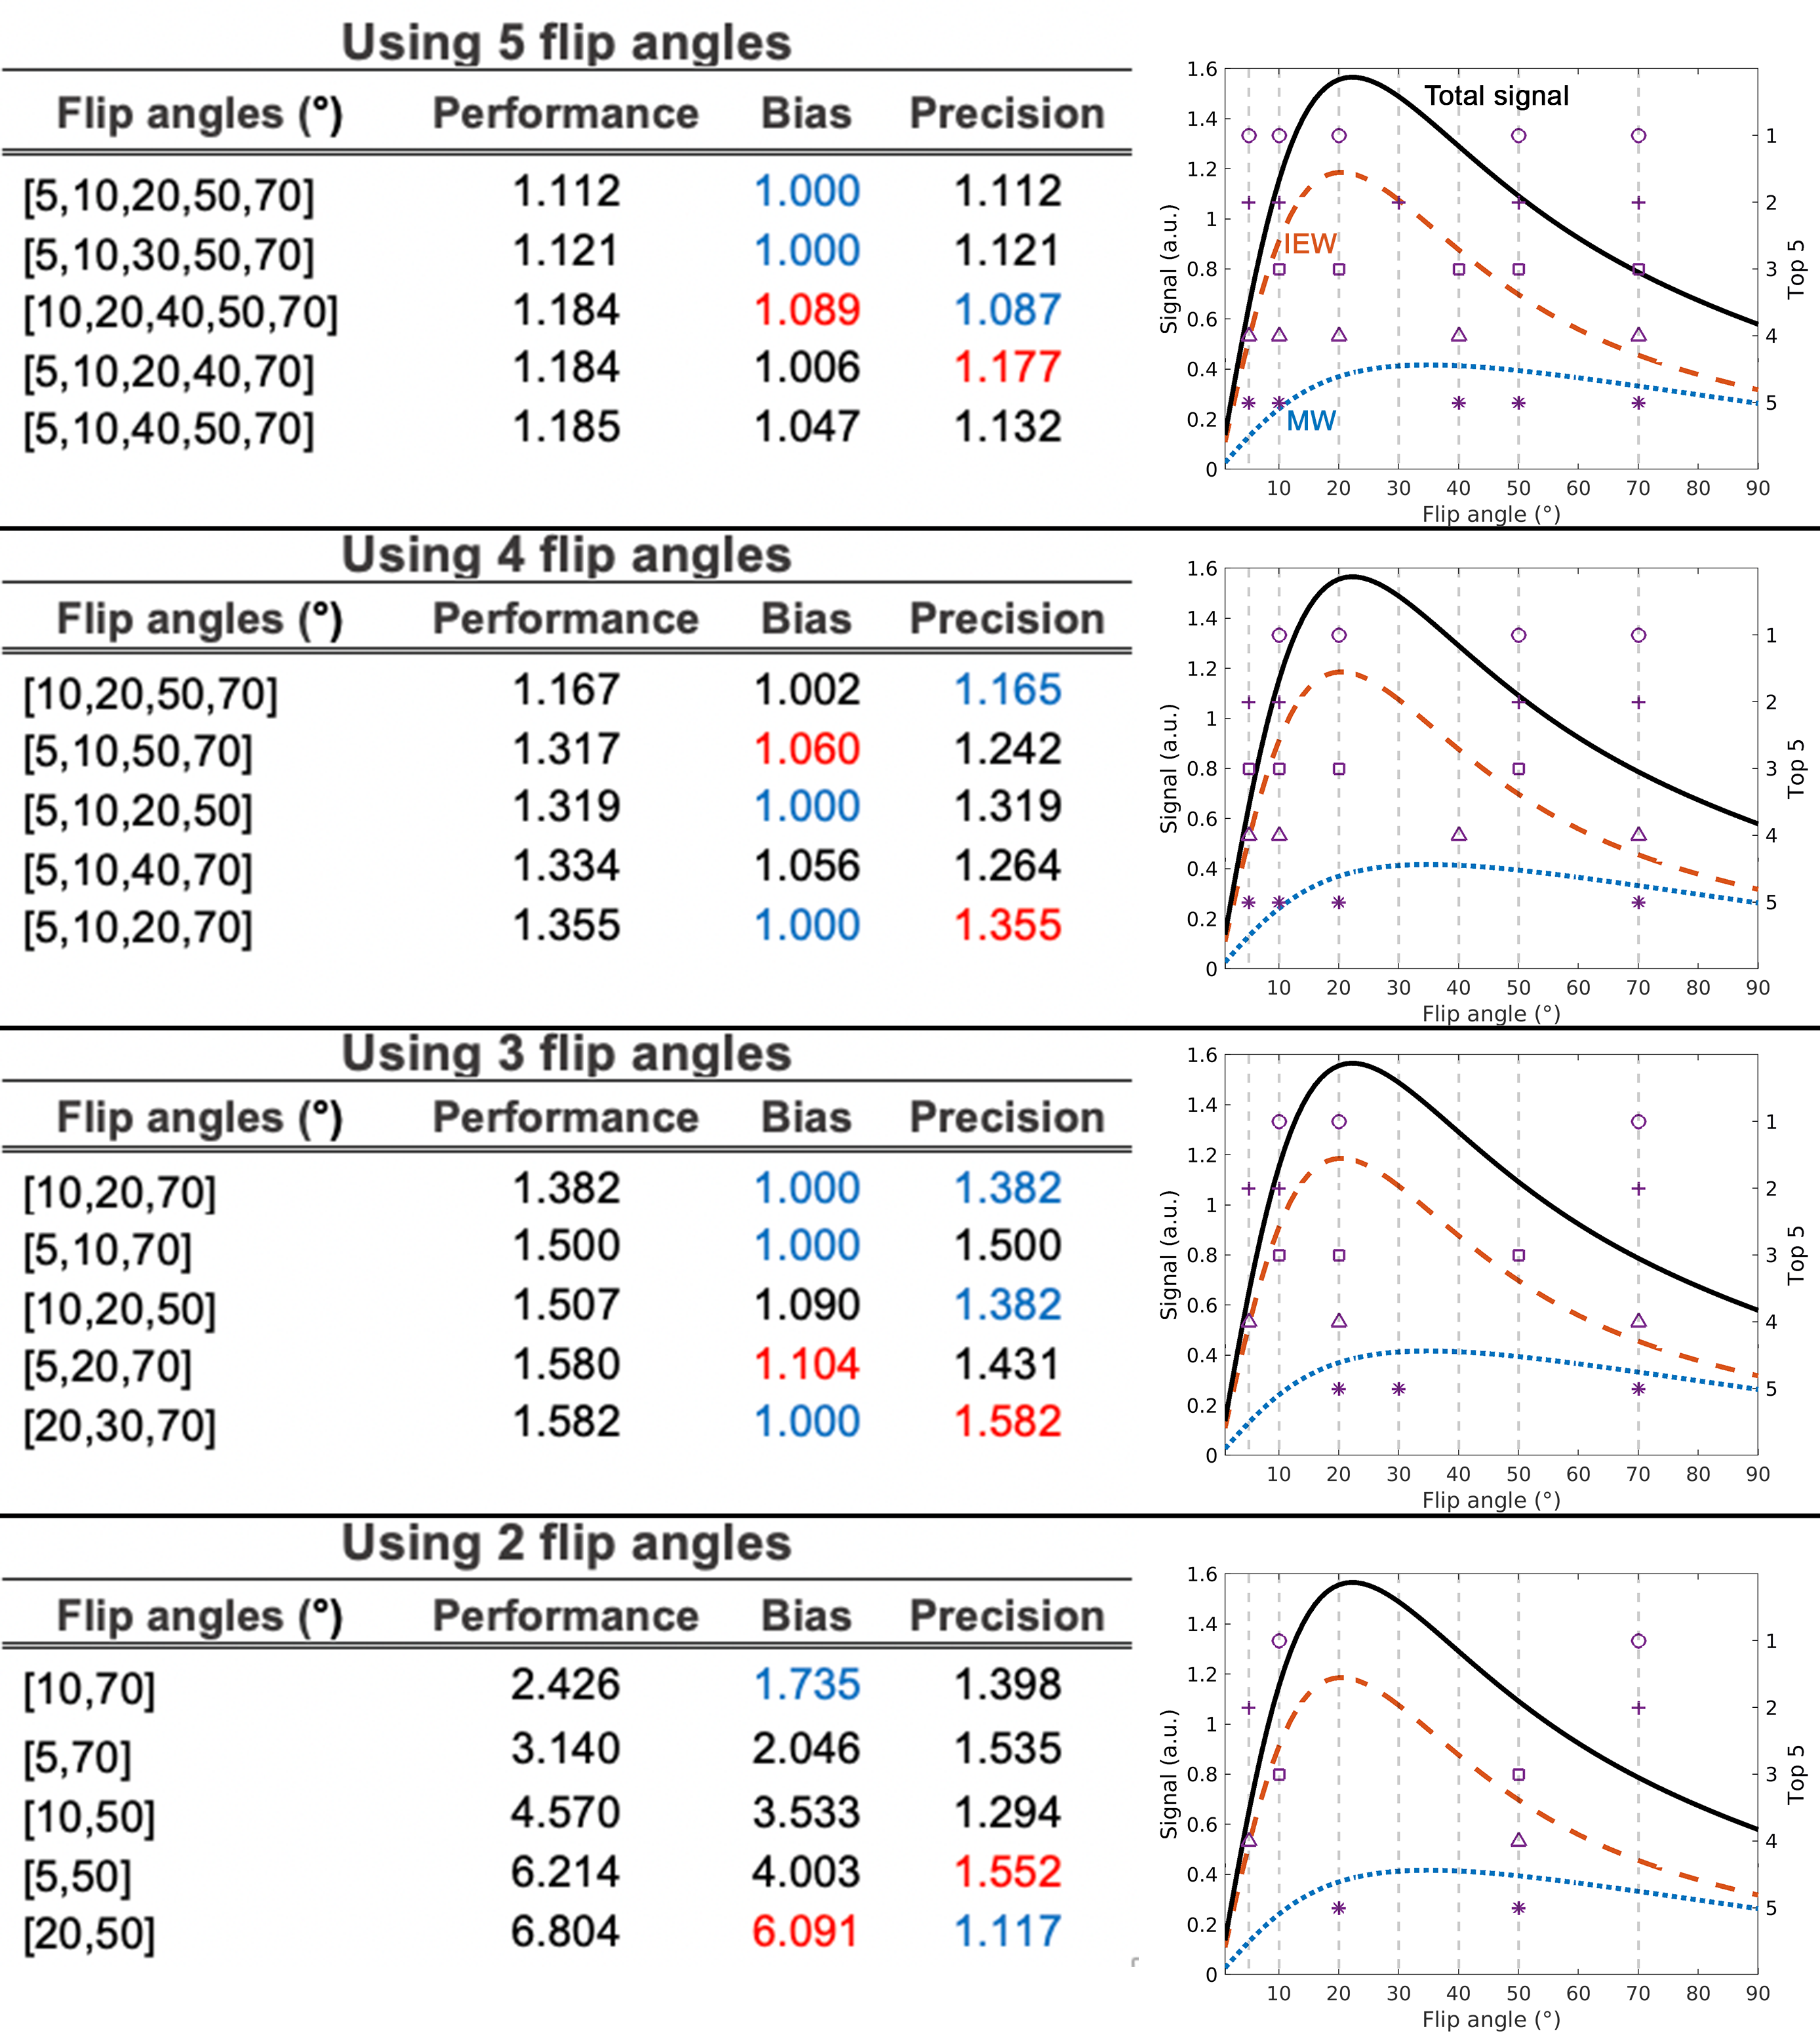
Simulated measurement accuracy and precision were accessed by examining the bias and standard deviation (SD) of the MWF fitting, normalised by the values from using 7 flip angles:
$$bias=\frac{|\overline{MWF_{2,3,4,5FA}}-MWF_{ground truth}|}{|\overline{MWF_{7FA}}-MWF_{ground truth}|} [Eq.1]$$
$$precision=\frac{SD(MWF_{2,3,4,5FA})}{SD(MWF_{7FA})|} [Eq.2]$$
where $$$MWF_{ground truth}$$$ is the MWF in simulated signal, $$$MWF_{2,3,4,5FA}$$$ is the fitted MWF with different flip angle subsets and $$$MWF_{7FA}$$$ is the fitted MWF using all 7 flip angles. Since it is unlikely the bias and precision of a subset can outperform full dataset, values derived from Eqs.1&2 were thresholded to 1 if they were lower than 1. A performance metric was derived to determine the optimum subset of flip angle combination that can produce a similar performance as using full dataset:
$$performance = bias \times precesion [Eq.3]$$
In vivo imaging
VFA mGRE data acquired at 3T (Siemens, Erlangen) for the previous MCR-MWI study were processed retrospectively6. In short, 8 healthy subjects were scanned with a monopolar 3D mGRE, TR/TE1/ΔTE/TE12=46/2.15/3.05/35.7ms, res=1.8mm iso., α=[5,10,20,30,40,50,70]°, GRAPPA=2 and TA=3.5mins. Additionally, higher resolution mGRE data was acquired from 2 of the 8 subjects: monopolar 3D mGRE, TR/TE1/ΔTE/TE12=46/2.15/3.03/35.48ms, GRAPPA=3, res=1.4mm iso., α=[5,10,20,30,40,50,70]° and TA=4.5mins. Tissue classification mask was obtained from MP2RAGE data as previous described6.
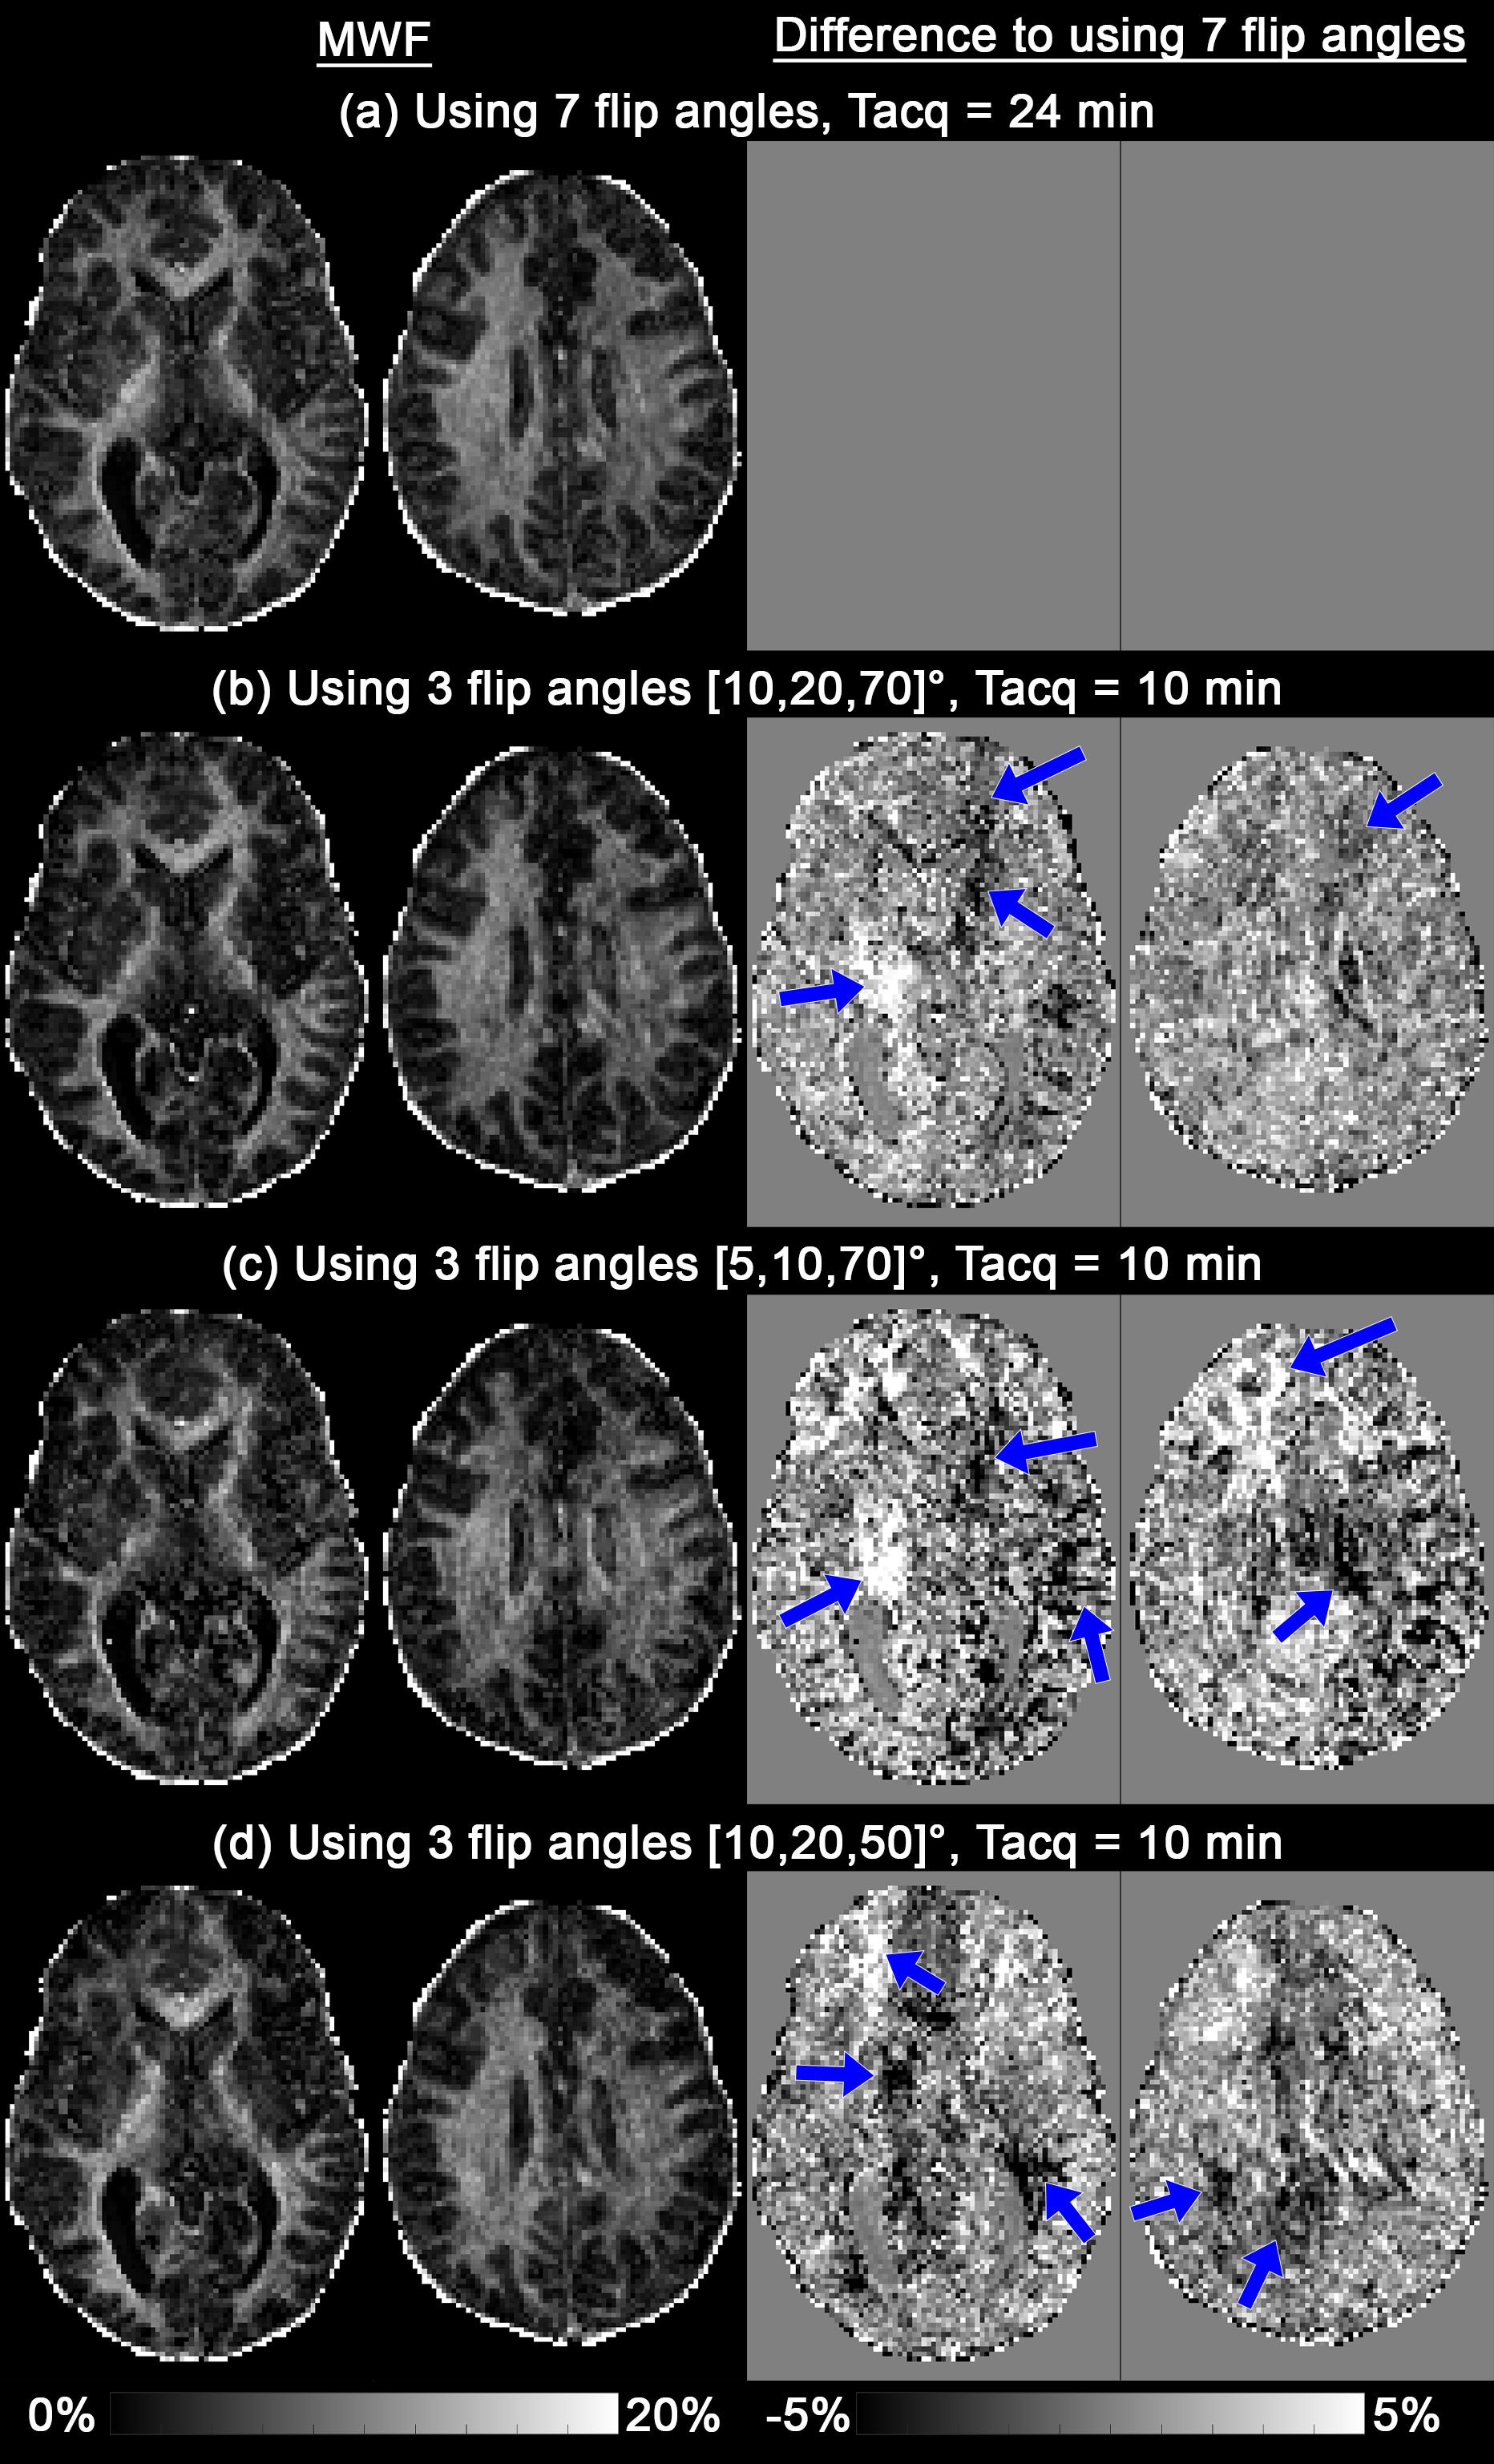
MCR-MWI fitting was performed using data from the optimal flip angle set determined from the simulations, corresponding to the optimum solutions of α=[10,20,70]°, [5,10,70]° and [10,20,50]°.
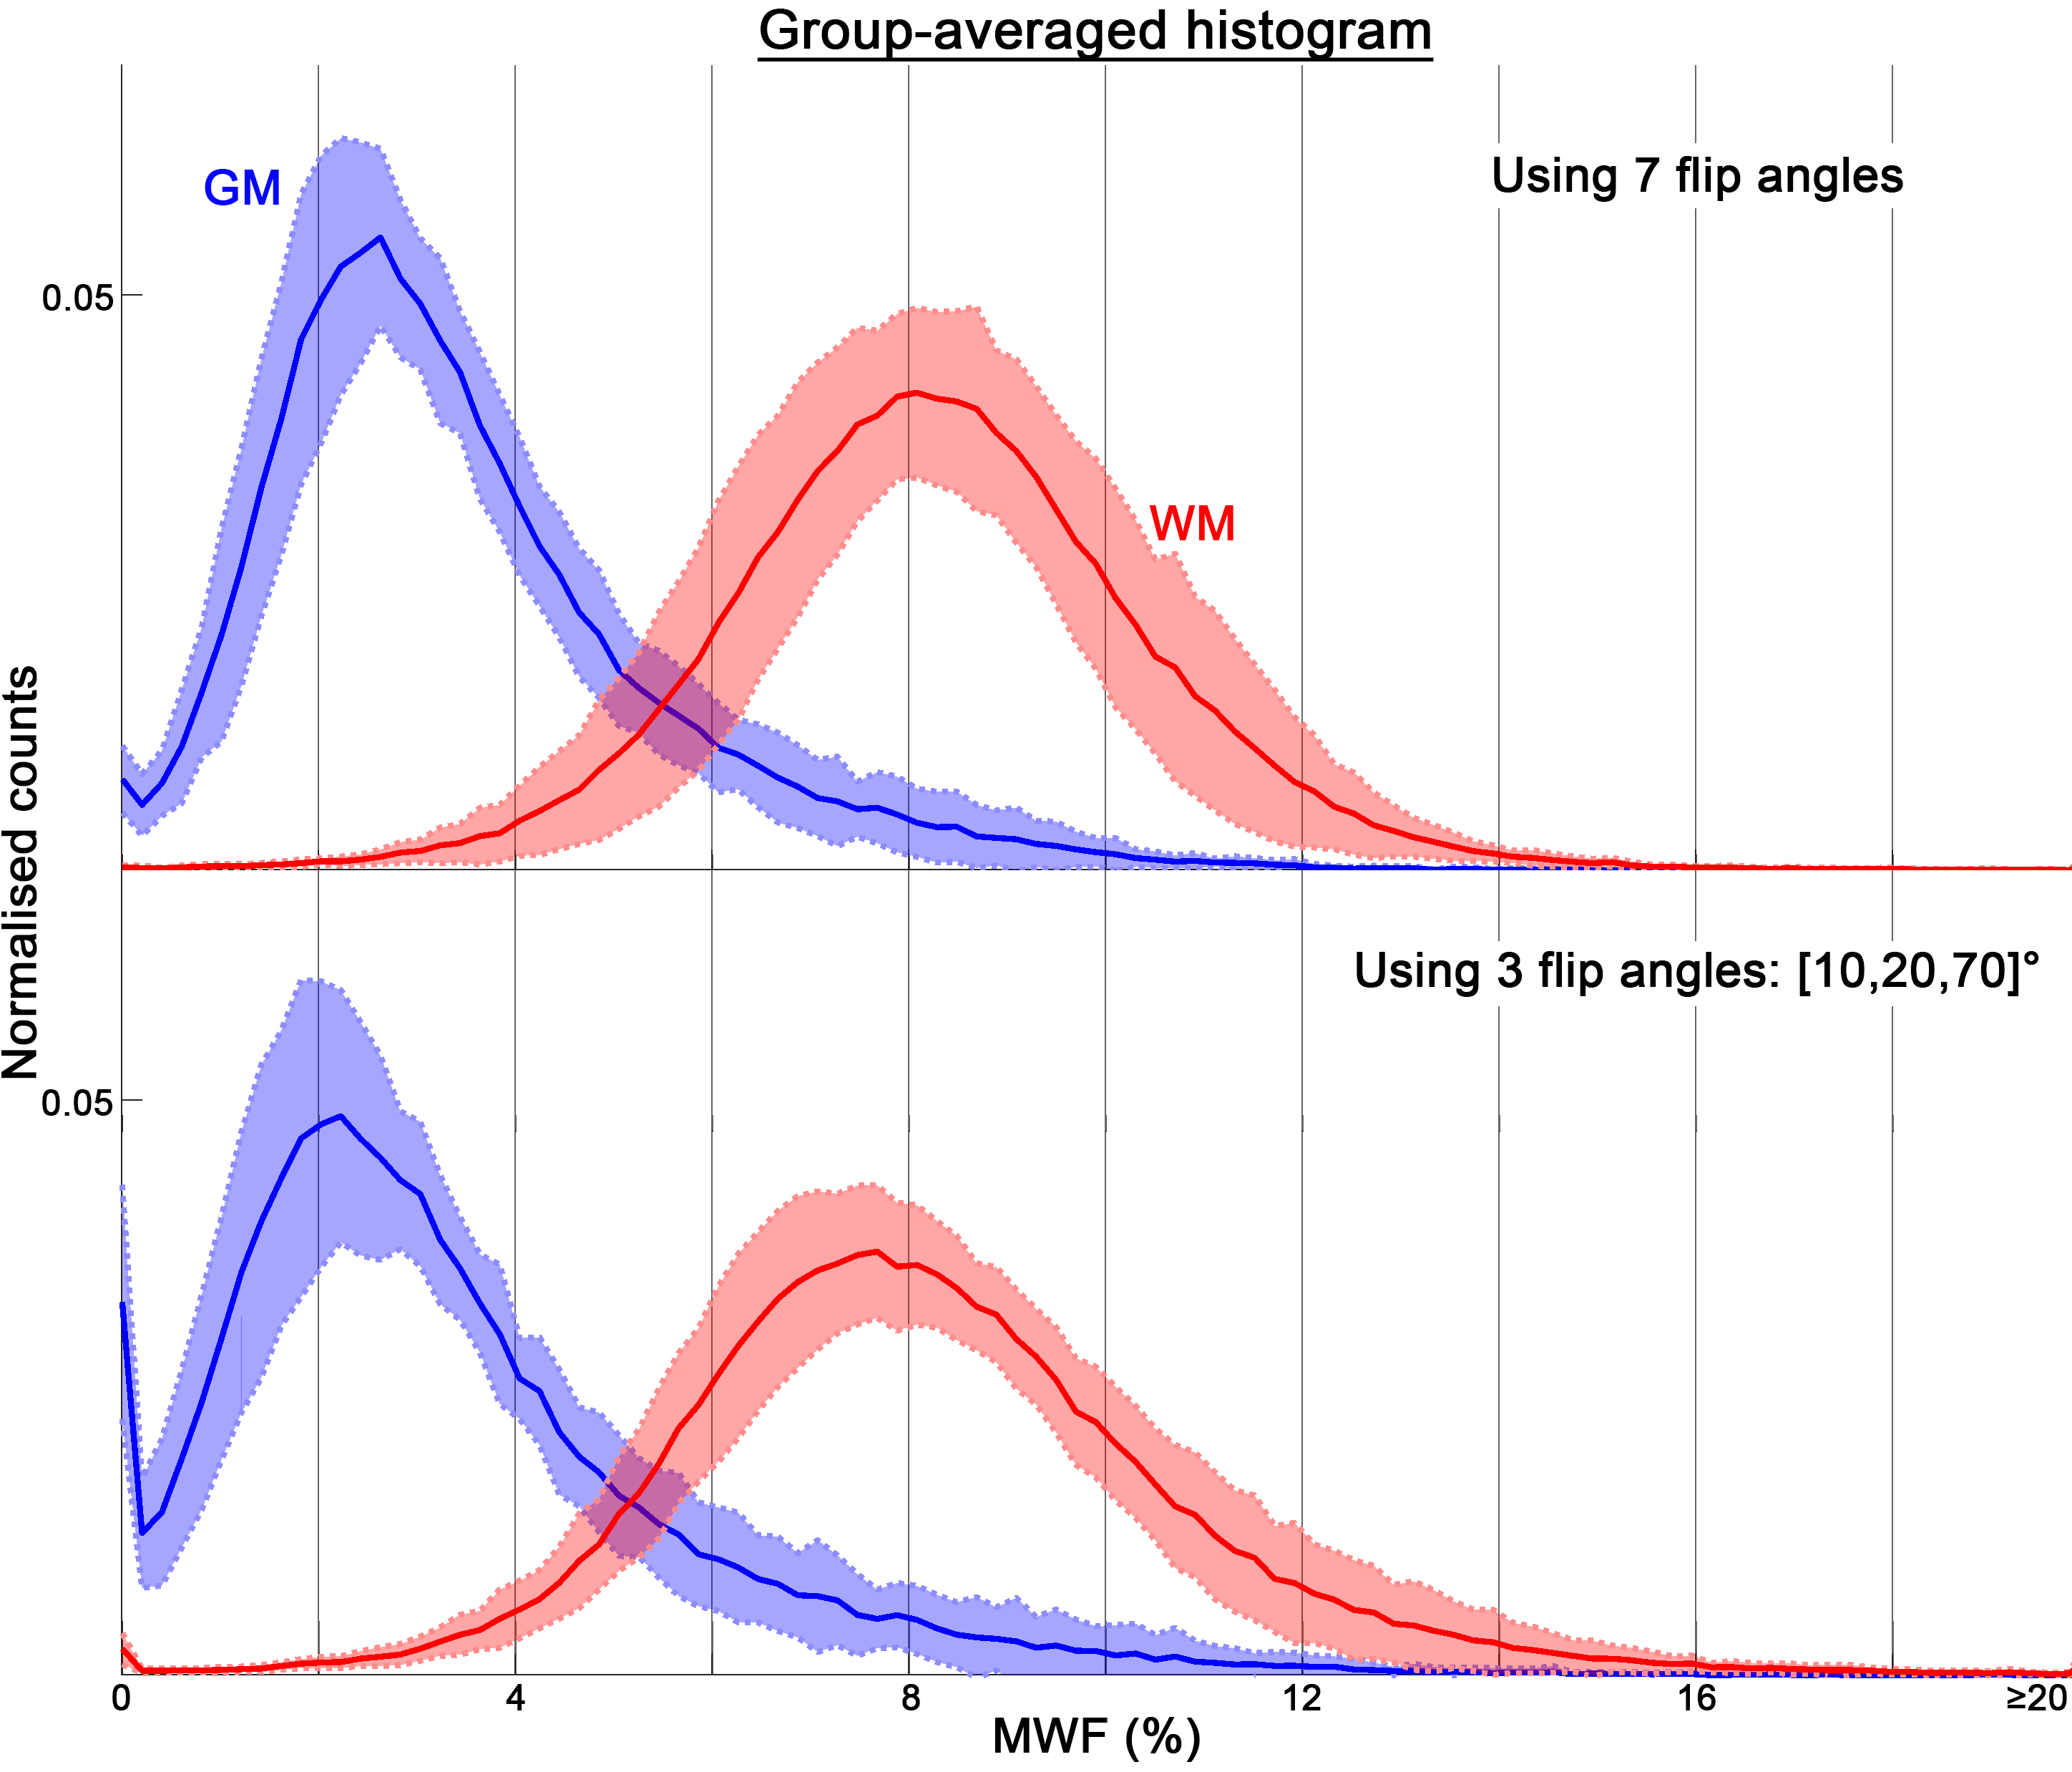
Group histogram analysis was performed on the MWF estimated using the 1.8mm isotropic GRE data across all subjects.
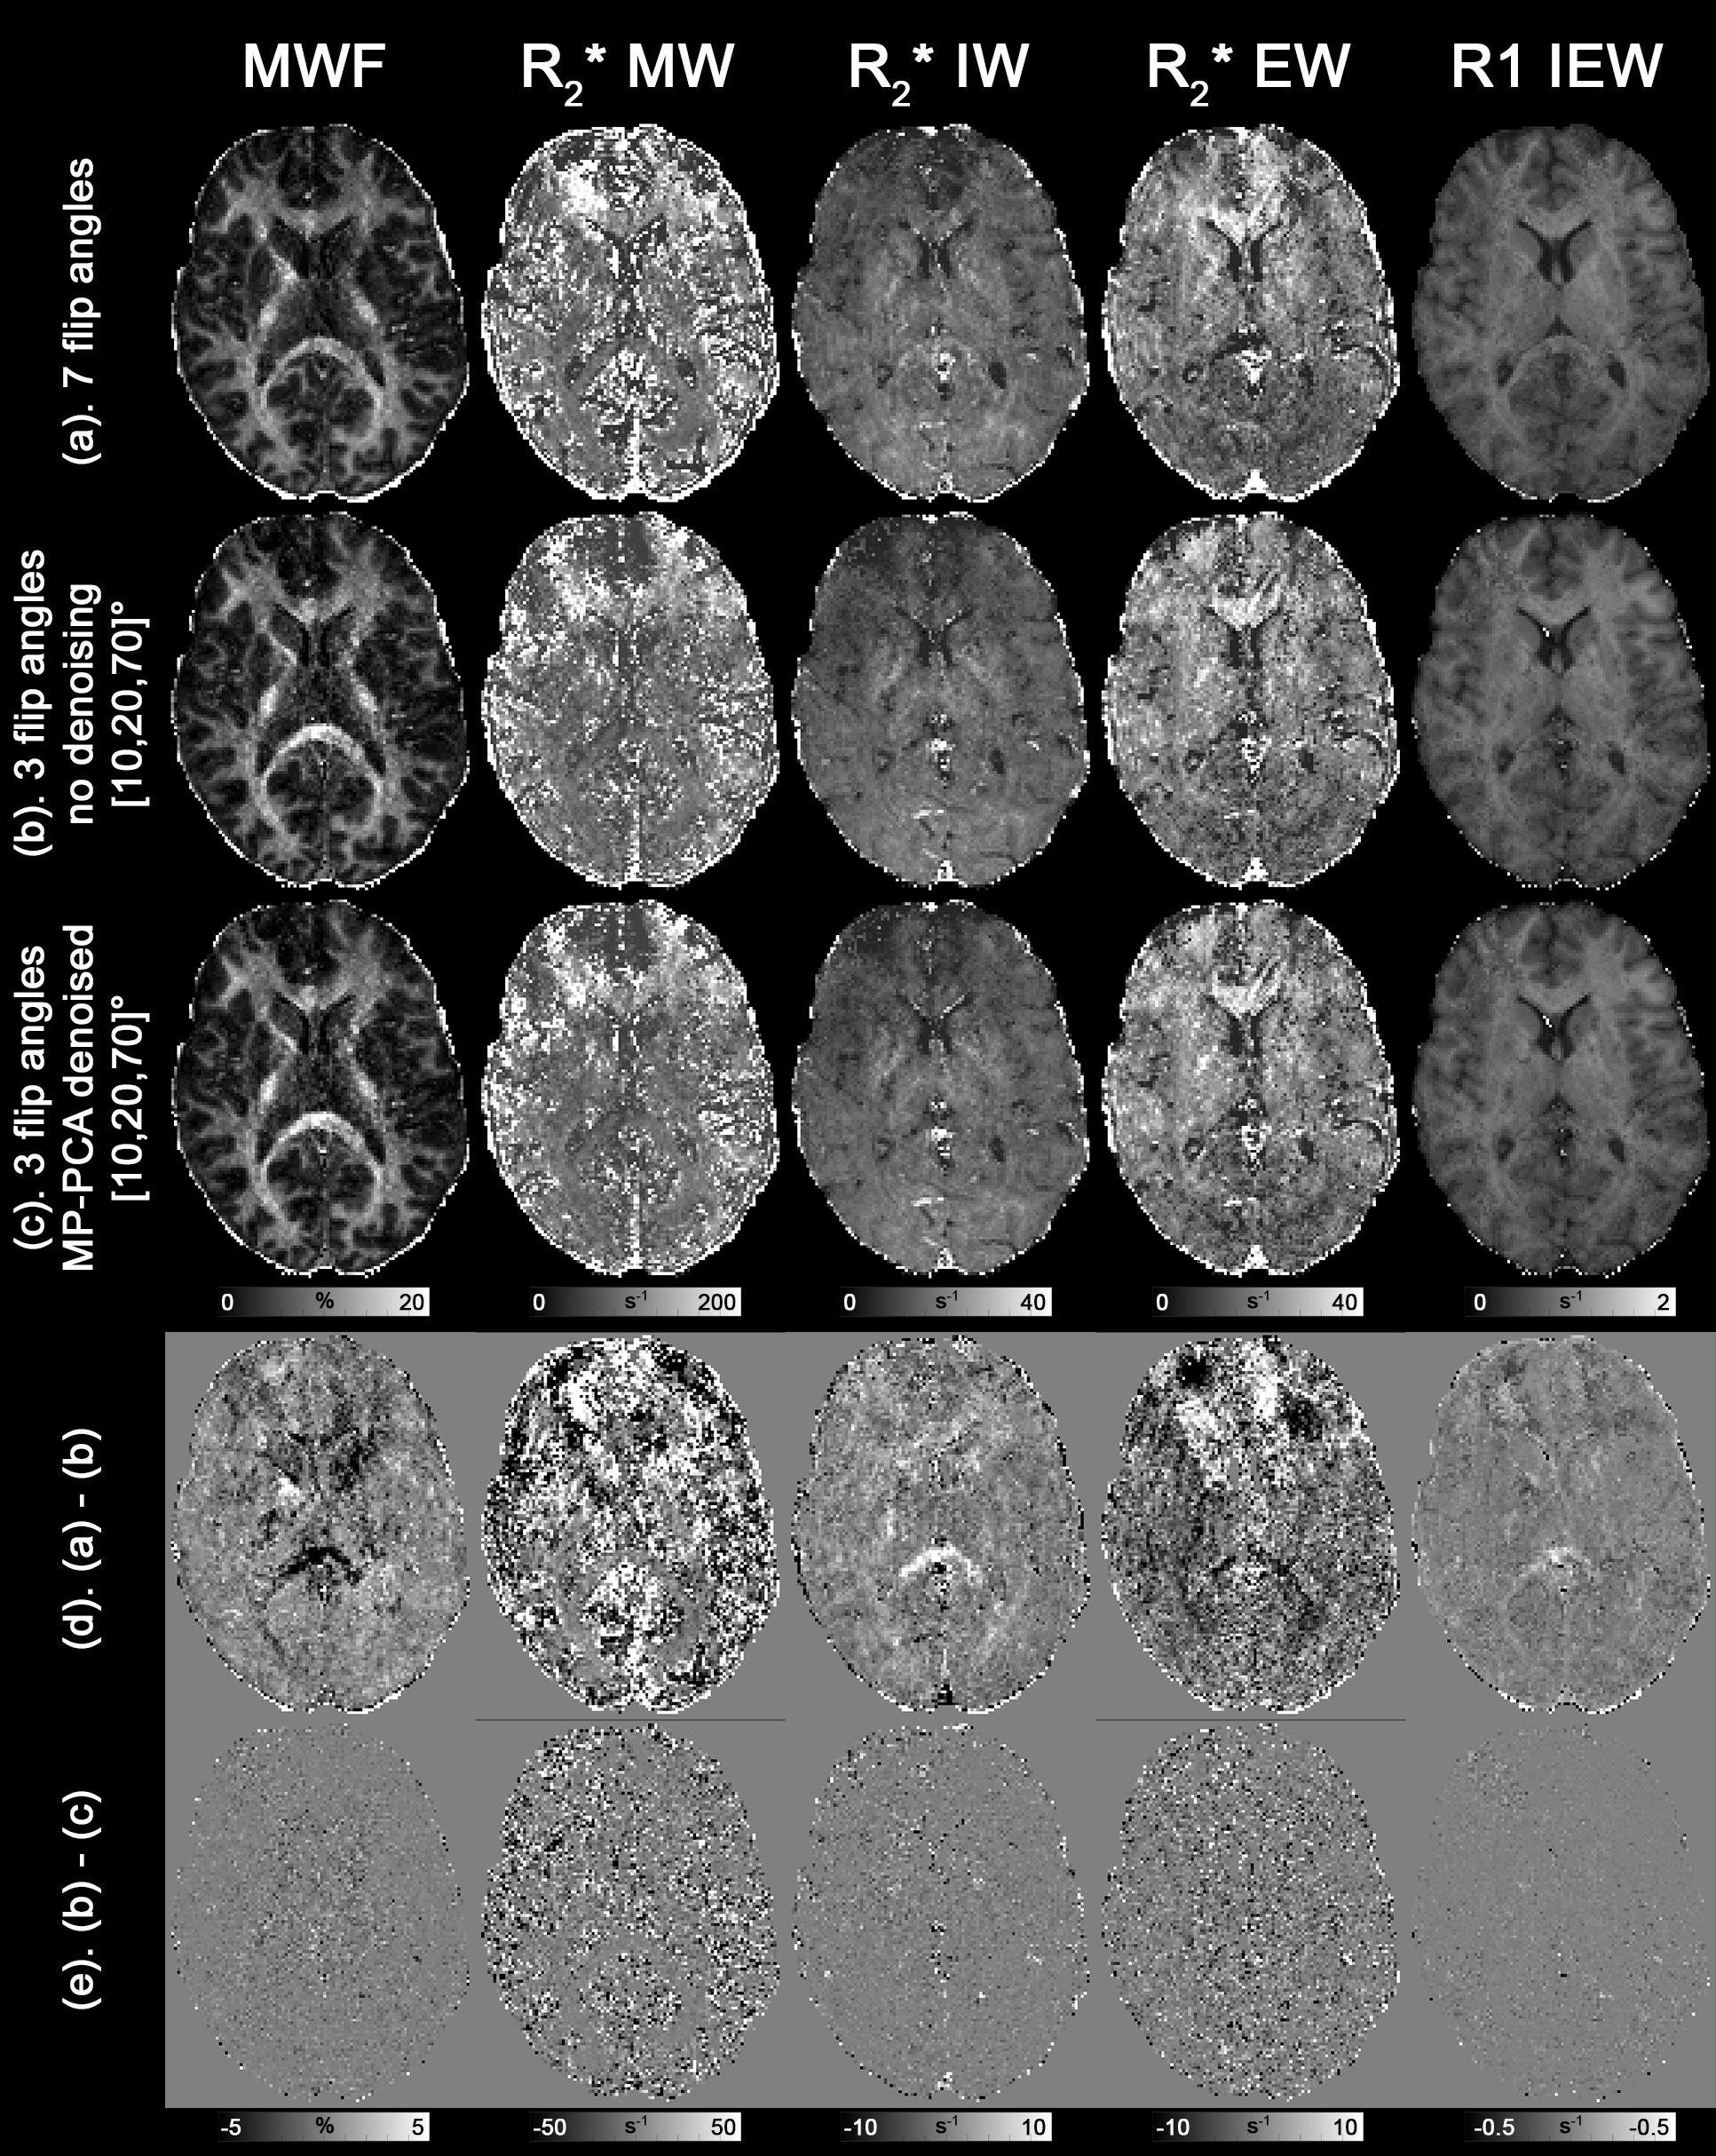
Additionally, the high-resolution GRE data were processed with MP-PCA8 with a 5x5x5 kernel size applied independently to each flip angle prior data fitting. MCR-MWI was applied on both denoised and original data to observe the impact on MWF reconstruction.
Results and Discussion
Numerical simulationSimilar accuracy compared to using 7 flip angles can be achieved with as fewer as using only 3 flip angles, whereas significant bias is observed when using 2 flip angles (Figs1&2). The optimum precision progressively decreased with data reduction (~1.4SD of 7 flip angles when 3 flip angles were used). From a simplistic data average perspective, the SD would be expected to increase by 1.5 for the 3-flip-angle scenario, suggesting an increased efficiency of this protocol.
In vivo imaging
Fig.3 shows the 1.8mm isotropic MWF maps. The MWF maps derived from full dataset (Fig.3a) and the top three subsets of 3 flip angles (Fig.3b-d) share similar contrast, with patch-like differences can be found across the brain (blue arrows), which are likely to due to image artefacts related to movement between acquisitions. Group-averaged MWF histograms of both global WM and grey matter (GM) from the 3-flip-angle dataset are slightly shifted to the left when compared to those of full dataset (Fig.4), potentially caused by the artefact related bias shown in Fig.2 or unbalanced MT9. Both tissues have a broader spectrum when using the 3-flip-angle dataset, as predicted by the simulations.
High-resolution MCR-MWI results derived from 3 flip angles (Fig.5b) are noticeably noisier than the full dataset counterpart (Fig.5a,c), apart from the similar bias in frontal WM shown in Fig.2. Incorporating MP-PCA denoising does not provide any significant improvement to the results of using 3 flip angles (Fig.5c,e).
Conclusions
MCR-MWI is possible with at least 3 flip angles without significantly degrading the performance, allowing acquisition time to be reduced to ~40% in the original implementation.MCR-MWI using 3 flip angles with MP-PCA denoising did not show significant improvements, yet this could be due to the robustness of MCR-MWI to noise. Higher-resolution data or higher accelerated data will be acquired in the future to fully investigate the potential of denoising methods in more demanding SNR conditions.
Acknowledgements
This work is part of the research programme with project number FOM-N-31/16PR1056/RadboudUniversity, which is financed by the Netherlands Organisation for Scientific Research (NWO).References
1. Gelderen, P. van et al. Nonexponential T2* decay in white matter. Magnetic resonance in medicine 67, 110–117 (2011).
2. Nam, Y., Lee, J., Hwang, D. & Kim, D.-H. Improved estimation of myelin water fraction using complex model fitting. Neuroimage 116, 214–221 (2015).
3. Shin, H.-G. et al. Advances in gradient echo myelin water imaging at 3T and 7T. Neuroimage 188, 835–844 (2018).
4. Alonso-Ortiz, E., Levesque, I. R. & Pike, G. B. Impact of magnetic susceptibility anisotropy at 3 T and 7 T on T2*-based myelin water fraction imaging. Neuroimage 182, 370–378 (2018).
5. Lee, J. et al. So You Want to Image Myelin Using MRI: An Overview and Practical Guide for Myelin Water Imaging. J Magnetic Reson Imaging Jmri (2020) doi:10.1002/jmri.27059.
6. Chan, K.-S. & Marques, J. P. Multi-compartment relaxometry and diffusion informed myelin water imaging – promises and challenges of new gradient echo myelin water imaging methods. Neuroimage 221, 117159 (2020).
7. Wharton, S. & Bowtell, R. Gradient echo based fiber orientation mapping using R2* and frequency difference measurements. Neuroimage 83, 1011–1023 (2013).
8. Does, M. D. et al. Evaluation of principal component analysis image denoising on multi-exponential MRI relaxometry. Magnetic resonance in medicine 81, mrm.27658-3514 (2019).
9. Teixeira, R. P. A. G., Malik, S. J. & Hajnal, J. V. Fast quantitative MRI using controlled saturation magnetization transfer. Magnetic resonance in medicine 81, 907–920 (2019).
Figures