2389
Biochemical Composition of the Cerebrospinal Fluid: Probing by MRI
Khin Khin Tha1,2, Yuta Urushibata3, Hiroyuki Hamaguchi2, and Hideki Hyodoh4
1Global Center for Biomedical Science and Engineering, Hokkaido University Faculty School of Medicine, Sapporo, Japan, 2Department of Biomarker Imaging Science, Hokkaido University Graduate School of Biomedical Science and Engineering, Sapporo, Japan, 3Siemens Healthcare K.K., Tokyo, Japan, 4Department of Forensic Medicine, Hokkaido University Faculty of Medicine, Sapporo, Japan
1Global Center for Biomedical Science and Engineering, Hokkaido University Faculty School of Medicine, Sapporo, Japan, 2Department of Biomarker Imaging Science, Hokkaido University Graduate School of Biomedical Science and Engineering, Sapporo, Japan, 3Siemens Healthcare K.K., Tokyo, Japan, 4Department of Forensic Medicine, Hokkaido University Faculty of Medicine, Sapporo, Japan
Synopsis
This prospective study aimed to evaluate if CEST MRI can detect the biochemical composition of CSF. Fifty-two cadaveric CSF samples were tested for any correlation between the compounds detected by CEST MRI and the CSF biochemical analysis reports. The normalized area for intermediate exchanging amines showed a moderate positive correlation with protein concentration (r= 0.436, P= 0.001), a weak positive correlation with specific gravity (r=0.369, P=0.007), and a weak negative correlation with pH (r= -0.290, P= 0.037). The normalized area for intermediate exchanging amines may be sensitive to detect a change in CSF proteins.
Introduction
Cerebrospinal fluid (CSF) is a body fluid present in the ventricular and subarachnoid spaces around the brain and spinal cord. It is composed mainly of water, electrolytes, glucose, and a small amount of protein. Its composition is known to alter in a variety of pathologies, including meningitis. For this reason, biochemical analysis of the CSF through a lumbar puncture is often done to diagnose these pathologies. However, lumbar puncture is invasive and can cause serious adverse effects. Noninvasive estimation of the CSF composition is desired. Chemical exchange proton transfer (CEST) MRI can detect protein and glucose compounds by detecting their protons’ exchange with surrounding water molecules1. The higher sensitivity of this technique over the conventional MRI techniques has been reported. This prospective study aimed to evaluate if CEST MRI can detect the biochemical composition of CSF through tests of correlations of the compounds detected by CEST MRI with biochemical analysis reports.Methods
Serial CSF samples were collected from cadavers for six months (May through October 2020). There were altogether 78 samples. Each sample contained 6 to 15 ml of CSF. Part of the samples (~6 ml) were sent out for biochemical analysis (SRL Laboratory, Tokyo, Japan). Test tubes containing the entire or the residual amount of samples (~3 to 12 mL) were put in a holder immersed in saline solution. CEST MRI was performed on each test tube, using a 64-channel head coil and a 3T scanner (Magnetom Prisma, Siemens Healthcare, Erlangen, Germany). A prototype 2-dimensional single-slice radiofrequency-spoiled centric-reordered GRE sequence (TR/TE= 5000/ 2.3 ms, slice thickness= 4 mm, FOV= 200 × 200 mm2, matrix= 128 × 128, FA= 15°) with a continuous-wave saturation pulse (tsat=1 s, B1=2.4 µT) swept from −5 to 5 ppm (increment 0.2 ppm) was used to acquire z-spectra. The data were then fitted using pseudo-Voigt approximation and assuming a six-pool (amide, intermediate exchanging amine, hydroxyl, water, and aliphatic protons at -1.6 ppm -3.5 ppm) model2, 3. The area of each pool was recorded and normalized by that of water. Each normalized area was then tested for correlation with the CSF composition as assessed by biochemical analysis. Pearson’s product-moment correlation analyses were used for these purposes, and statistical significance was set as P<0.050.Results
Of 78 samples, 26 samples were not eligible for biochemical analysis (N= 22) or did not meet the B0 inhomogeneity requirements of CEST MRI (N= 4), leaving 52 samples for further evaluation. The CSF compositions of these samples are summarized in Fig 1. is The normalized area for intermediate exchanging amines showed a moderate positive correlation with protein concentration (r= 0.436, P= 0.001), a weak positive correlation with specific gravity (r= 0.369, P= 0.007), and a weak negative correlation with pH (r= -0.290, P= 0.037) (Fig 2-4). No significant correlations were observed for the other pools. Illustrative examples demonstrating a variation in the normalized area of intermediate exchanging amines and the corresponding z-spectra, with varying protein concentration, are given in Fig 5.Discussion
The pool representing intermediate exchanging amine is reported to contribute from proteins such as albumin and protamine, amino acids such as L-arginine, polypeptides, glutamate/ glutamine, and creatine1, 4. The correlation of this pool area and lack of correlation of the amide pool area with CSF protein concentration may suggest that the CSF proteins under physiological and pathological states are mainly the proteins from this pool than amides. Since albumin forms the major CSF protein, this observation is thought to suggest that CEST MRI can be used to detect a change in this CSF protein. The correlation with specific gravity and pH is thought to stem from a change in protein concentration. Failure to detect a change in CSF glucose may suggest that improvement in B0 and B1 homogeneity and z-spectrum fitting profiles or the use of exogenous contrast is required.Conclusions
The normalized area for intermediate exchanging amines may be sensitive to detect a change in CSF proteins. Further studies and modifications of acquisition protocol or image processing will be needed for in vivo estimation of CSF biochemical composition by CEST MRI.Acknowledgements
This study was supported by the Grant-in-Aid for scientific research by the Japan Society for Promotion of Science (20K12590).References
- Wu B, Warnock G, Zaiss M, et al. An overview of CEST MRI for non-MR physicists. EJNMMI Phys 2016; 3(1): 19.
- Mashall I, Higinbotham J, Bruce S, Freise A. Use of Voigt lineshape for quantification of in vivo 1H spectra. Magn Reson Med 1997; 37(5):651-7
- Zaiss M, Schemitt B, Bachert P. Quantitative separation of CEST effect from magnetization transfer and spillover effects by Lorentzian-line-fit analysis of z-spectra. J Magn Reson 2011; 211(2):149-55
- Zu ZL, Louie EA, Lin EC, et al. Chemical exchange rotation transfer imaging of intermediate-exchanging amines at 2 ppm[J]. NMR Biomed, 2017, 30(10). DOI: 10.1002/nbm.3756.
Figures
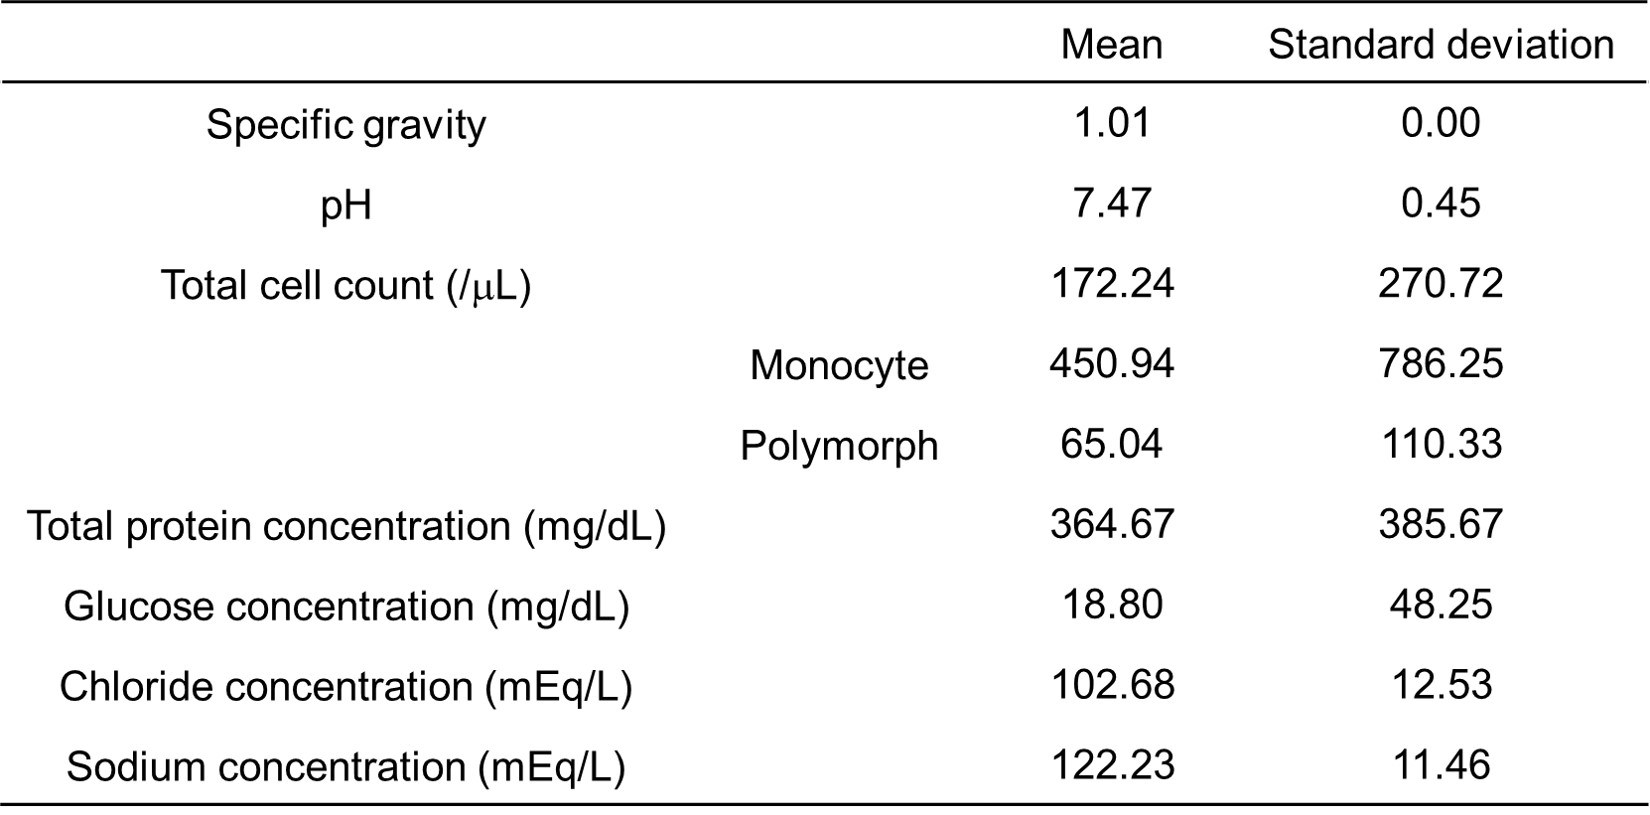
Fig 1. Biochemical composition of the cerebrospinal fluid (CSF) samples
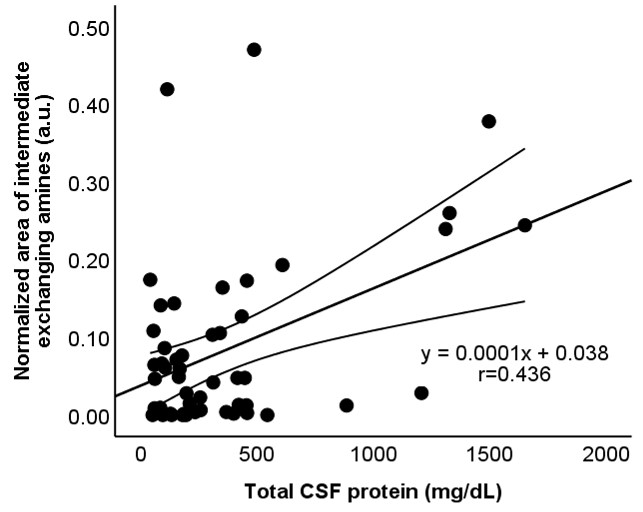
FIg 2. Scatterplots showing the correlation between the
normalized area for intermediate exchanging amines and CSF protein
concentration (r=0.436, P=0.001). The straight and curved lines indicate the mean
and 95% confidence interval.
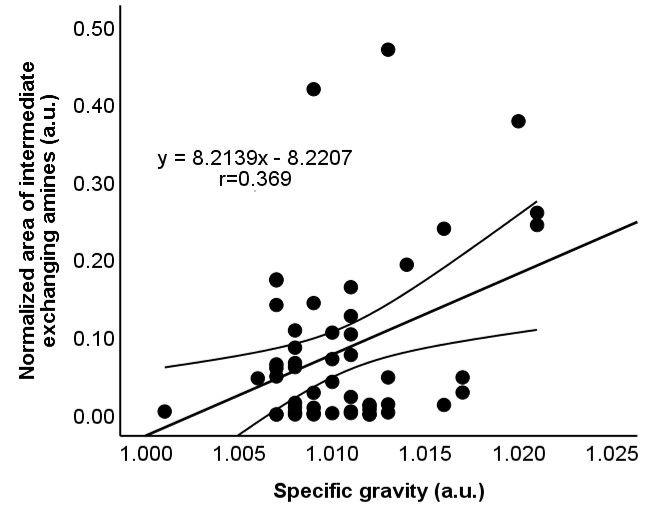
Fig 3. Scatterplots
showing the correlation between the normalized area for intermediate exchanging
amines and specific gravity (r=0.369, P=0.007). The straight and curved lines
indicate the mean and 95% confidence interval.
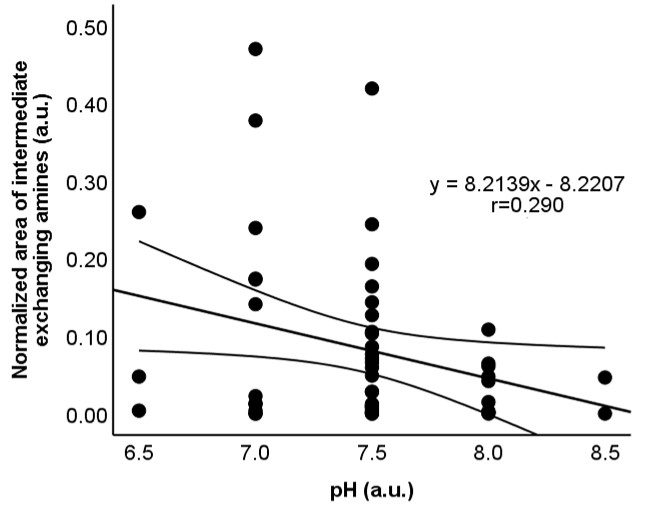
Fig 4. Scatterplots
showing the correlation between the normalized area for intermediate exchanging
amines and pH (r=-0.290, P=0.037). The straight and curved lines indicate the mean
and 95% confidence interval.
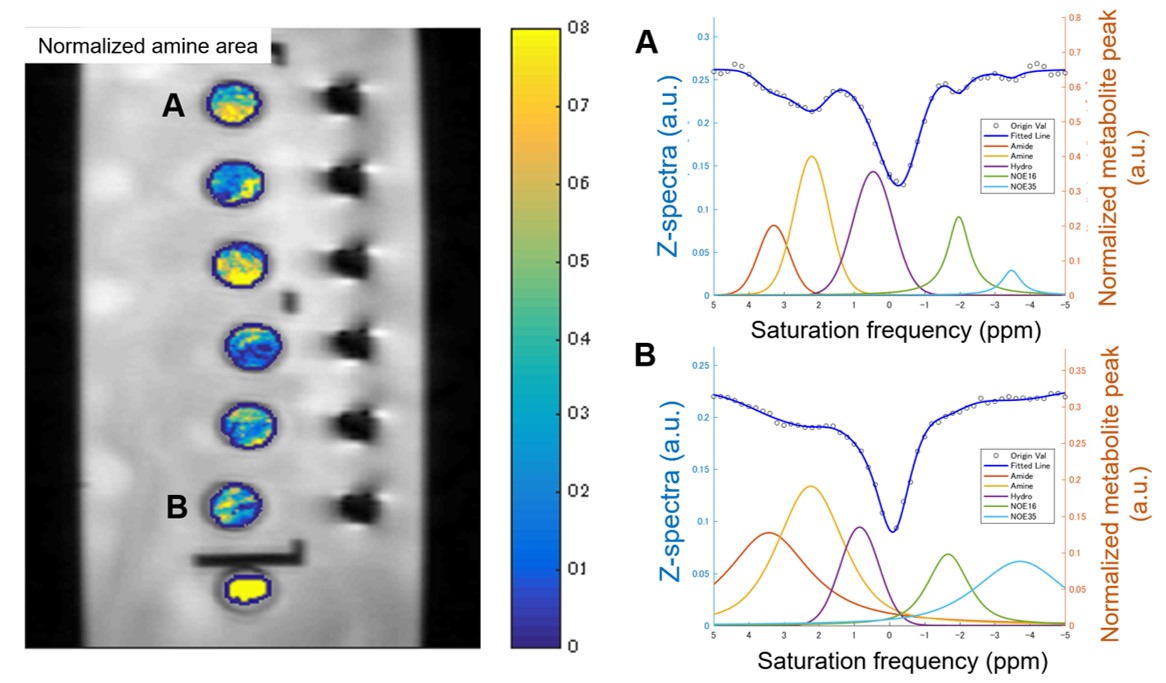
Fig 5. Maps of
the normalized area of intermediate exchanging amines for six CSF and one control phantoms (left). Note the variation between two labeled test tubes -- test tube "A" (CSF protein concentration= 487 mg/dL) and test tube "B" (177 mg/dL). "A" has a higher normalized area than "B". The corresponding z spectra (right) are
also given.