2384
Low b-value DTI for Measuring Pseudo-random Flow of CSF: Region of Interest Analysis on Normal Volunteers1Healthcare Business Unit, Hitachi, Ltd., Tokyo, Japan, 2Department of Diagnostic Imaging, Hokkaido University Graduate School of Medicine, Sapporo, Japan
Synopsis
Low b-value DTI (Low-b DTI) has been recently proposed for investigating the CSF physiology, and was reported to reflect the covariance of velocity distribution of the pseudo-random flow. The purpose of this study was to analyze diffusion properties of Low-b DTI (i.e. diffusion tensor, mean diffusivity, and fractional anisotropy) for normal volunteers. The diffusion properties show statistically high and anisotropic values at some ROIs such as around the foramen of Monro, the aqueduct, the prepontine cistern and the Sylvian fissure. It demonstrates that Low-b DTI can be used for evaluating the pseudo-random flow of CSF.
Introduction
Neurofluids, including cerebrospinal fluid (CSF) and interstitial fluid (ISF), have been attracting a lot of attention because they deeply relate to clearance of substances in the brain1-3. Recently, low b-value diffusion tensor imaging (Low-b DTI) has been used for investigating the CSF physiology4-8, and was reported to reflect the covariance of velocity distribution of pseudo-random flow7. Accordingly, the diffusion properties of Low-b DTI, such as diffusion tensor (DT), mean diffusivity (MD), and fractional anisotropy (FA), can represent the intensity and the anisotropy of the pseudo-random flow. The purpose of this study was to analyze diffusion properties of Low-b DTI for normal volunteers to investigate the pseudo-random flow of CSF.Methods
This study was approved by the ethics committee of Hitachi Group. Six healthy volunteers were scanned using a 3-T MRI (Hitachi, Ltd., Tokyo, Japan). Diffusion-weighted echo-planar imaging was performed with TR = 10 s, TE = 90 ms, FOV = 240 mm, matrix = 128 × 128, slice thickness = 4 mm (interpolated to 2 mm), number of slice = 30 (interpolated to 59), and b = 0/100/1000 ×106 s/m2 with 15 non-colinear directions. No gating was used either for pulsation or respiration. Two DTs were respectively calculated: low b-value DT (DTL) using b: 0-100 and high b-value DT (DTH) using b: 0-1000. Eigensystem, MD and FA were calculated for DTL and DTH. 2D multislice maps of MD and FA were used to select ROIs in CSF. The selected ROIs in CSF were five ROIs with high MD and FA as well as one reference ROI with low MD and FA like free-water. To assess a pseudo-random flow of CSF, eigensystems of DTL were visualized as ellipsoid-representation maps in the ROIs. To quantitatively evaluate the pseudo-random flow, the means MD and FA of the ROIs were statistically tested against those of the reference ROI.Results
The obtained 2D multislice maps of MD and FA of DTs were shown (Fig. 1). Those maps show that the DTL has much higher MD and higher FA compared to free-water diffusion in some subsegments of CSF, typically in the following ROIs: (a) the entrance of third ventricle from the foramen of Monro, (b) the entrance of fourth ventricle from the aqueduct, (c) the prepontine cistern, (d) the subarachnoid space around the MCA (M1), and (e) the Sylvian fissure. The maps also show that the DTL has low MD and low FA like free-water in the ROI (f): the anterior horn of the lateral ventricle. The ROIs (a-e) were selected to assess the pseudo-random flow of CSF and the ROI (f) was selected as a reference to the other ROIs. Figure 2 shows typical ellipsoid-representation maps in the ROI (b): the entrance of fourth ventricle from the aqueduct of two volunteers. Both maps show similar trains of ellipsoid from aqueduct to inferior-direction, whereas the two maps show different ellipsoid-shapes; 37M is prolate and 26M is oblate (thinner in the anterior-posterior direction) around the center of the maps. Statistical analysis confirms that DTL is large and anisotropic in the ROIs (a-e) (Fig. 3, Table 1). The mean MD of DTL exceeds 8 × 10⁻⁹ m2/s and the mean FA of DTL exceeds 0.27 in all the ROIs (a-e). These means MD and FA of DTL are significantly higher than those in the ROI (f), whereas those of DTH does not show significant difference in some ROIs.Discussion
The selected ROIs with significantly high MD and FA of DTL agree well with previous reports5,6,8. The large and anisotropic diffusivity, representing large and anisotropic covariance of velocity distribution of pseudo-random flow7, might be caused by (i) bulk flow in complex channel of CSF and (ii) the beating artery and parenchyma driven by cardiac pulsation. Accordingly, the difference of MD and FA of DTL at the ROIs across the volunteers might reflects the difference of the subject’s physiological state. However, the difference might be also caused by instability of the measurement technique, and thus, more detailed study is necessary for validating the technique as well as for investigating the physiological state. Although further improvement is needed in measurement and analysis techniques, the Low-b DTI can be useful in quantitatively evaluating the CSF physiology.Conclusion
Low-b DTI was measured for analyzing pseudo-random flow of CSF for normal volunteers. Measured diffusion properties of Low-b DTI show significantly higher MD and high FA at some ROIs; for instance, around the foramen of Monro, the aqueduct, the prepontine cistern and the Sylvian fissure, compared to the reference ROI: anterior horn of the lateral ventricle. It demonstrates that Low-b DTI can be used for investigating physiology of CSF.Acknowledgements
No acknowledgement found.References
1. Iliff JJ, et al. A paravascular pathway facilitates CSF flow through brain parenchyma and the clearance of interstitial solutes, including amyloid β. Sci Transl Med 2012; 4: 147ra111.
2. Taoka T, et al. Glymphatic imaging using MRI. J Magn Reson Imag 2020; 51: 11-24.
3. Naganawa S, et al. The glymphatic system: a review of the challenges in visualizing its structure and function with MR imaging. Magn Reson Med Sci, doi:10.2463/mrm.rev.2020-0122.
4. Harrison IF, et al. Non-invasive imaging of CSF-mediated brain clearance pathways via assessment of perivascular fluid movement with diffusion tensor MRI. eLIFE 2018; 7: e34028.
5. Hirschler L, et al. High resolution T2-prepared MRI enables non-invasive assessment of CSF flow in perivascular spaces of the human brain. ISMRM 2019; 746.
6. Bito Y, et al. Stirred CSF measured by low b-value DTI. ISMRM 2019; 1045.
7. Bito Y, et al. Low b-value DTI for analyzing pseudo-random flow of CSF. ISMRM 2020; 534.
8. Hirschler L, et al. The driving force of glymphatics: influence of the cardiac cycle in perivascular spaces in humans. ISMRM 2020; 643.
Figures
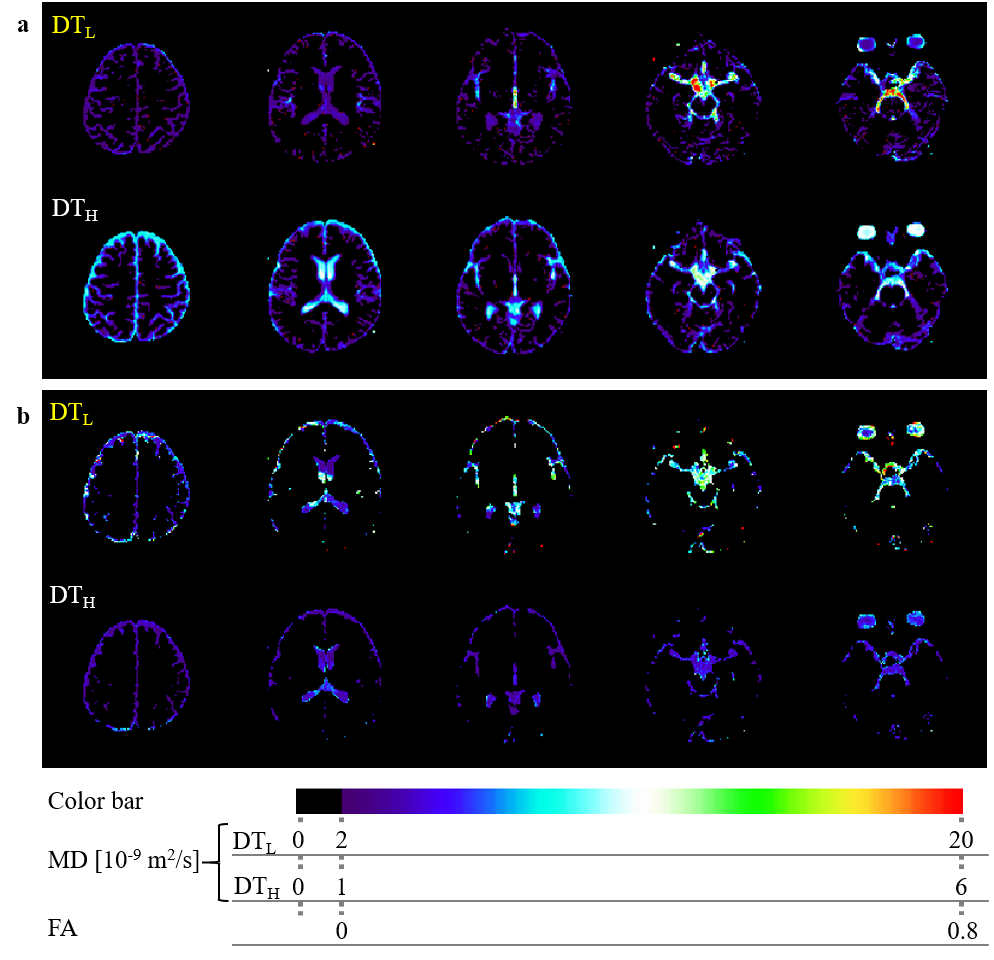
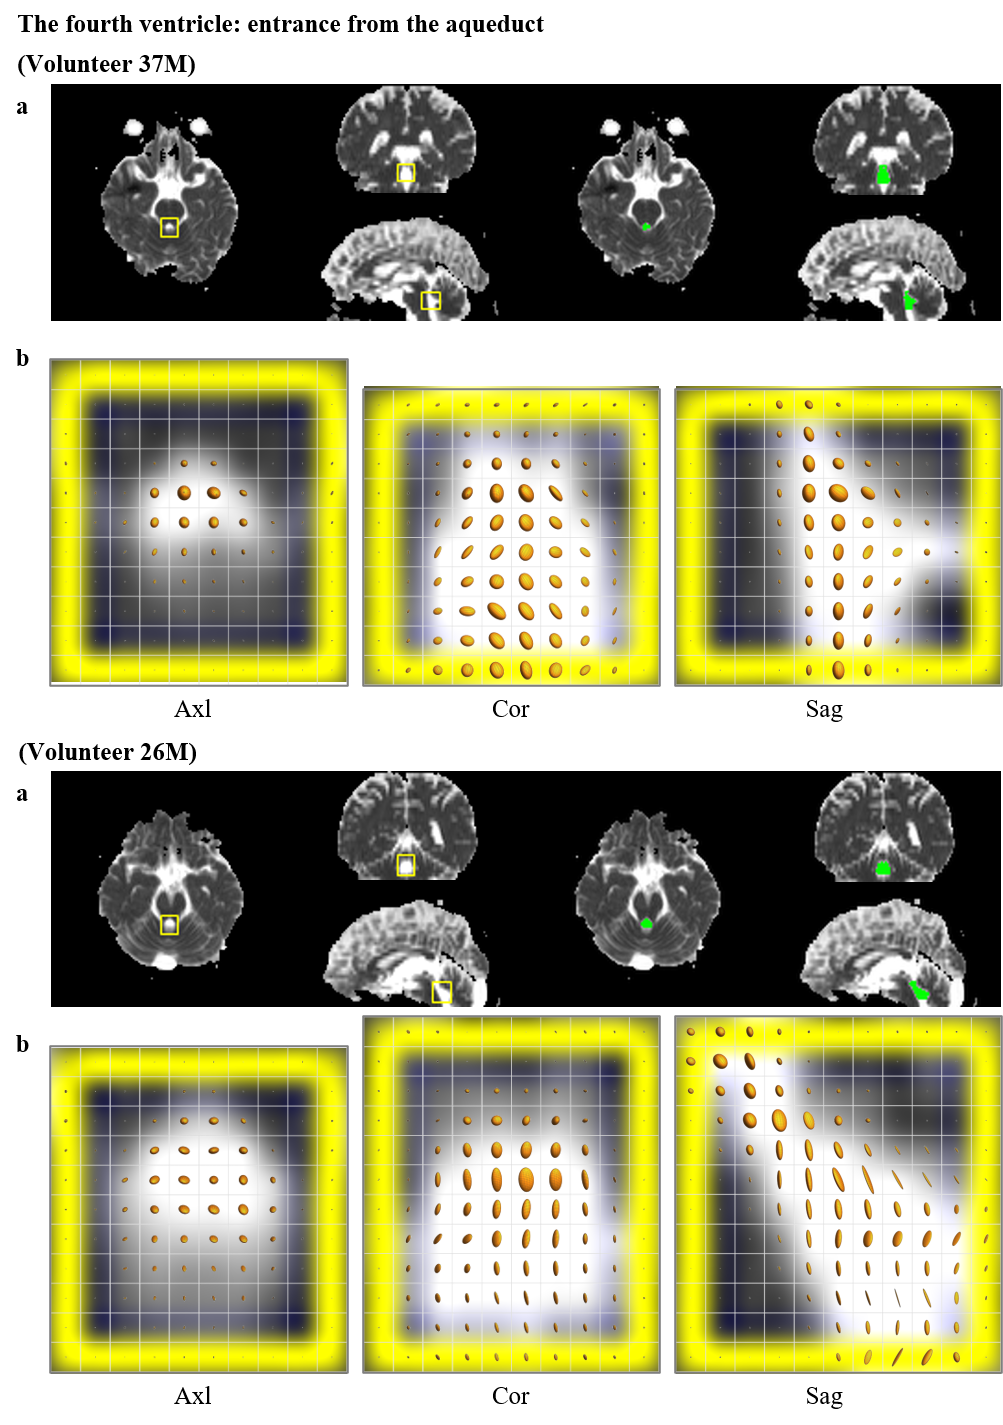
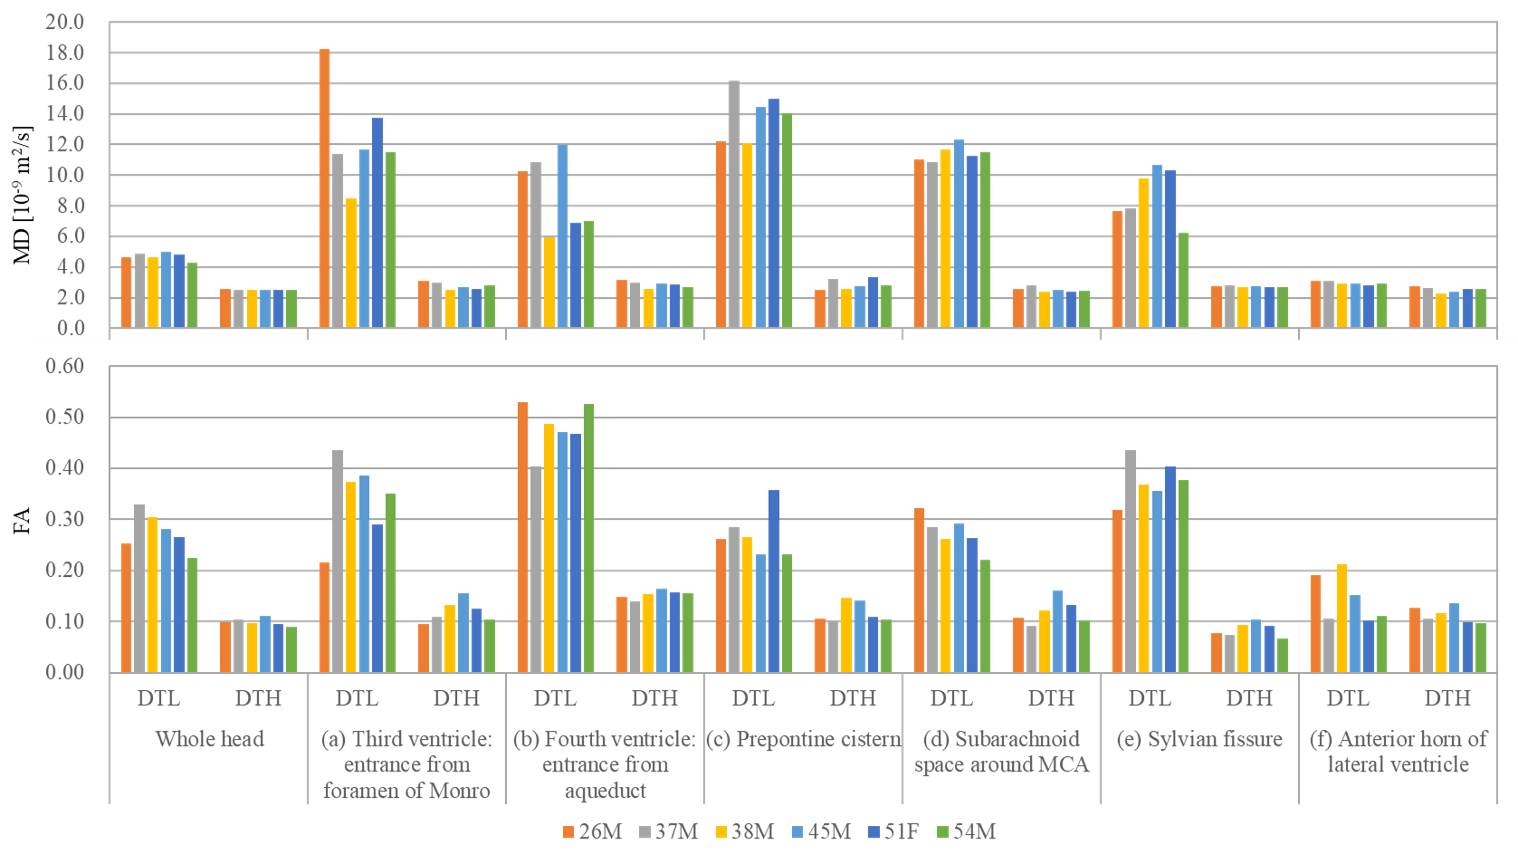
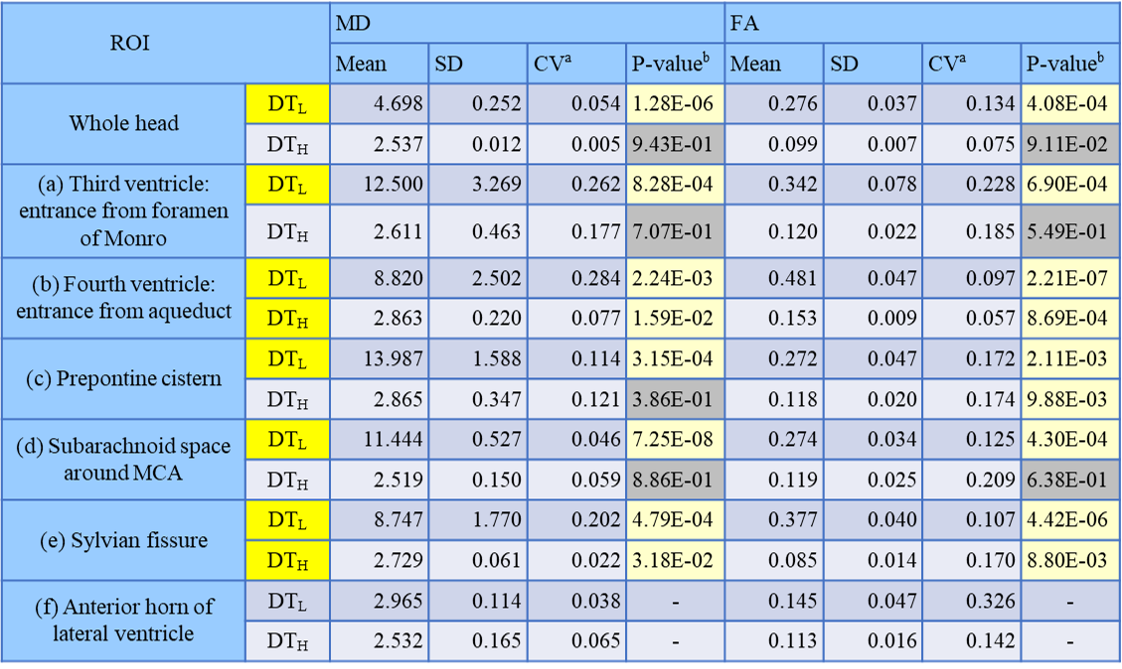
Table 1. Statistical results about MD and FA of DTL and DTH in every ROI.
aCV was calculated as SD/Mean.
bP-value at each ROI was calculated against the ROI (f): the anterior horn of lateral ventricle. Yellow cell shows P-value < 0.05.