2383
Investigation of Cardiac- and Respiratory-driven CSF Motions using Asynchronous Phase Contrast with Frequency Analysis
Satoshi Yatsushiro1, Tomohiko Horie2, Mitsunori Matsumae3, and Kagayaki Kuroda1
1Department of Human and Information Science, Tokai University, Hiratsuka, Japan, 2Department of Radiological Technology, Tokai University Hospital, Isehara, Japan, 3Department of Neurosurgery, Tokai University, Isehara, Japan
1Department of Human and Information Science, Tokai University, Hiratsuka, Japan, 2Department of Radiological Technology, Tokai University Hospital, Isehara, Japan, 3Department of Neurosurgery, Tokai University, Isehara, Japan
Synopsis
To investigate cardiac- and respiratory-driven CSF motions in the intracranial space, asynchronous phase contrast (Async-PC) imaging with Stockwell transform (ST) and power mapping was conducted for 3 healthy volunteers under free breathing. ST can separate the cardiac- and respiratory-driven CSF motions as spectrogram. Power mapping visualizes the power of the spectrum voxel-by-voxel. Async-PC with ST presented the time-frequency property of the cardiac- and respiratory-driven CSF motions, while that with the power mapping technique visualized the spatial distribution of both the motion contributions. Combination of those techniques may provide new findings related with CSF dynamics.
Introduction
Cerebrospinal fluid (CSF) motion is consisted of cardiac-driven motion, respiratory-driven motion, and bulk flow. Understanding of those components is important to know the mechanisms of CSF circulation.1,2 The cardiac- and respiratory-driven CSF motion under free breathing state can be simultaneously measured by asynchronous phase contrast (PC) imaging, and then separated by Stockwell transform (ST).3,4 In this study, as a further step, the cardiac- and respiratory-driven CSF motions for healthy volunteers under free breathing state were separately visualized based on Asynchronous PC with echo planar imaging (EPI-PC) in conjunction with ST and power mapping technique.Methods
CSF motion measurement at the midline slice in the intracranial space under free breathing state was conducted for 3 healthy volunteers (3 males, mean age of 22±1) using EPI-PC at 1.5T-MRI. An electrocardiogram and bellows-type pressure sensor were equipped to monitor the cardiac pulsation and respiration, respectively. The imaging conditions were as following: flow encoding direction, foot-head; TR, 77.1 ms; TE, 31.2 ms; parallel imaging factor, 2.5; acquisition matrix, 126×128; reconstruction matrix, 256×256; field of view, 28×28 cm2; slice thickness, 5 mm; velocity encoding (VENC), 10 cm/s; data points, 2048; temporal resolution, 154 ms (6.5 frames/s). The resultant scan time was about 315 sec.The formulation of ST is defined as below,
$$S_v(t,f)=\frac{|f|}{k\sqrt{2π}}\int_{\infty}^{\infty}v(\tau)e^{-\frac{(t-\tau)^2f^2}{2k^2}}e^{-2iπf\tau}d\tau,k>0$$
where Sv(t, f) is the spectrogram, v(t) is the velocity waveform obtained from EPI-PC, f is the frequency, t, τ are the time, and k is a scale factor, basically 1 in this study, that controls the number of oscillation in the window. The time integral of the spectrogram calculated by ST is the Fourier spectrum.
Power mapping technique was performed, which the technique depicted the power of the Fourier spectrum for the particular frequency band.5 The cardiac and respiratory frequency band was determined after ST analysis.
Results
Figure 1 showed the magnitude and phase image of EPI-PC of a healthy volunteer. The susceptibility artifact obviously appeared in the prepontine because of air of cavity of nose. The spectrograms of the CSF velocity obtained from ROIs shown in Figure 1 were exhibited in Figure 2. The color-coding indicates the velocity amplitude for each frequency and time. The cardiac- and respiratory-driven CSF velocity components were observed at approximately 1-1.5 Hz and 0.3-0.5 Hz, respectively. Therefore, in this case, the cardiac frequency band was defined as 1-2 Hz, while the respiratory was 0-0.5 Hz. The velocity amplitude of the cardiac- and respiratory-driven components looked like gradually decreased from the foramen magnum to the aqueduct, although the frequencies of the cardiac- and respiratory-driven components were not varied among ROIs.The results of the power mapping were shown in Figure 3. The cardiac-driven component looked like higher than the respiratory that. However, in the fourth ventricle, the respiratory-driven component seemed to be high indicated by yellow arrow heads in Figure 3.
Discussion
EPI-PC demonstrated that can measure the cardiac- and respiratory-driven CSF motions in the intracranial space. EPI-PC with ST may clarify the time-frequency properties of the cardiac- and respiratory-driven CSF motions. The power mapping technique is expected to provide information about CSF dynamics with related to the driving force. These techniques may have abundant information to understand the CSF dynamics in the intracranial space.Results of the spectrogram showed the time-frequency property of the cardiac- and respiratory-driven CSF motion in each anatomical location. The cardiac-driven components were higher at the foramen magnum and the prepontine than at the others. This implies that the driving force of the cardiac-driven component is located near the space, which was supported by previous report.6 In addition, the respiratory-driven CSF velocity gradually changed from the foramen magnum to the Sylvius aqueduct. It was reported that the respiratory-driven component was larger in the lower spinal level.7 Therefore, the respiratory-driven CSF velocity in the spectrograms was varied in ROIs.
The power mapping exhibited the contribution of the cardiac- and respiratory-driven components to the CSF motion. The contribution of the cardiac-driven component was relatively higher around the brainstem than that of the respiratory; however, the respiratory-driven component seemed to be high in the fourth ventricle. This may indicate the difference of the properties of the cardiac- and respiratory-driven CSF motion and its driving forces. The cardiac-driven CSF motion is expected to be caused by major arterial pulsations and pressure propagation. Respiration changes venous pressure and/or intrathoracic pressure, resulting in the bulk movement of CSF. Thus, the difference of the power maps indicated the difference of the properties of the motions.
The present study has limitations. One of those is a few subjects. Therefore, the further experiments will be performed to the further investigation. Another one is to select the frequency range of the bandpass filter. Selection of appropriate frequency range or application of window function such as gaussian window will be needed to optimally extract the cardiac- and respiratory-driven components.
Conclusion
EPI-PC with ST and power mapping technique demonstrated the cardiac- and respiratory-driven CSF motions as well as its spatial distribution. Those techniques may give us abundant information of CSF dynamics such as driving force.Acknowledgements
The authors thank Prof. Yutaka Imai for his assistance with MR imaging. Kagayaki Kuroda and Satoshi Yatsushiro thank Dr. Koichi Oshio at the Keio University School of Medicine for his valuable suggestions.References
- Brinker T, Stopa E, Morrison J, Klinge P. A new look at cerebrospinal fluid circulation. Fluids and barriers of the CNS 2014;11:10.
- Oreskovic D, Klarica M. A new look at cerebrospinal fluid movement. Fluids and barriers of the CNS 2014;11:16.3.
- Kuroda K, Tokushima T, Yatsushiro S, Kajiwara N, Horie T, Atsumi H, Matsumae M. Separation of Cardiac- and Respiratory-driven CSF Motions under Free Breathing based on Realtime Phase Contrast Imaging and S-Transform. In Proceedings of the 27th Annual Meeting of ISMRM, Montreal, QC, Canada, 2019. p. 238.4.
- Stockwell RG, Mansinha L, Lowe RP. Localization of the complex spectrum: the S transform. IEEE Transactions on Signal Processing 1996;44(4):998-1001.5.
- Sunohara S, Yatsushiro S, Matsumae M, Atsumi H, Horie T, Kajihara N, Kagayaki K. Separation and Characterization of Cardiac- and Respiartory-driven Motion of Intracranial Cerebrospinal Fluid Based on Asynchronous Two-dimensional Phase Contrast Imaging. Japanese Journal of Magnetic Resonance in Medicine. 2017; 37(4):87-96.6.
- Hayashi N, Matsumae M, Yatsushiro S, Hirayama A, Abdullah A, Kuroda K. Quantitative Analysis of Cerebrospinal Fluid Pressure Gradients in Healthy Volunteers and Patients with Normal Pressure Hydrocephalus. Neurologia medico-chirurgica. 2015; 55:657-662.7.
- Friese S, Hamhaber U, Erb M, Kueker W, Klose U. The influence of pulse and respiration on spinal cerebrospinal fluid pulsation. Investigative radiology. 2004; 39:120-130.
Figures
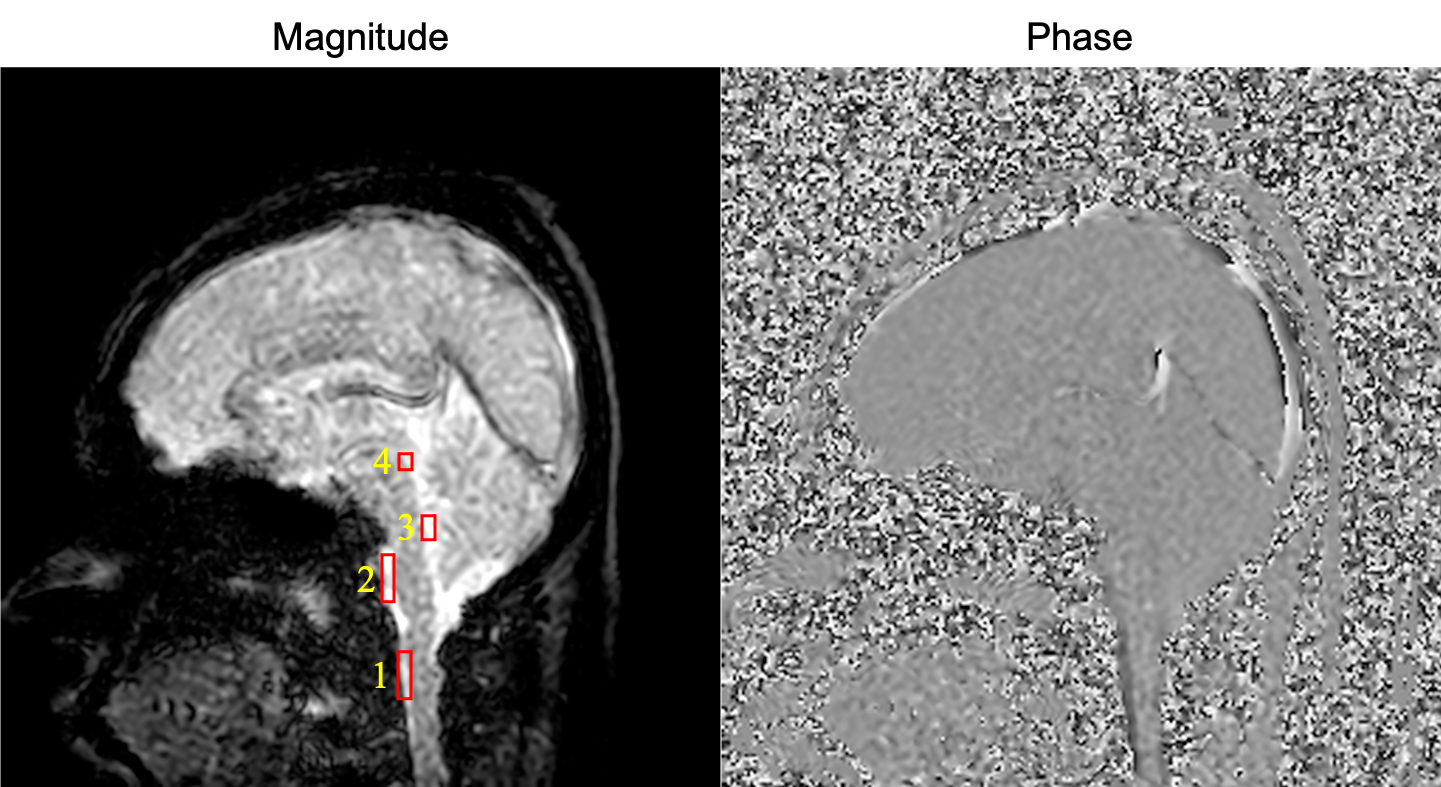
Figure 1. Magnitude and phase images of asynchronous phase contrast with echo planar imaging of a healthy volunteer. ROIs are depicted as red rectangles on the magnitude image. ROI 1, the foramen magnum; ROI 2, the prepontine; ROI 3, the fourth ventricle; ROI 4, Sylvius aqueduct.
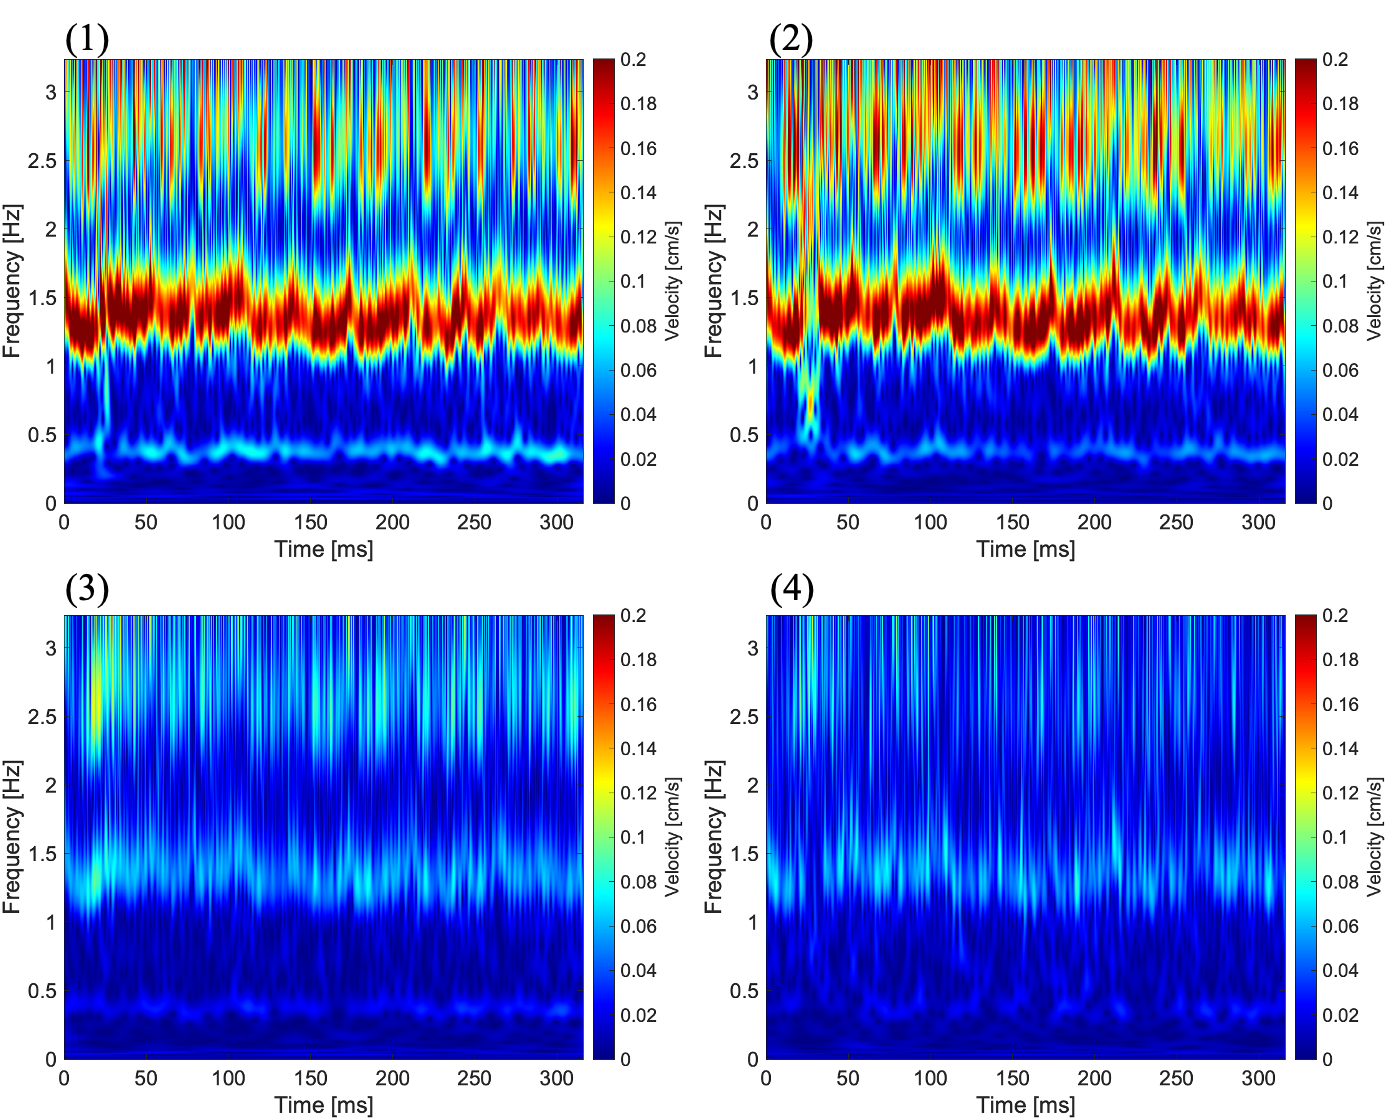
Figure 2. Spectrograms of CSF velocity obtained from ROIs shown in Figure 1. Number at top-left on each image corresponds to the ROI number in Figure 1. Cardiac- and respiratory-driven velocities gradually changes from (1) to (4).
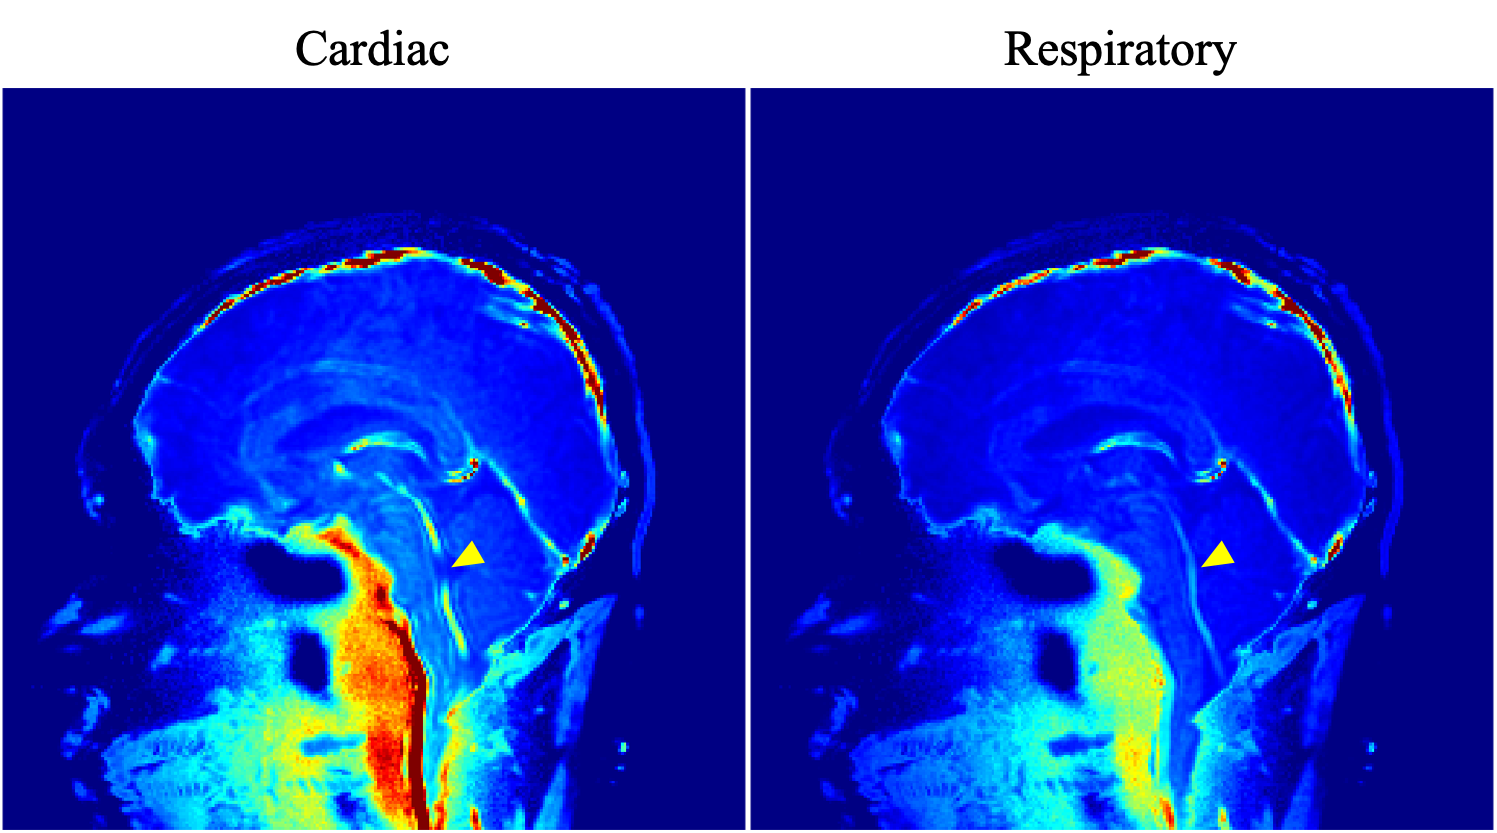
Figure 3. Power maps of the cardiac- and respiratory-driven CSF motion components. The power of the cardiac-driven component looked like higher around the brainstem than that of the respiratory. Meanwhile, in the fourth ventricle, the contribution of the respiratory-driven component was high indicated by yellow arrow head.