2382
Breaking up Cerebrovascular Reactivity BOLD-fMRI to Investigate Dilation and Constriction Features1Medical Biophysics, University of Toronto, Toronto, ON, Canada, 2Physical Sciences, Sunnybrook Research Institute, Toronto, ON, Canada
Synopsis
Cerebrovascular reactivity (CVR) is assessed by dynamic MRI scanning, such as BOLD-fMRI during a hypercapnia gas challenge. Conventional CVR metrics do not account for individual vasoactive challenges in series. We study the relationship between vasoconstriction after the 1st hypercapnia challenge and CVR during the 2nd challenge, using a non-parametric method, Sen’s Slope, to estimate BOLD change. We show that vasoconstriction is directly proportional to the amplitude of CVR across a range of adult ages, as assessed by linear regression analysis. These results support our hypothesis that temporal features of a cerebrovascular challenge can provide additional insight on cerebrovascular physiology.
Introduction
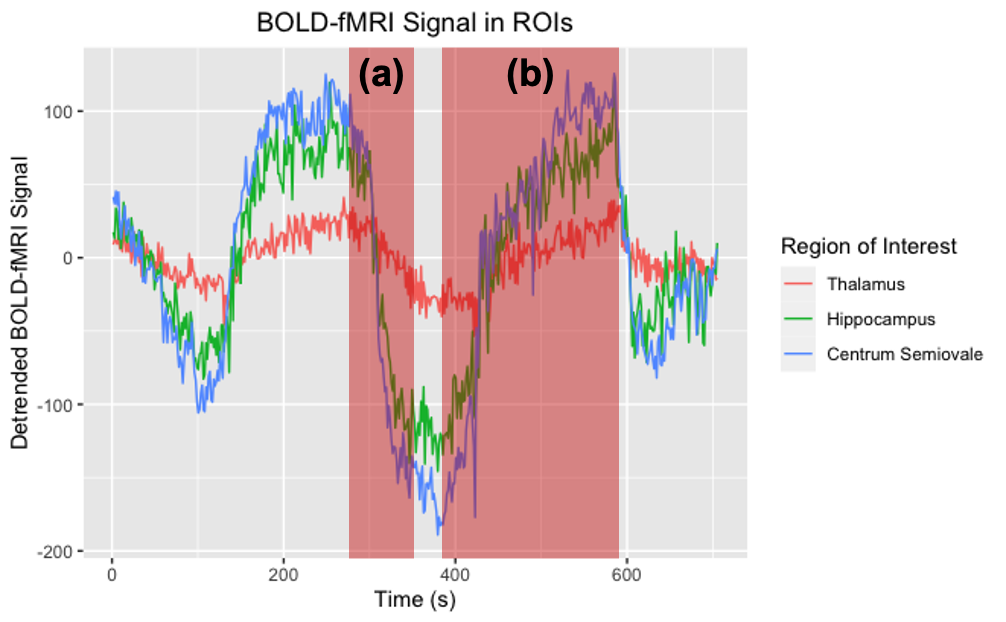
Cerebrovascular reactivity (CVR) is a functional neuroimaging measure that provides a measure of vasodilation to a vasoactive stimulus. Blood oxygenation level dependent (BOLD) and arterial spin labeling (ASL) MRI sequences are commonly used for CVR measurement.1,2 To induce a vascular response, CO2 is administered in a block paradigm, interleaving room and hypercapnic gas; this procedure is an efficient MRI approach to index the brain’s vascular health.2-4 Post-processing generally uses a linear regression model between the BOLD signal and the experimental paradigm to yield a voxel-wise parametric estimate of signal change.5 This single estimate provides useful information; yet, extracting additional CVR metrics may lead to new insight and hence clinical value. To better understand the physiological response to a vasoactive stimulus, we investigate whether there is a relationship between the rate of vasoconstriction after the first hypercapnic challenge (Fig. 1a) and CVR during the second vasodilation event (Fig. 1b). Because linear model estimations of CVR require multiple repetitions of gas administration, and we are analyzing a single challenge, we propose a non-parametric approach to estimating CVR. Theil Sen’s Slope, a non-parametric measure, is well suited to analyze individual components of a hypercapnic challenge because it is robust to outliers, conducive to time series segments, and can yield robust estimates.6,7Methods
Study design: 78 participants (F: 66.7 ± 9.2 years, M: 52.0 ± 19.67 years), nominally comprising 3 age groups, were recruited to this study at Sunnybrook Research Institute. To date, full datasets and analysis were completed in N=51.Breathing task: A boxcar “on-off” hypercapnia gas challenge was administered as follows: 2 minutes of room air, 3 minutes of 6% CO2 air, 2 minutes of room air, 3 minutes of 6% CO2 air, and 2 minutes of room air.
Imaging: BOLD-fMRI data were collected on a 3T Siemens Prisma system scanner using an SMS-EPI pulse sequence. Imaging parameters for this sequence were: TR= 1550 ms, TE= 30.0 s, flip angle=67°, number of slices = 50, slice thickness = 2.5 mm, number of volumes = 478. Functional images were pre-processed for motion-correction using FSL MCFLIRT (FSL, version 5.0, http://fsl.fmrib.ox.ac.uk), spatially smoothed with a 5 mm FWHM Gaussian Kernel, detrended with a third-order polynomial, a high-pass filter of 300 s, and slice-timing correction. The first five volumes of BOLD images were removed to account for signal equilibrium.
ROI Generation: Two grey and one white matter regions of interest (ROI) were determined a priori. Participant-specific bilateral masks for the thalamus and hippocampus were created using the T1- weighted image and FSL FIRST (FSL, version 5.0, http://fsl.fmrib.ox.ac.uk). A standard-space centrum semiovale bilateral mask was created three slices superior to the lateral ventricles. Masks were co-registered to the BOLD data to extract time series information.
Data Analysis: The non-parametric Sen’s slope is calculated as the median estimate of the slope between all data pairs. Software in R (R Core Team, 2020) was used to calculate the change between end-tidal CO2 levels during baseline and hypercapnia. A linear regression model was performed for each ROI separately. The outcome variable was the amplitude of CVR for the second vasodilation block, while explanatory variables were: a) rate of the first vasoconstriction (β1) and b) age (β2).
Results
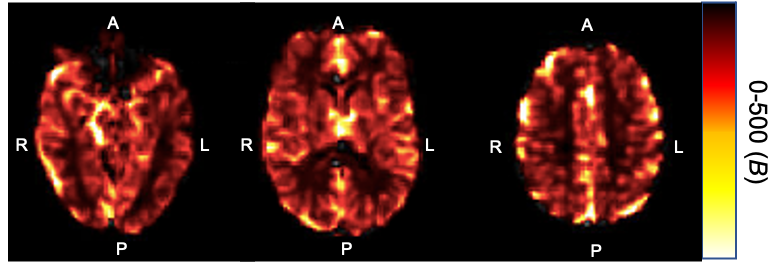
The average BOLD-fMRI time course for all participants in each ROI is shown in Fig. 1, with labels indicating the first vasoconstriction and second vasodilation events. Fig. 2 shows a representative CVR map for a 65-year-old female. Table 1 shows the standardized beta and adjusted R2 values by ROI. We found vasodilation of the second CVR block was significantly associated with vasoconstriction after the first CVR block for each ROI (Centrum Semiovale: P<0.001, Thalamus: P<0.001, Hippocampus: P=<0.001), while age was not significant.Conclusion and Discussion
By investigating individual temporal components in a BOLD-based hypercapnic experiment, we were able to show direct association between successive CVR challenges. Across the adult age range of this sample, vasoconstriction predicted the amplitude of the subsequent vasodilation. The hippocampal ROI showed the strongest association compared to the thalamus and centrum semiovale. Future work will include a direct comparison of parametric and non-parametric CVR estimates, as well as integrating baseline cerebral blood flow levels into the analysis.Acknowledgements
We would like to acknowledge our MRI research technologists, Garry Detzler and Ruby Endre, for their assistance in scanning participants.References
1. Tancredi FB, Hoge RD. Comparison of cerebral vascular reactivity measures obtained using breath-holding and CO2 inhalation. J Cereb Blood Flow Metab. 2013;33(7):1066-1074. doi:10.1038/jcbfm.2013.48
2. Thrippleton MJ, Shi Y, Blair G, et al. Cerebrovascular reactivity measurement in cerebral small vessel disease: Rationale and reproducibility of a protocol for MRI acquisition and image processing. 2017;13(2):195-206. doi:10.1177/1747493017730740
3. Liu P, De Vis JB, Lu H. Cerebrovascular reactivity (CVR) MRI with CO2 challenge: A technical review. Neuroimage. 2019;187:104-115. doi:10.1016/j.neuroimage.2018.03.047.
4. Alwatban M, Murman DL, Bashford G. Cerebrovascular Reactivity Impairment in Preclinical Alzheimer's Disease. J Neuroimaging. 2019;29(4):493-498. doi: 10.1111/jon.12606
5. Poublanc J, Crawley AP, Sobczyk O, et al. Measuring cerebrovascular reactivity: the dynamic response to a step hypercapnic stimulus. J Cereb Blood Flow Metab. 2015;35(11):1746-56. doi: 10.1038/jcbfm.2015.114.
6. Panwar, M; Agarwal, A; Devadas, V. Analyzing land surface temperature trends using non-parametric approach: A case of Delhi, India. Urban Climate. 2018;24:19–25. doi:10.1016/j.uclim.2018.01.003
7. Ahmed S. Assessment of irrigation system sustainability using the Theil–Sen estimator of slope of time series. Sustainability science. 2014;9(3):293-302.
Figures