2379
Vascular origins of low-frequency oscillations in cerebrospinal fluid resting-state fMRI signal: Interpretation using photoplethysmography1Medical Biophysics, University of Toronto, Toronto, ON, Canada, 2Rotman Research Institute, Baycrest, Toronto, ON, Canada
Synopsis
Due to its cardiogenic constituents, the cerebrospinal fluid (CSF) contribution to resting-state functional MRI (rs-fMRI) has been used for denoising. Recently, it has become increasingly used for characterizing CSF flow and glymphatic flow. However, the association between CSF and vascular oscillations in rs-fMRI remains to be fully understood. In this study, we quantify the relationship between rs-fMRI fluctuation in different CSF compartments and photoplethysmography (PPG) recordings, focusing on the frequency band around 0.1 Hz. We also quantify their relationship between the rs-fMRI signals (in CSF, tissue and vasculature) and other vascular measures derived from PPG traces.
Introduction
Spontaneous vascular oscillations have diagnostic utility, notably those in the 0.05-0.15Hz (Mayer waves, or M waves) 1, which is also used for functional-connectivity calculations However, intracranial measurements of these oscillations remain difficult. Oscillations in the cerebrospinal fluid (CSF), which are influenced by the cardiac pulse wave, represent a possible avenue for non-invasively tracking these oscillations using resting-state functional MRI (rs-fMRI), and have been used to correct for vascular oscillations in rs-fMRI functional connectivity calculations 2. However, the relationship between low-frequency CSF and vascular oscillations remains unclear. In this study, we investigate this relationship using fast rs-fMRI coupled with fingertip photoplethysmogram (PPG). We not only extract 0.1 Hz spectral power from the PPG signal, but also derive the heart-rate variability (HRV), pulse-intensity ratio (PIR, a surrogate of slow blood-pressure oscillations), and the second-derivative of the PPG (SDPPG, a surrogate of arterial stiffness).Methods
Data AcquisitionMRI data were collected from 18 healthy adults (mean age 30±6.7 years) on a 3T Siemens Trio scanner. Whole-brain rs-fMRI data were acquired using simultaneous multi-slice gradient-echo echo-planar imaging with leak-block slice-GRAPPA 3 (TR=380 ms, TE = 30 ms, flip angle= 40°, 15 slices, 3.44x3.44x6.0 mm3, 2230 time points, 14:00 duration, acceleration factor=3, phase encoding shift factor=2, slices ascending). A 3D T1-weighted anatomical scan was acquired using MPRAGE, with resolution 1 mm3, TR = 2400 ms, (TI =1000 ms. During the fMRI scans, cardiac pulsation was recorded using the Siemens scanner pulse oximeter (sampling rate = 50 Hz), whereas the respiratory signal was recorded using a pressure-sensitive belt connected to the BiopacTM at a sampling rate of 200 Hz.
Data Processing
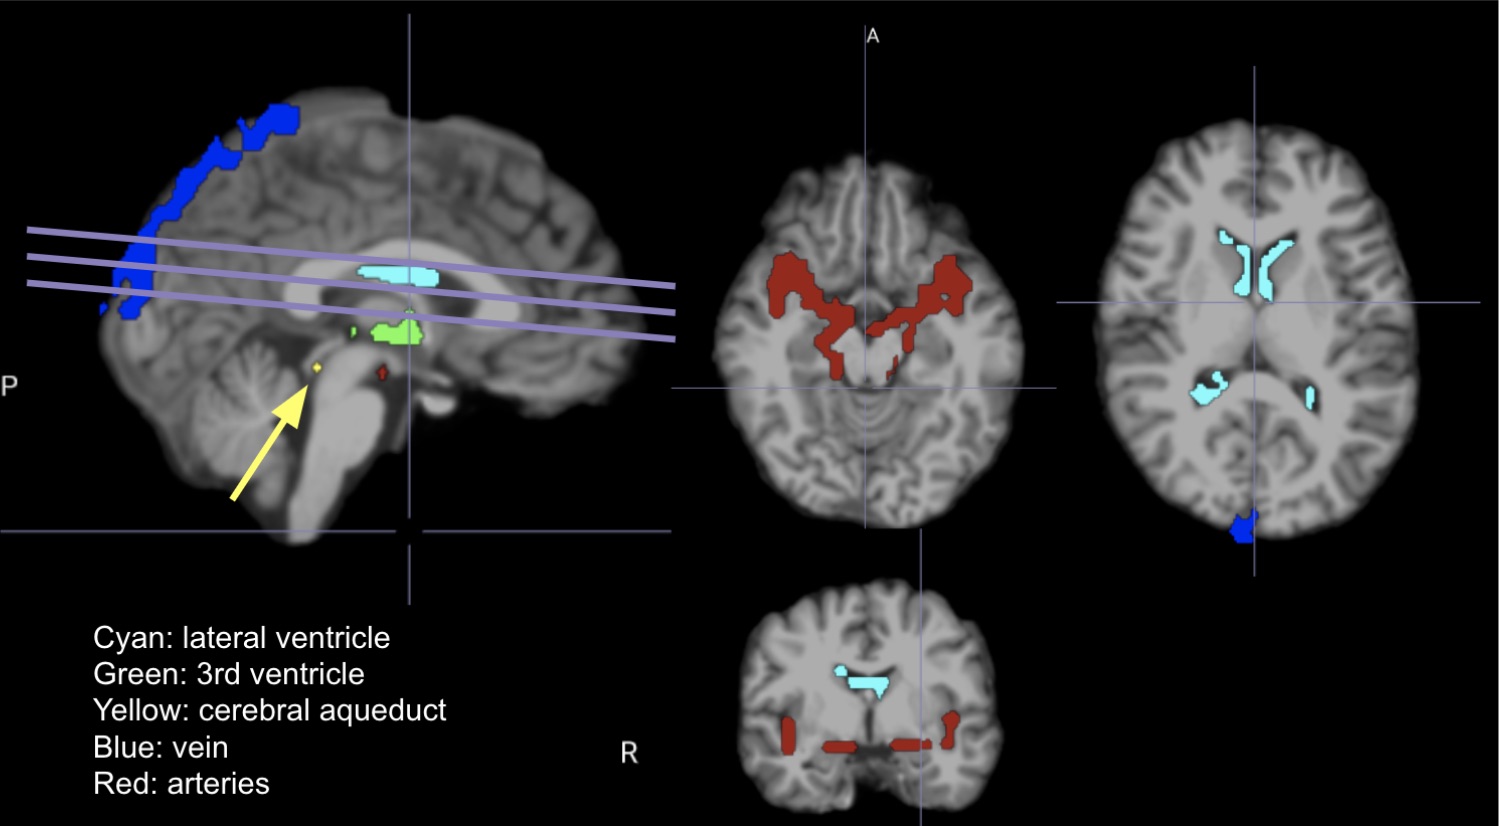
PPG: Signals were low-pass filtered to the bandwidth of the fMRI signal (1/TR~1.3 Hz). Then, each signal is normalized by subtracting the mean and dividing by the standard deviation. From here, 4 PPG-based parameters were derived: (1) low-frequency (0.05-0.15 Hz) PPG amplitude 4; (2) heart-rate variability 5; (3) acceleration PPG (SDPPG) 67; (4) Pulse intensity ratio (PIR) 8. Anatomical: FreeSurfer reconstruction was used to generate subject-specific CSF regions of interest (ROIs, i.e. lateral ventricles, third ventricle, cerebral aqueduct). In addition, we delineated ROIs related to major arteries, major veins, whole-brain grey matter and white matter. Sample ROIs are shown in Fig. 1. rs-fMRI: preprocessing includes motion correction, spatial smoothing and high-pass filter (> 0.001 Hz). As we are interested in physiological fluctuations, no nuisance regression was performed.
Statistical Analysis
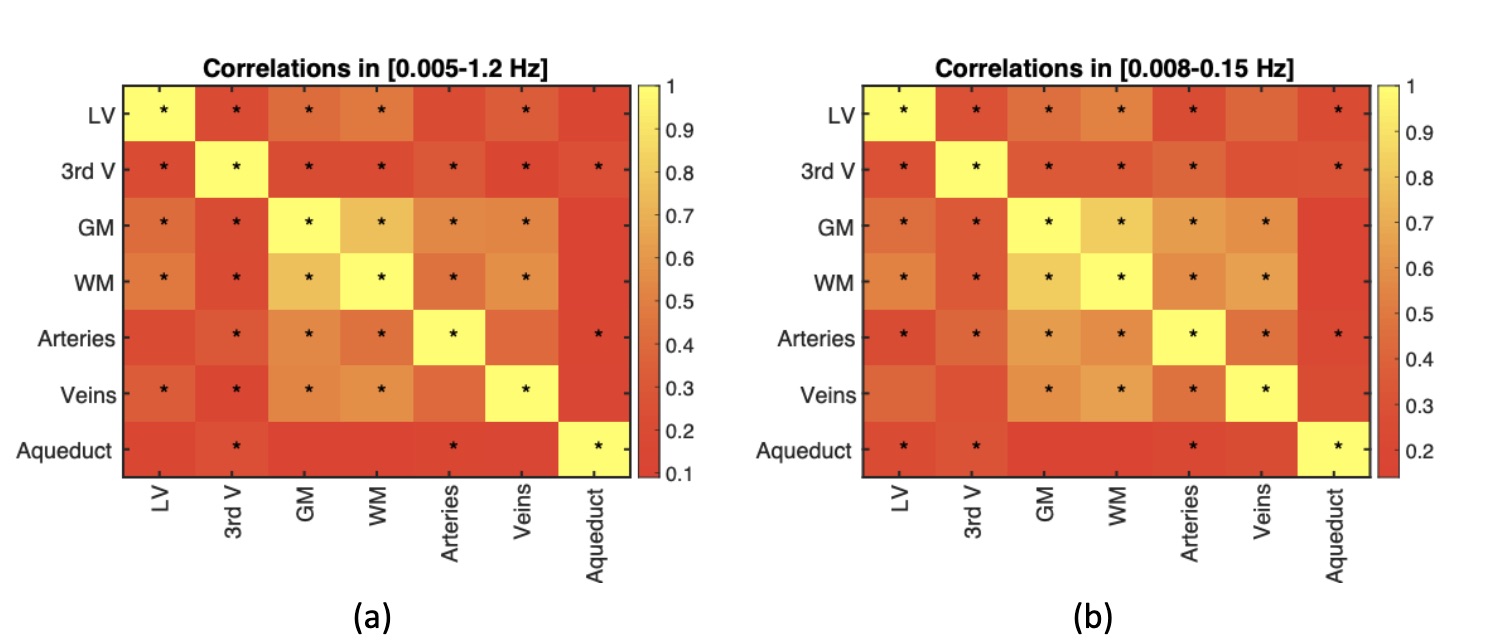
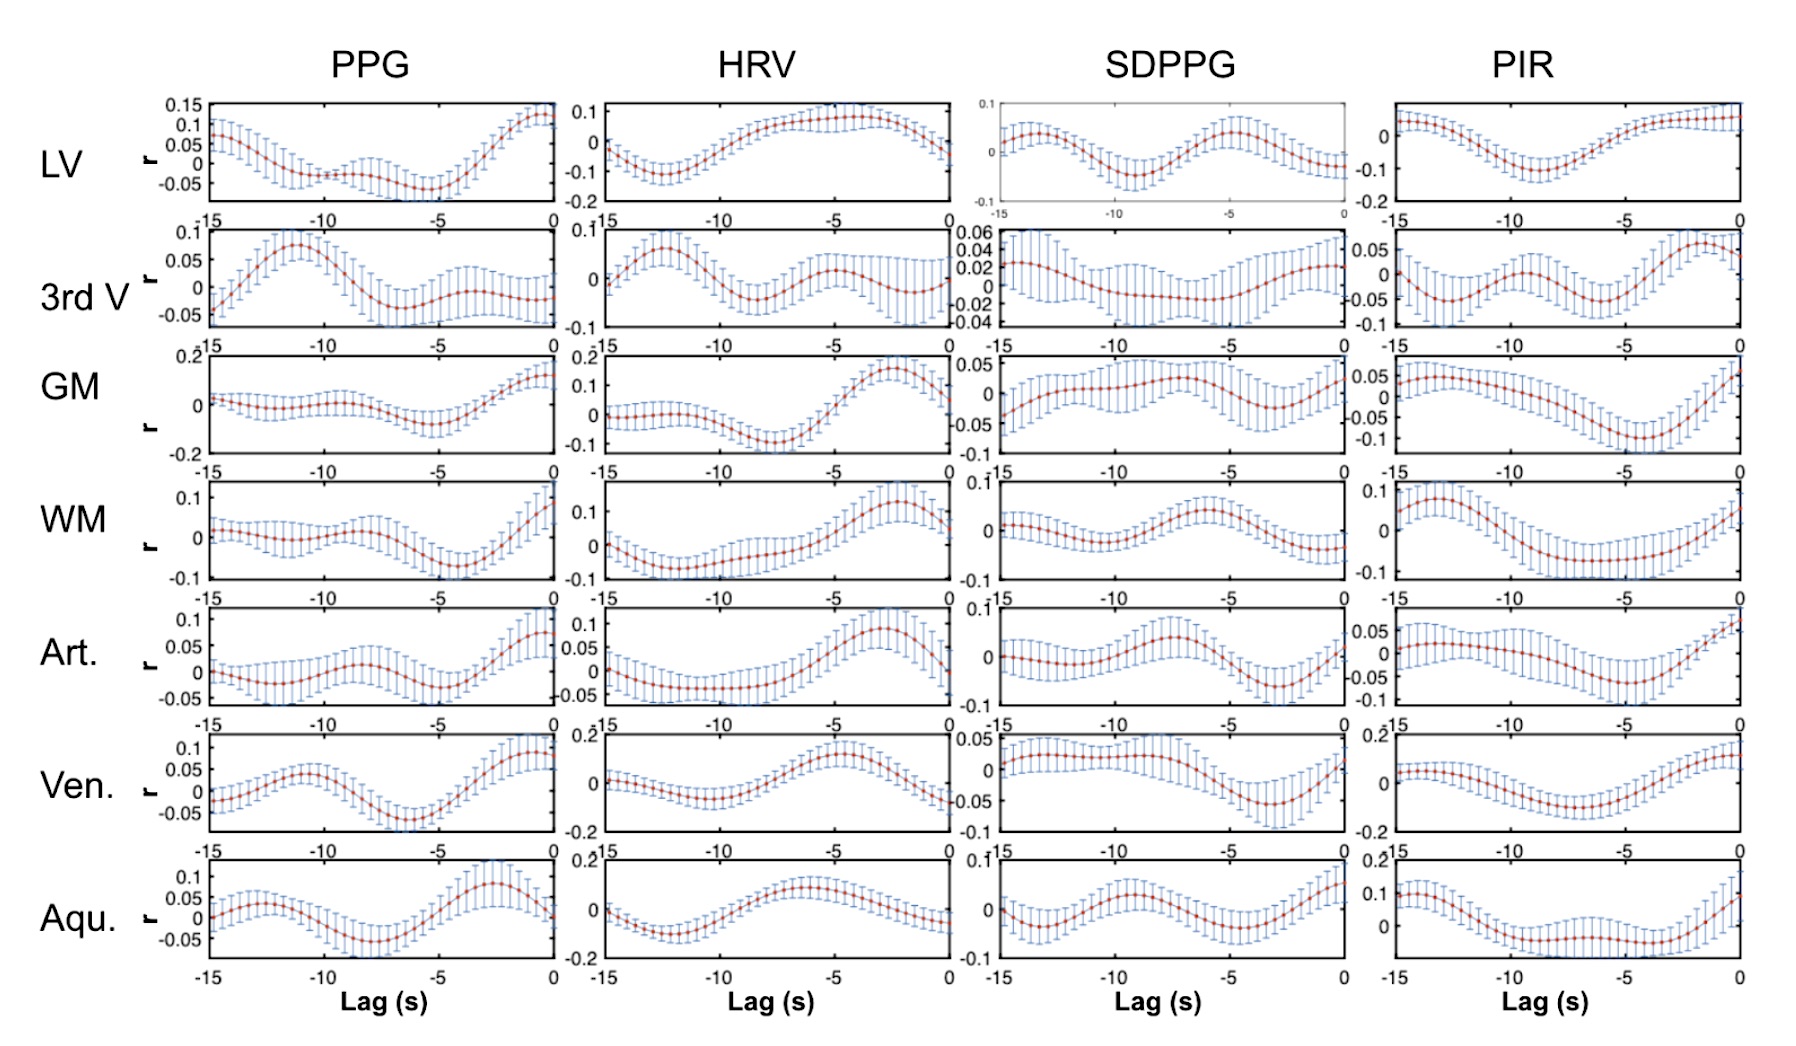
Correlation: to characterize the relationship between different fMRI ROIs and CSF ROIs, the Pearson correlation was computed between pairs of ROIs, with p-value corrected for multiple comparisons (p<0.05). Cross-correlation: to characterize the relationship between fMRI data in various ROIs and the PPG-based metrics in the 0.05-0.15 Hz frequency band, sliding-window cross-correlation was performed using window lengths of 342 s with a 90% inter-step overlap, focusing on negative lags (i.e. PPG leading rs-fMRI). Significance of the cross-correlations were determined using surrogate time series-based cross-correlation distributions 9, also corrected for multiple comparisons. Outliers amongst the sliding windows (> 2 stdev) were removed. Cross-spectral coherence: Cross-spectrograms between each rs-fMRI ROI time series and PPG-derived metric were calculated using the short-time Fourier transform, highlighting their shared frequencies. In this case, 125-s Hamming windows with a 90% inter-step overlap, focusing on frequencies between 0.001 and 1.3 Hz. The maximum-energy time-frequency ridges were determined by averaging three cross-spectral maxima along the frequency dimension, and these ridge locations were averaged to obtain the final time-frequency ridge frequency.
Results
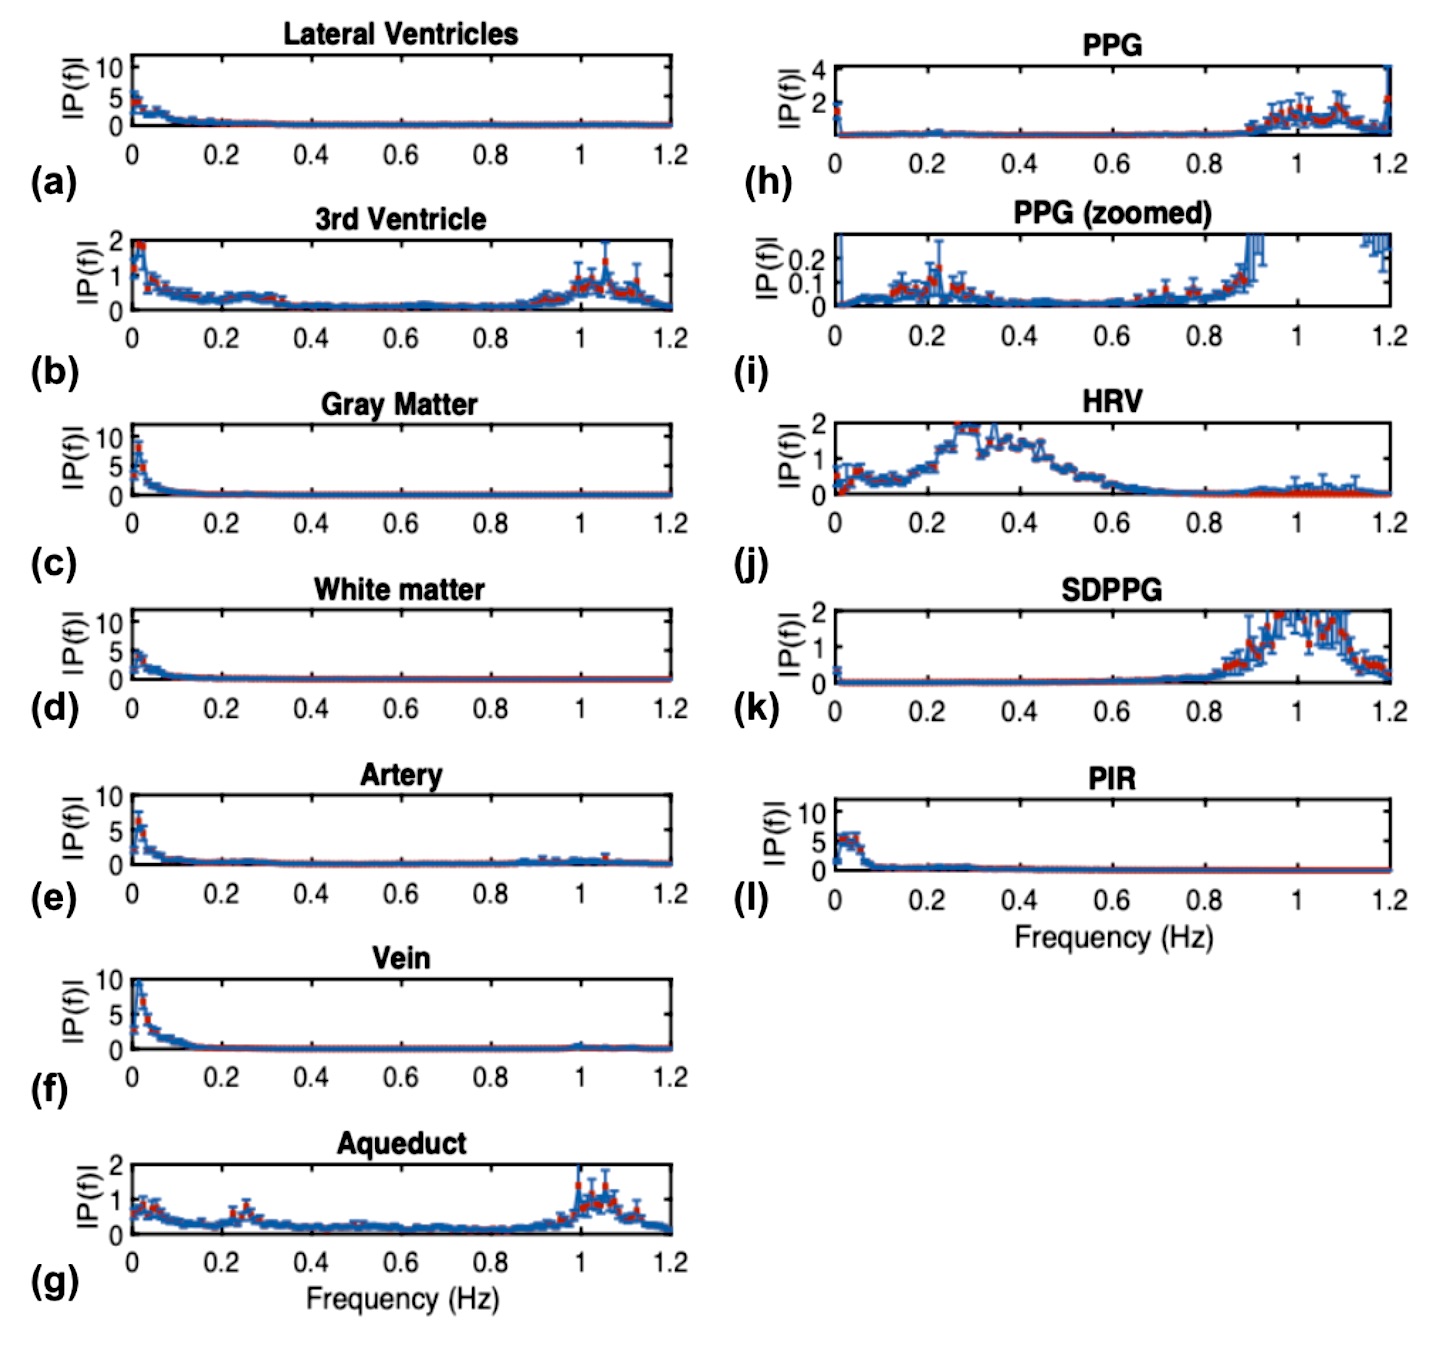
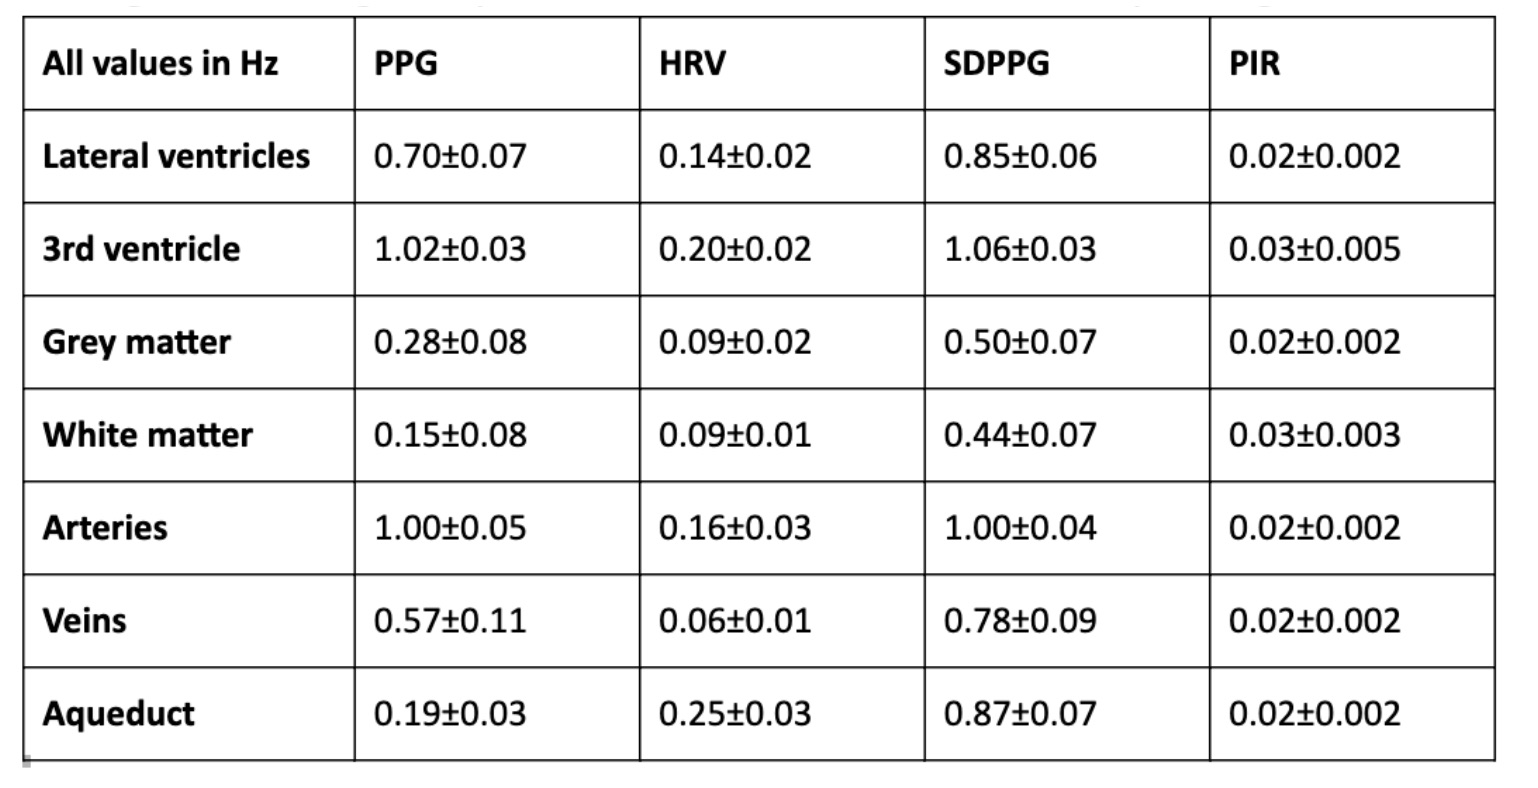
Group-average power spectra of the rs-fMRI time courses are shown for all ROIs in Fig. 2, and the inter-ROI correlations are shown in Fig. 3. The cross-correlation patterns between PPG-derived and rs-fMRI time series are shown in Fig. 4. The cross-spectral peak frequencies in each case are shown in Table 1. The main findings of this study are: (1) signals in different CSF regions (ROIs) are not equivalent in their vascular contributions or in their associations with vascular and tissue rs-fMRI signals; (2) the PPG signal is maximally coherent with the arterial and CSF rs-fMRI signals at the cardiac frequency, but coherent with brain tissue at ~0.2 Hz; (3) PIR is maximally coherent with the CSF signal near 0.03 Hz; (4) PPG-related vascular oscillations only contribute to ~15% of the CSF (and arterial) signal in rs-fMRI.Discussion
The rs-fMRI time courses in different CSF ROIs differ in part due to the fact that CSF in the lateral and third ventricles mainly flows along in plane rather than through plane direction in an axial acquisition. These findings caution the use of CSF as a monolithic region to be averaged over when extracting physiological nuisance regressors in rs-fMRI applications. Moreover, while HRV and low-frequency PPG share similar cross-correlation patterns with the CSF signal, their cross-spectral coherence patterns with CSF are very different. Furthermore, PIR likely offers information unavailable in the other PPG-derived metrics, particularly related to the lateral and third ventricles. They also pave the way for using rs-fMRI in the CSF as a potential tool for tracking cerebrovascular health.Acknowledgements
We thank the CIHR and NSERC for financial support.References
1. Julien, C. The enigma of Mayer waves: Facts and models. Cardiovasc. Res. 70, 12–21 (2006).
2. Caballero-Gaudes, C. & Reynolds, R. C. Methods for cleaning the BOLD fMRI signal. Neuroimage 154, 128–149 (2017).
3. Cauley, S. F., Polimeni, J. R., Bhat, H., Wald, L. L. & Setsompop, K. Interslice leakage artifact reduction technique for simultaneous multislice acquisitions. Magn. Reson. Med. 72, 93–102 (2014).
4. Strik, C., Klose, U., Erb, M., Strik, H. & Grodd, W. Intracranial oscillations of cerebrospinal fluid and blood flows: analysis with magnetic resonance imaging. J. Magn. Reson. Imaging 15, 251–258 (2002).
5. Chang, C. et al. Association between heart rate variability and fluctuations in resting-state functional connectivity. Neuroimage 68, 93–104 (2013).
6. Pilt, K. et al. New photoplethysmographic signal analysis algorithm for arterial stiffness estimation. ScientificWorldJournal 2013, 169035 (2013).
7. Attarpour, A., Mahnam, A., Aminitabar, A. & Samani, H. Cuff-less continuous measurement of blood pressure using wrist and fingertip photo-plethysmograms: Evaluation and feature analysis. Biomed. Signal Process. Control 49, 212–220 (2019).
8. Ding, X. et al. Pulse Transit Time Based Continuous Cuffless Blood Pressure Estimation: A New Extension and A Comprehensive Evaluation. Sci. Rep. 7, 11554 (2017).
9. Schreiber, T. & Schmitz, A. Improved Surrogate Data for Nonlinearity Tests. Physical Review Letters vol. 77 635–638 (1996).
Figures