2378
Water content for anatomical imaging with layer resolution at 7T1INM-4, Research Centre Juelich, Juelich, Germany, 2Faculty of Medicine, JARA, RWTH Aachen University, Aachen, Germany, 3INM-11, JARA, Research Centre Juelich, Juelich, Germany, 4Department of Neurology, RWTH Aachen University, Aachen, Germany
Synopsis
An increasing number of structural studies attempt identification of distinct structural regions based on their layer signature. Interestingly, water content quantitative contrast is little used in these attempts, despite being a fundamental contrast in MRI, based on the proton equilibrium magnetisation, and closely reflecting cell density on which modern cytoarchitectonic studies are based. In this contribution, we demonstrate the usefulness of water content contrast at 7T and propose it for layer-related studies and high-resolution brain anatomy.
Introduction
It is generally accepted that the cerebral cortex can be subdivided into structurally and functionally as well as neurochemically distinct cortical areas [1]. Cortical layers were found to differ by cell types, number or packing density of cells, density of myelinated fibers, and densities of various transmitter receptors [1]. These studies support the hypothesis of a correlated structural and functional subdivision of the cortex. Being able to characterize these areas based on both their structure and function in the same individual in vivo is one of the cherished goals of modern neuroscience. This would answer the question whether regions which are distinct from a cytoarchitectonic point of view also are different functionally and allow to study brain plasticity aspects in vivo. Ultra-high field systems play a unique role in this endeavor, as we are experiencing an increasing number of studies addressing function in vivo with cortical layer resolution (see [2] for a recent example). Correspondingly, an increasing number of structural studies attempt identification of distinct structural regions based on their layer signature (see [3] for a recent example). Interestingly, water content quantitative contrast is little used in these attempts, despite being a fundamental contrast in MRI, based on the proton equilibrium magnetisation, and closely reflecting cell density on which modern cytoarchitectonic studies are based. In this contribution, we demonstrate the usefulness of water content contrast at 7T and propose it for layer-related studies and high-resolution brain anatomy.Materials and methods
Measurements on three healthy male volunteers, 21-29 years of age, were conducted on a 7T Siemens Terra scanner using a birdcage transmit and a 32-channel receiver array. Dielectric pads were placed under the subject’s head to improve B1 distribution in the cerebellar area. For anatomical overview and cortical parcellation, an MP2RAGE [4] acquisition with 0.5mm isotropic resolution was performed (TR=4360ms, TI1/TI2=840/2370ms, TE=2.08, flip angle1/2=5/6deg, TA=10:46 min) and UNI as well as T1 images reconstructed [4]. For water content mapping, two multiple-echo GRE acquisitions (12-echo mGRE) were performed using a 3D “long TR” method [5], with TA=12:42s per scan. For TR=42ms, a flip angle of only 3deg was employed, avoiding T1 saturation effects in brain tissue. The nominal resolution was 0.5mm isotropic, however one of the acquisitions had 75% slice encoding resolution, the other 75% phase encoding resolution, for an acquisition time of 10:42min per scan. In addition, a 9-echo 3D mGRE with resolution of 0.4x0.4x0.3 mm3 and matrix size 400x312x144 (TR=42ms, TA 8:58 min per scan) was used for mid-brain imaging and repeated 3 times. The two 0.5mm isotropic resolution were averaged, R2* mapping was performed and the extrapolated intensity at TE=0 was inhomogeneity corrected. Following normalization to CSF, assumed to have a T1=4.2s field-independent, water content maps were produced. Brain parcellation was performed using the MP2RAGE contrasts according to the Destrieux atlas implemented in Freesurfer [6]. The information was transferred to the space of the quantitative maps using ANTs registration. The quantitative maps used were H2O, R2*, QSM (using the phase of the 3D water mapping acquisition) and T1 from MP2RAGE. Mean values of the quantitative parameters were calculated for each ROI. Surfaces at the pial and WM-GM border were defined and signal intensity was plotted as a function of cortical depth. For comparison to the 7T quantitative results, three age and gender-matched volunteers were selected from subjects measured with a quantitative protocol at 3T within the 1000Brains study [7-9]. Water content, T1, R2* and QSM values were compared between fields for each cortical region.Results and Discussion
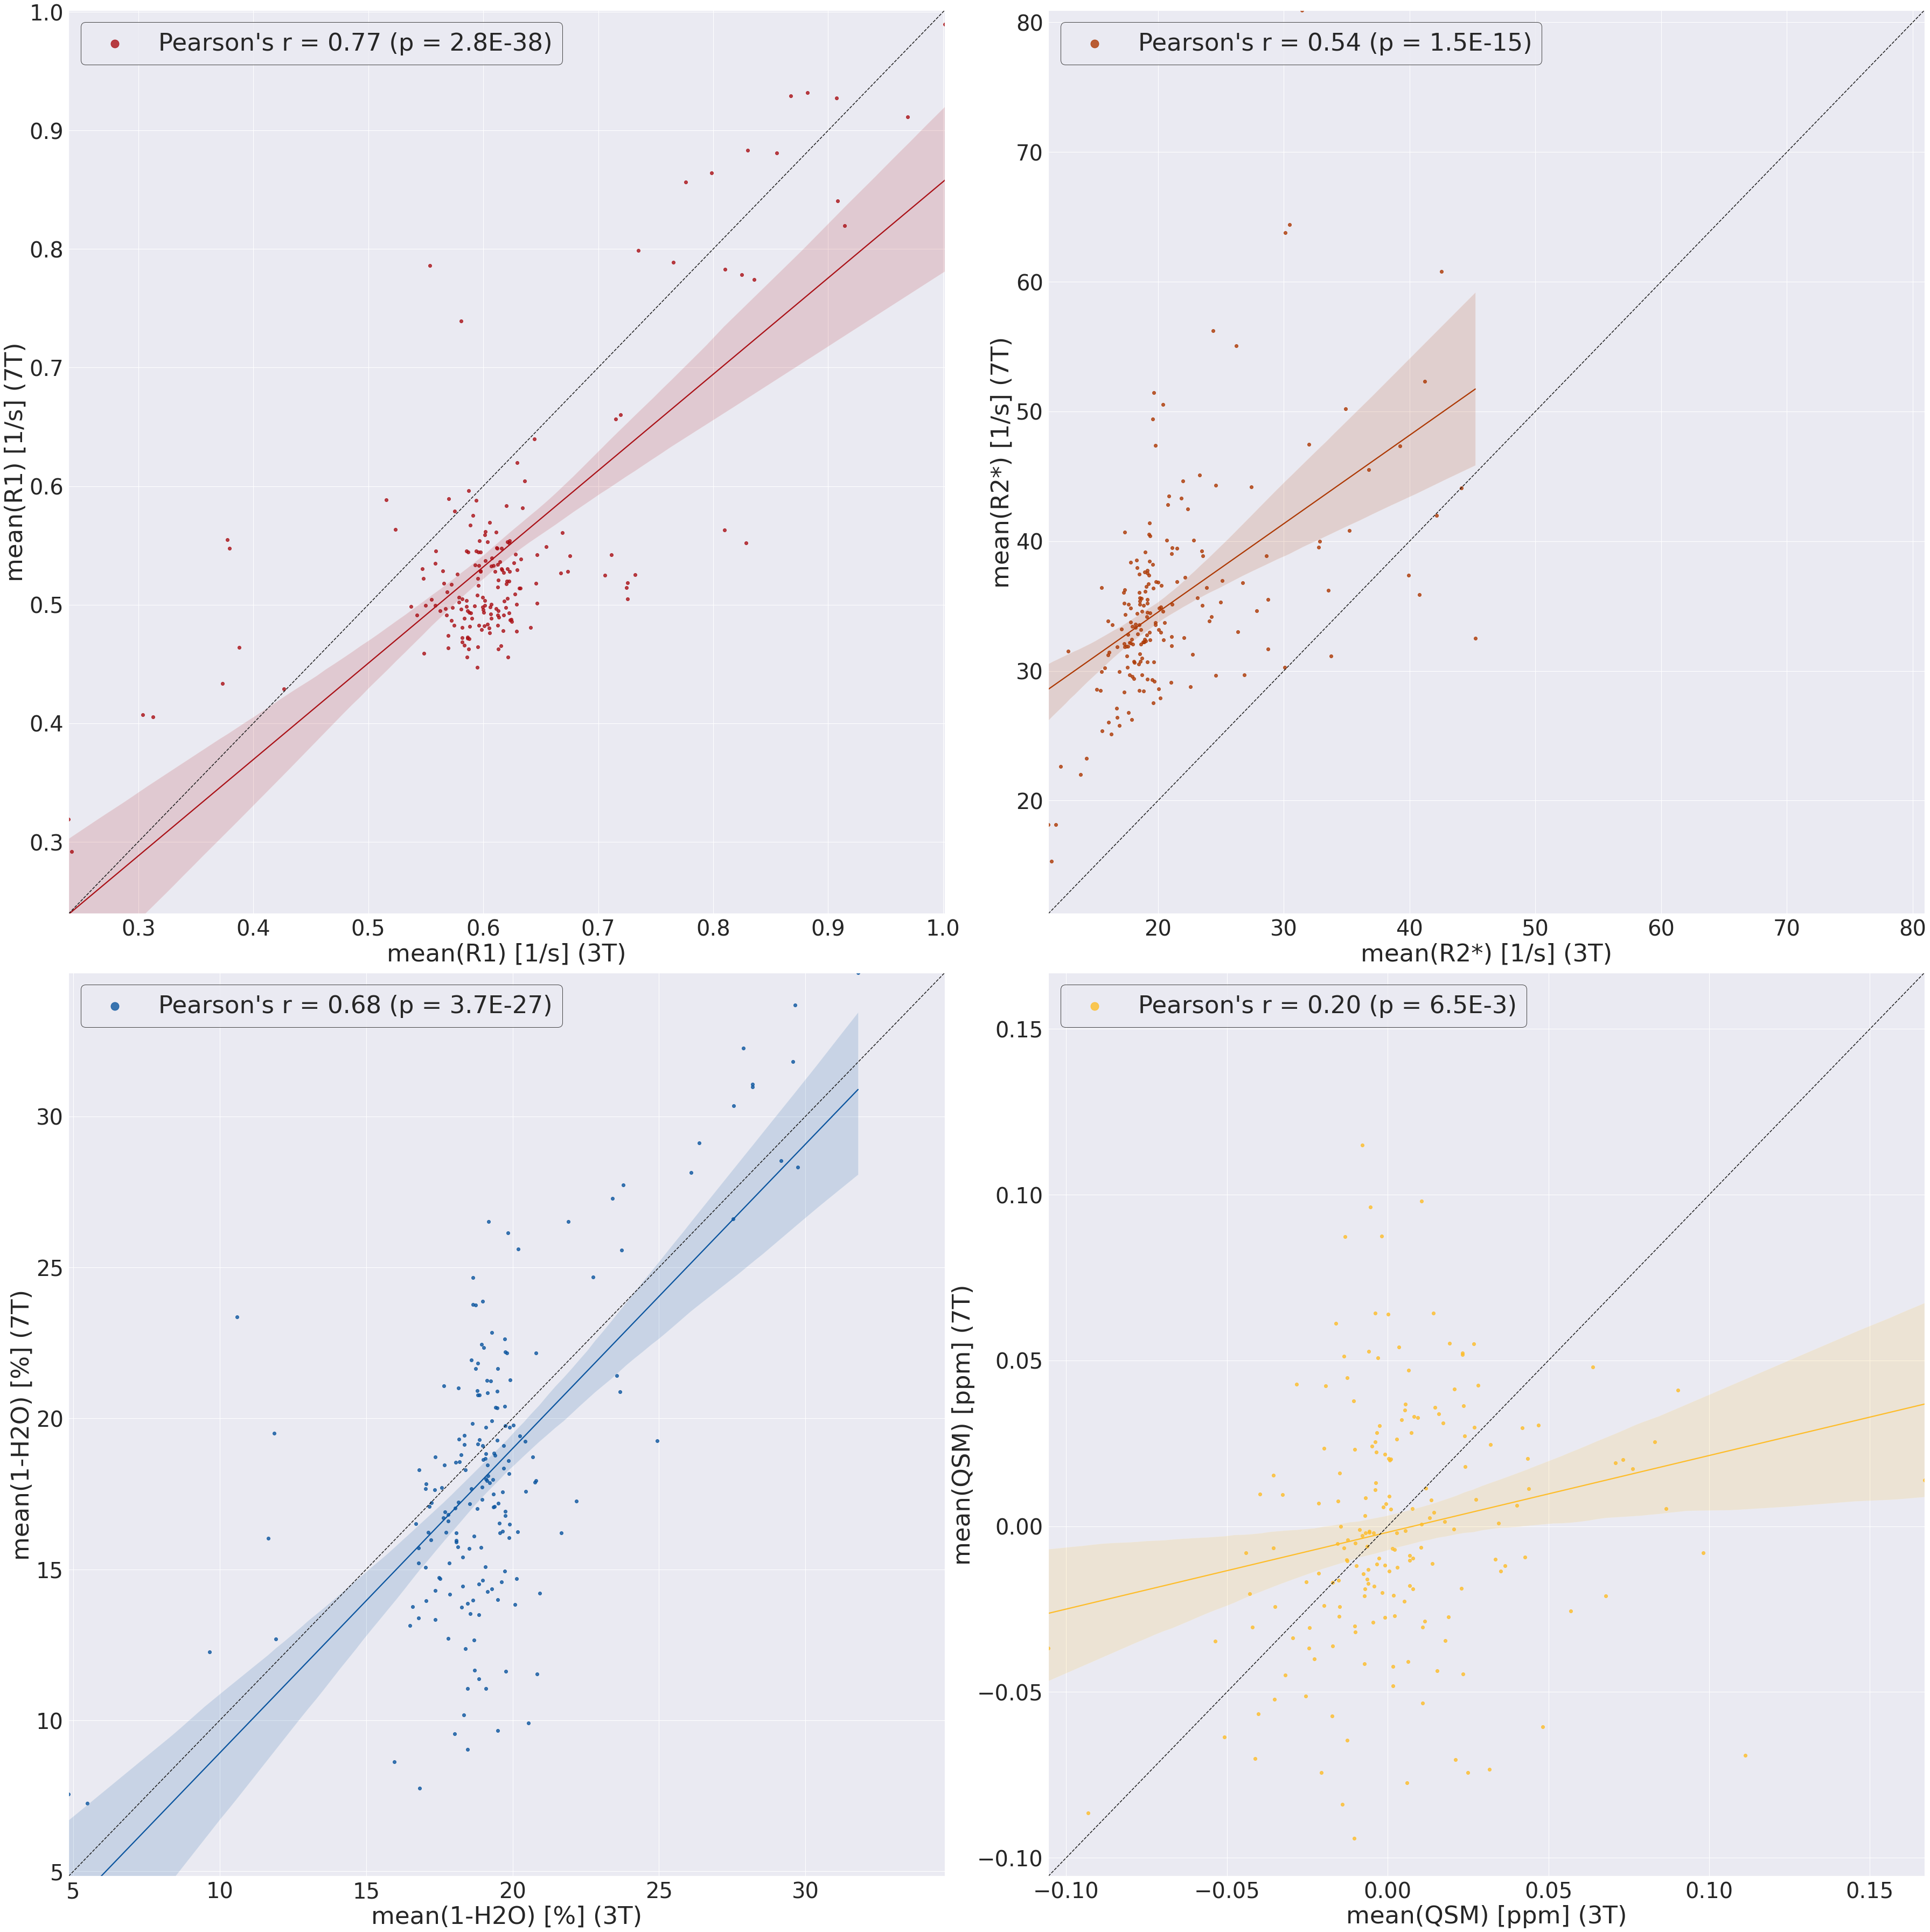
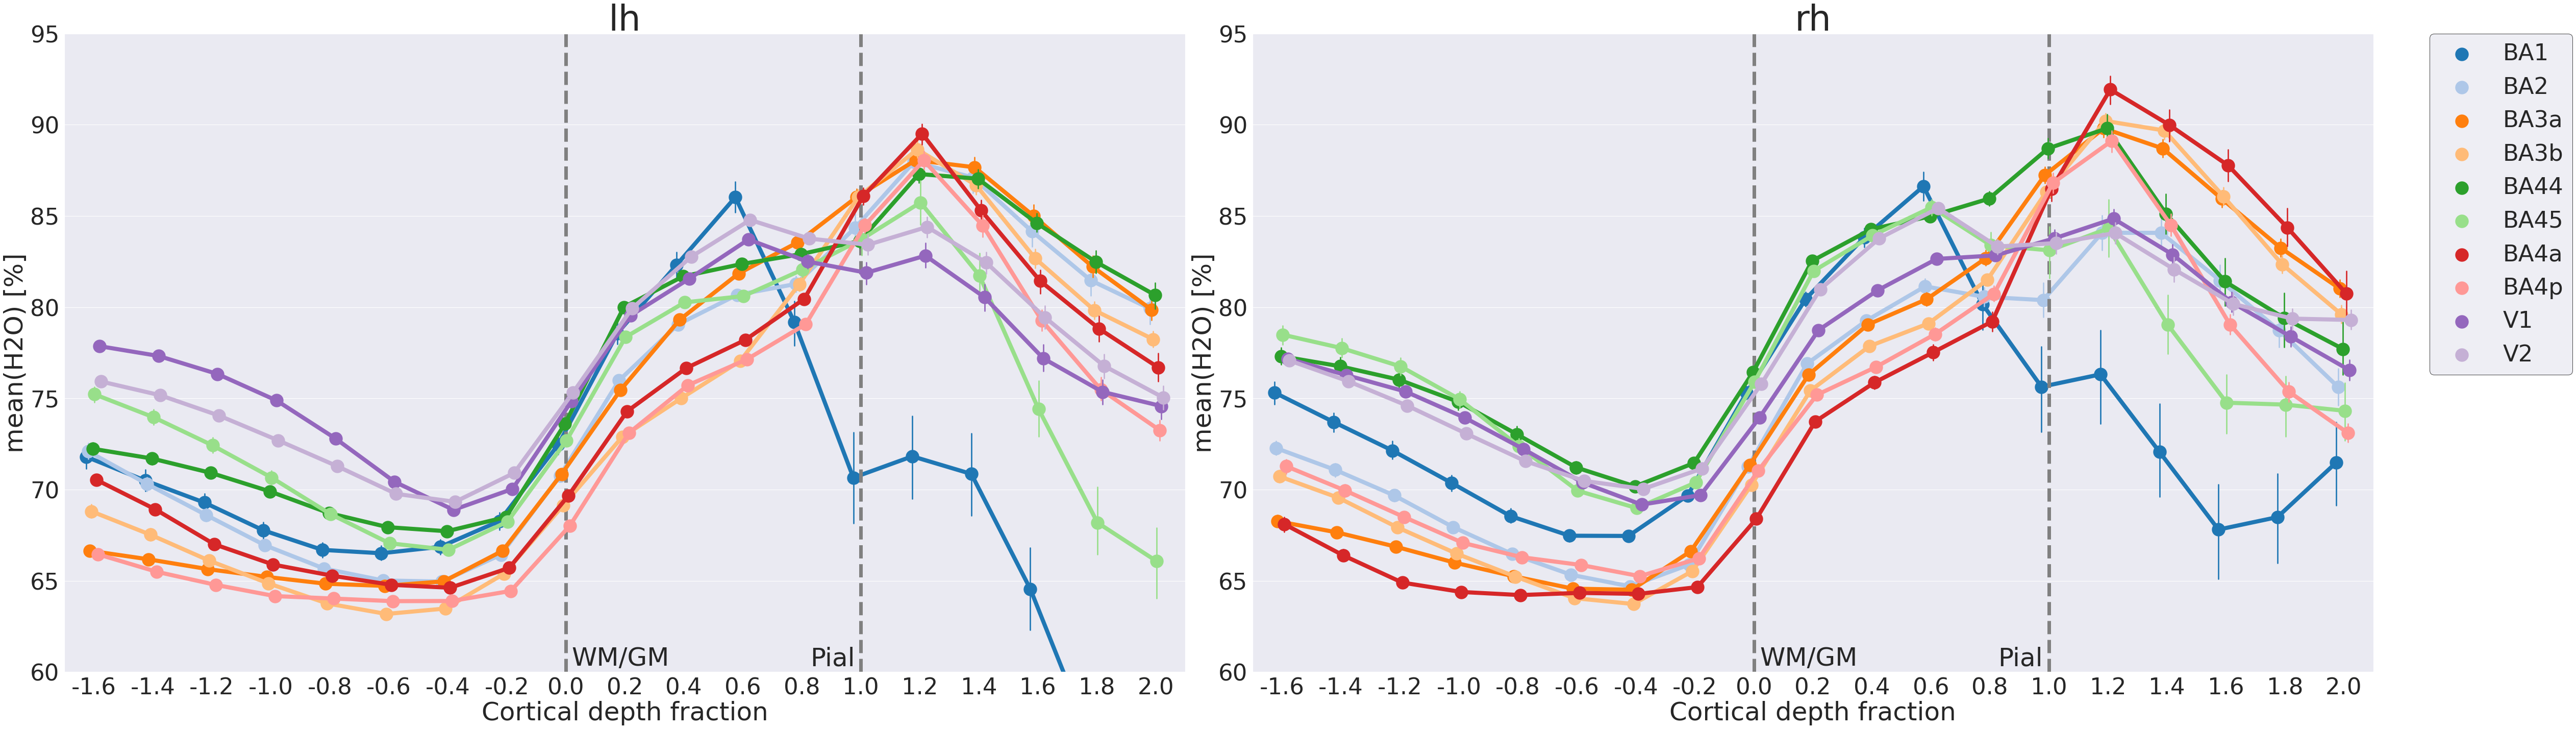
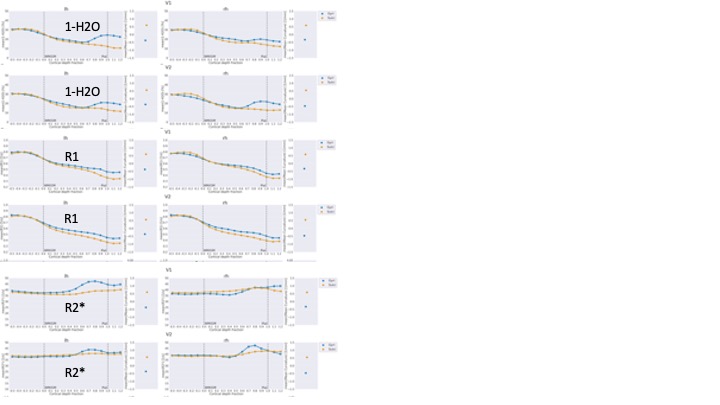
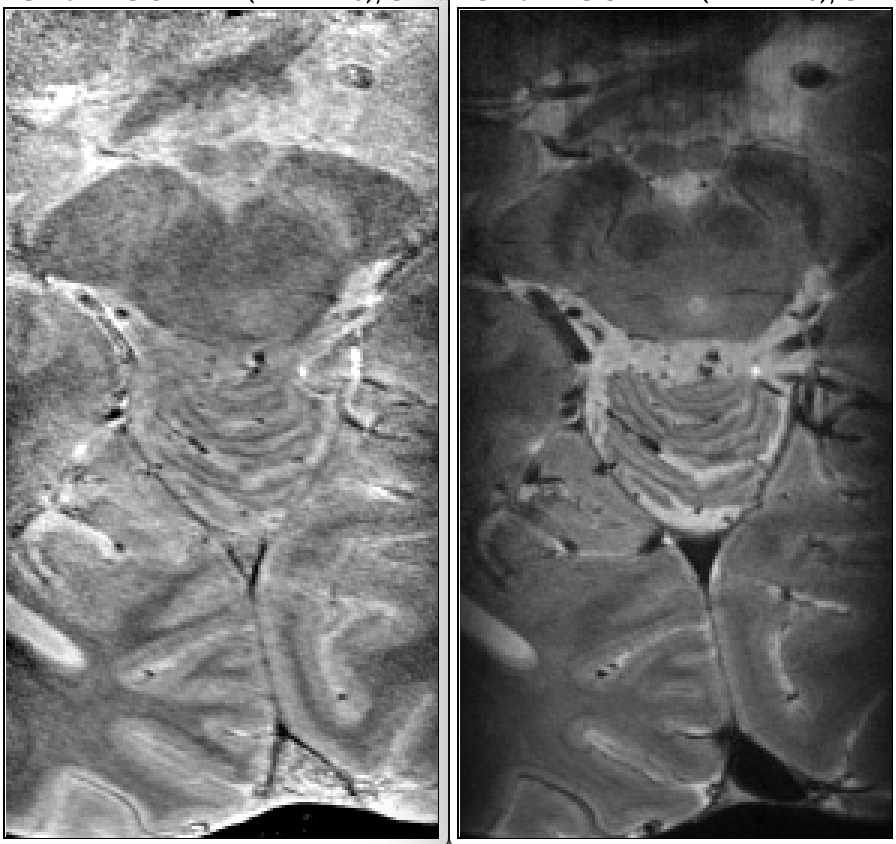
Fig. 1 shows good correlation between the quantitative parameters at 3T and 7T. R1 and R2* are known to depend on field strength [7,8], whereas water content and QSM should not. Increased SNR at 7T and higher resolution (16 times smaller voxel volume than at 3T) does allow better differentiation of details of water distribution. However, high-field specific effects, such as orientation dependence of various quantities, can contribute. In Fig. 2, profiles of water distribution through the cortex are shown, also extending into the white matter (negative cortical depth). The presence of U-fibres can be inferred from the lower water content values at the WM-GM border. Area-specific profiles can be recognized. Fig. 3 shows a comparison of cortical profiles of 1-H2O, R1 and R2* in the areas V1 and V2, separately plotted for gyral and sulcal areas (the latter containing the border between V1 and V2). Each parameter has a different behavior, and water content is seen to be as specific to layer structure as R2*, with a more pronounced behaviour than R1. Finally, Figure 4 shows complementary contrast in water content (left) compared to heavily weighted T2* (right) in substantia nigra and cerebellum. The two contrasts are obtained simultaneously from the same scan and are intrinsically coregistered. In conclusion, high-resolution water content mapping at 7T has the potential to contribute to layer-based characterization of the cortex and can be used to study brain anatomy.Acknowledgements
No acknowledgement found.References
[1] K. Zilles and N. Palomero-Gallagher 2017. Front. Neuroanat., 20 September 2017 | https://doi.org/10.3389/fnana.2017.00078
[2] Huber, Laurentius et al. 2020. “Sub-Millimeter FMRI Reveals Multiple Topographical Digit Representations That Form Action Maps in Human Motor Cortex.” NeuroImage 208: 116463.
[3] P. McColgan et al, 2020. Relating quantitative 7T MRI across cortical depths to cytoarchitectonics, gene expression and connectomics: a framework for tracking neurodegenerative disease. bioRxiv 2020.02.05.935080; doi: https://doi.org/10.1101/2020.02.05.935080
[4] J Marques et al Neuroimage 2010; 49(2):1271-81.doi: 10.1016/j.neuroimage.2009.10.002.
[5] A.M. Oros-Peusquens et al, Proc ISMRM 2020.
[6] http://surfer.nmr.mgh.harvard.edu/, Freesurfer version 6.0.0
[7] Caspers S, Moebus S, Lux S, Pundt N, Schutz H, Muhleisen TW, Amunts K (2014) Studying variability in human brain aging in a population-based German cohort-rationale and design of 1000BRAINS. Front Aging Neurosci 6:149
[8] Schall, Melissa et al. 2020 Increasing body mass index in an elderly cohort: Effects on the quantitative MR parameters of the brain. J. Magn. Reson. Imaging 51:514–523.
[9] Iordanishvili E, Schall M, Loução R, Zimmermann M, Kotetishvili K, Shah NJ, Oros-Peusquens AM. Quantitative MRI of cerebral white matter hyperintensities: A new approach towards understanding the underlying pathology. Neuroimage. 2019 Nov 15;202:116077. [
10] Oros-Peusquens et al, MAGMA 2008.
Figures