2375
Effect of white matter hyperintensities on tractometry and its relationship with white matter connectivity1University of Pittsburgh, Pittsburgh, PA, United States
Synopsis
The effect of white matter hyperintensities (WMHs) on 50 major WM tractometries was investigated. Elevated WMHs load on white matter tract was associated with lower apparent fiber density (AFD) on tractometery, showing the co-localization of WMH with AFD change. Reduced AFD is associated with lower connectivity of the WM tract. Differences in these metrics between lower WMH and higher WMH groups, and between lower WMH and MCI groups are significant. Moreover, AFD is lower in individuals with MCI, supporting a role of white matter microstructure in cognitive decline.
INTRODUCTION
White matter hyperintensities (WMHs) are frequently observed in elderly brain MRIs and are strongly associated with age-related cognitive decline1. WMHs reflect the macrostructural damage in white matter (WM) and may disrupt tracts traversing the lesions. Although the voxel-wise microstructural features of WMH regions have been well-characterized using standard diffusion tensor metrics2, the effect of WMH on tractometry measures of fiber density and cross-sectional area (as strength of connectivity) of major WM pathways across the brain have not been assessed. In this study, we compared the apparent fiber density (AFD) and connectivity in controls (dividing into lower and higher WMH) and mild cognitive impairment (MCI) groups.METHODS
Total of 65 participants (ages: 67.4 ± 8.3 years, 44 females, 49 normal controls and 16 MCIs) were studied at 3T (Siemens, Prisma) using a 64-channel head coil. 3D T1-weighted (TR/TE = 2400/2.22 msec, TI = 1000 msec, FA = 8°, voxel size = 0.8 mm isotropic) and 2D FLAIR (TR/TE = 9690/91 ms, TI = 2500ms, voxel size = 0.8 x 0.8 x1.6 mm3) images were acquired. Total 4 sessions of diffusion MRI were acquired using spin-echo EPI with TR = 3230 ms, TE = 89.20, voxel size = 1.5 mm isotropic, number of slices = 92 with no gaps, multiband acceleration factor = 4; 98 and 99 diffusion‐weighted directions were both acquired twice with reversed phase encoding direction in order to correct for the EPI geometric distortion.The WMH regions were automatically segmented from the FLAIR and T1-weighted images using a deep learning algorithm based on deep fully convolutional network and ensemble models3. Preprocessing of diffusion-weighted images included denoising of data, eddy-current correction, motion correction, and bias field correction. For each voxel, the fiber orientation distribution (FOD) was computed using multi-shell, multi-tissue constrained spherical deconvolution with group-averaged response function .4,5 The group response functions were acquired from 30 control subjects using the dhollander algorithm6. The apparent fiber density (AFD) was computed from the FOD, and total AFD was calculated by summing fiber population within each voxel. 50 white matter fiber tracts were automatically segmented by TractSeg program7. Segmentations of the start/end regions of bundles, bundle segmentations, and tract orientation maps (TOMs) were acquired. Bundle-specific tractography was automatically segmented by probabilistic tracking on the estimated TOMs8. AFD tractometry was performed by averaging AFD in each segment for 100 equally distant centroid segments/points along streamline9. WMH tractometry was also similarly acquired from the profile of WMH mask along each tractography. The AFD tractometries of the lower and higher controls and MCI groups were compared to evaluate the WMH effect on AFD tractometry. The t-statistic for each segment/point in the tractometry was calculated between lower and higher WMH groups and between lower WMH and MCI groups. The connectivity strength of tractometry was quantified as a cross-sectional area of fibers, by calculating the AFD volume of the pathway of interest divided by the streamline length.RESULTS
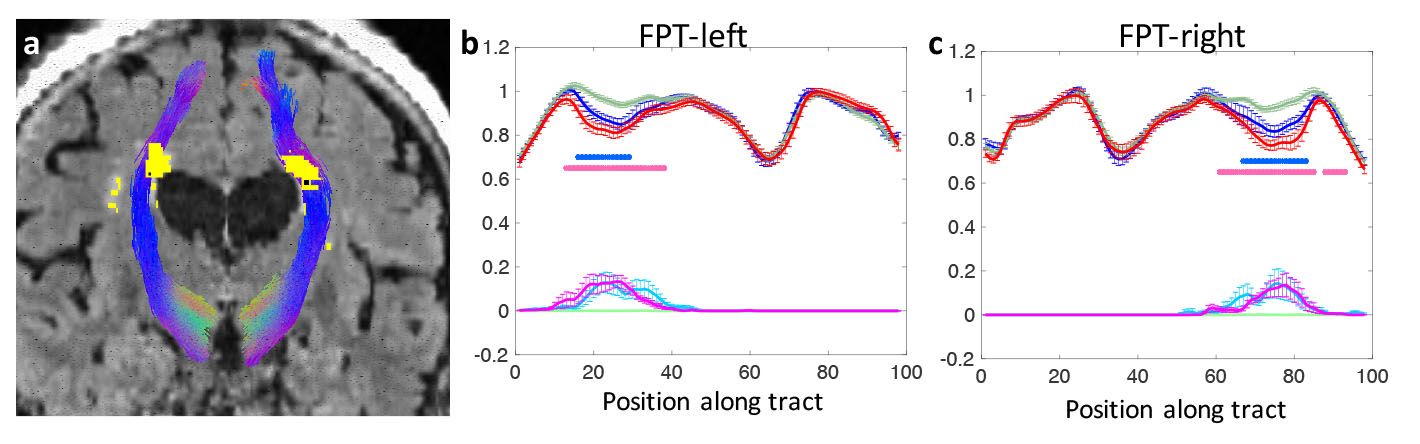
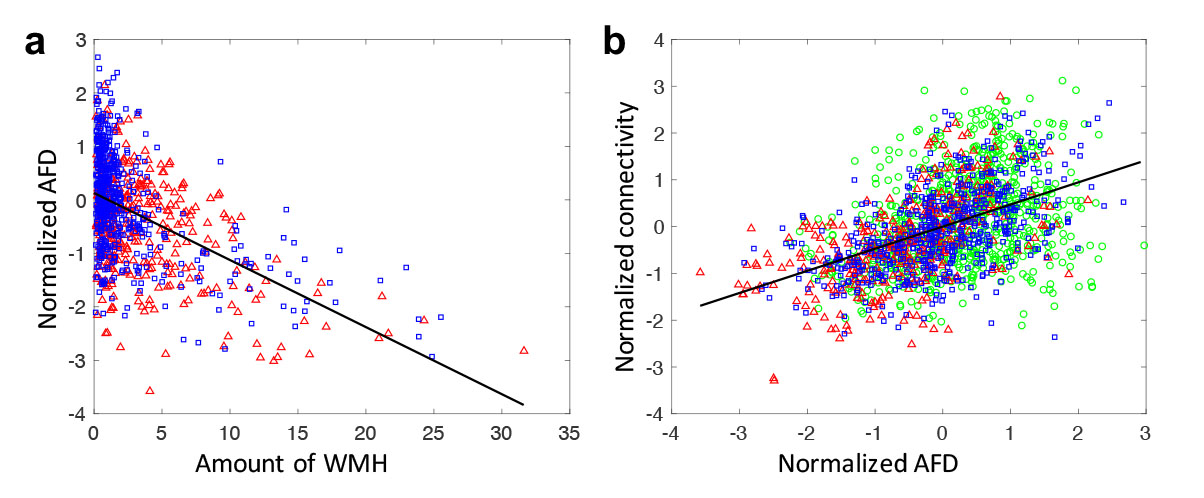
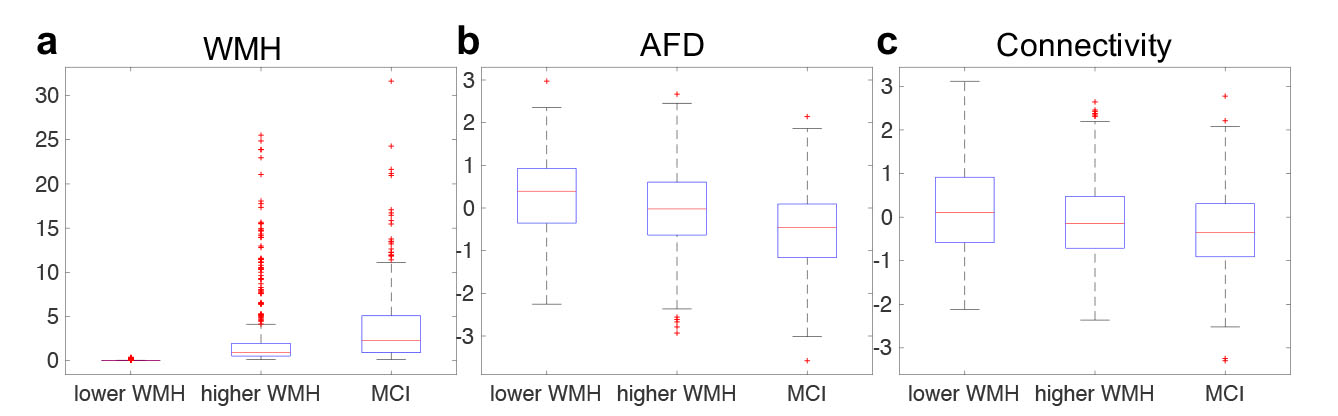
Fig. 1a demonstrates the WMH segmentation on fronto-pontine tract overlaid on a FLAIR image. Fig. 1b and 1c shows the group-averaged tract-profiles of AFD for lower (green) and higher WMH (blue) and MCI (red) groups. AFD profiles were statistically different at the location of WMH between lower WMH and higher WMH groups and between lower WMH and MCI groups (p < 0.05, asterisk marks). It indicates WMH in tracts decreases the AFD. Similar results were observed in the other 48 tracts.Fig 2a shows the relationship between the amount of WMH and normalized mean AFD of tractometry across subjects. Increased WMH on the tract reduced AFD in tractometry. Fig. 2b shows that the reduced mean AFD of tractometry is highly associated with decreased connectivity strength of the tract (p < 0.0001). The indirect pathway between WMH and connectivity through the AFD (as a mediator) showed statistical significance in mediation analysis10 (p < 0.001). It indicates that the higher WMH burden induces the lower strength of the structural interconnection of the WM tract connecting distant brain regions.The group differences of WMH, AFD, and connectivity were assessed. Differences between groups was statistically significant for each comparison across all groups (p < 0.0001, Fig. 3). The WMH load on tracts can be a significant role in decrease of WM connectivity that may be associated with progression of cognitive decline.
DISCUSSION
WMH lesions may contribute to local microstructural damage and increase disruption of subcortical and cortical connections. It might be detrimental to cortical gray matter integrity and be responsible for cognitive decline. Thus, assessing the effect of WMH on WM connectivity can be helpful to better understand the inter-relationship of the multiple pathological changes that occur in the elderly leading to cognitive alteration.CONCLUSION
WMH load is an important factor for the brain connectivity. Thus, the effect of WMH should be considered when comparing the WM connectivity between groups in diffusion tractography.Acknowledgements
This work was supported by the National Institutes of Health (UF1-AG051197).References
1. Prins ND, Scheltens P, White matter hyperintensities, cognitive impairment and dementia: an update. Nat Rev Neurol 2015 Mar;11(3):157-65
2. Maniega SM et al. White matter hyperintensities and normal-appearing white matter integrity in the aging brain. Neurobiol Aging. 2015 Feb;36(2):909-18.
3. Li H et al. Fully convolutional network ensembles for white matter hyperintensities segmentation in MR images. Neuroimage. 2018 Dec;183:650-665
4. Tournier JD et al. Direct estimation of the fiber orientation density function from diffusion-weighted MRI data using spherical deconvolution. Neuroimage. 2004 Nov;23(3):1176-85
5. Tournier JD et al. Robust determination of the fibre orientation distribution in diffusion MRI: non-negativity constrained super-resolved spherical deconvolution. Neuroimage. 2007 May 1;35(4):1459-72
6. Dhollander T. Accuracy of response function estimation algorithms for 3-tissue spherical deconvolution of diverse quality diffusion MRI data. Proceedings of the 26th annual meeting of the International Society of Magnetic Resonance in Medicine (2018), pp. 1569
7. Wasserthal J et al. TractSeg - Fast and accurate white matter tract segmentation. Neuroimage. 2018 Dec;183:239-253.
8. Wasserthal J et al. Combined tract segmentation and orientation mapping for bundle-specific tractography. Med Image Anal. 2019 Dec;58:101559
9. Wasserthal J, Maier-Hein KH, Neher PF, Northoff G, Kubera KM, Fritze S, Harneit A, Geiger LS, Tost H, Wolf RC, Hirjak D. Multiparametric mapping of white matter microstructure in catatonia. Neuropsychopharmacology. 2020 Sep;45(10):1750-1757.
10. Preacher KJ, Hayes AF. Asymptotic and resampling strategies for assessing and comparing indirect effects in multiple mediator models. Behav Res Methods. 2008 Aug;40(3):879-91.
Figures