2370
Perfusion and free water show opposite trends across tissue layers surrounding white matter hyperintensities in elderly participants1Neurology, University of California Davis, Davis, CA, United States, 2Biomedical Engineering, University of California Davis, Davis, CA, United States
Synopsis
We investigated white matter (WM), cerebral blood flow (CBF) and free water content (FW) in the penumbra region surrounding white matter hyperintensities (WMH) in elderly participants. The tissue surrounding WMH clusters were defined as four 1mm concentric layers and compared to WM and WMHs. The findings of this study reveal that WMHs and adjacent layers have lower CBF than healthy WM and CBF increases from lower layers to higher layers. The opposite associations were found with FW.
Introduction
WMHs are known to increase with age1 and are associated with an increased probability of cognitive impairment2. While WMHs have been associated with vascular disease2, the vascular and physiological basis of WMHs remain unclear. Recently, we evidenced using Diffusion Tensor Imaging (DTI) that WMHs are surrounded by a penumbra reflecting subtle white matter (WM) injury. In this context, new imaging biomarkers are needed to understand the cascade of events leading to the development of WMHs. Cerebral blood flow (CBF) is derived from pulsed arterial spin labeling (ASL), a non-invasive magnetic resonance (MR) technique, and reflects the delivery of blood to capillary beds. Free water (FW), a diffusion tensor imaging (DTI) derived measure, reflects the amount of extracellular water in the brain3 and has been shown to be a sensitive biomarker of WM integrity in association with cognition4,5. The present study aims to investigate changes in both FW and CBF in WMHs and their penumbra in elderly participants.Methods
A total of nineteen participants (ages 66-97, 8 female) from the Alzheimer's Disease Research Center cohort at the University of California, Davis were included in this study. 4 participants were diagnosed with mild cognitive impairment, 1 with dementia, and 13 participants were cognitively normal. Fluid-attenuated inversion recovery, diffusion tensor imaging, and ASL (TR/TE: 4000/13ms, voxel size: 4x4x10mm3) images were acquired on a 3T Siemens Scanner with an 8-channel coil. CBF maps were calculated using the FMRIB software library6,7 from 60 averaged single delay, pulsed ASL-MR images (inversion time = 1800ms). FW-corrected maps were computed from DTI using previously described algorithms8,7. Maps of WMHs were produced from fluid-attenuated inversion recovery and T1-weighted images using a standardized WMH detection protocol9. Segmentation of GM and WM was performed in native space T1-weighted images by an in-house computer program using a Bayesian maximum likelihood expectation-maximization algorithm10. CBF and FW maps were co-registered to structural space.For each participant, individual WMHs were identified. These individual WMH were then dilated by 1mm to create 4 layers surrounding the core of the lesion (Figure 1). The layers did not overlap and were constrained to the WM. The distribution of CBF and FW was evaluated in 7 different regions of interest (ROI): GM, normal-appearing WM, WMH cores, and WMH surrounding tissue layers 1-4. For each biomarker (CBF and FW), linear mixed-effect models of mean FW or CBF values were used to compare (1) WM to WMHs and their surrounding layers (2) WMHs to their surrounding layers (lme411 in R software). All models specified individual lesions per participant as a nested random effect and age as a random effect. Lesions with at least 10 voxels were included in the analysis.
Results
Across all patients and clusters, WMHs tended to have lower CBF values compared to surrounding tissue and CBF values increased from layers 1 to 4 (Figure 2A, top panel). The distributions of layers 1-4 resembled that of the WMH but not of WM or GM (Figure 2A, bottom panel). FW showed the opposite trend; higher FW values in the WMH and decreasing values from layers 1 to 4 (Figure 2B, top panel). The spread of FW for layers 2-4 resembled the WM (Figure 2B, bottom panel). These trends are consistent across individual subjects (Figure 3).The mixed-effects model showed significantly lower mean CBF values of WMH and Layers 1-4 than the reference WM (Figure 4A). The second model for CBF also showed significant CBF reduction of layers 2-3 (main effects) compared to WMH but not layer 1 (Figure 4B). Figure 5A reveals a significant increase of mean FW in WMH and layer 1, but not for layers 2-4 when compared to the WM reference. Mean FW was significantly higher in WMH compared to Layers 1-4 (Figure 5B).
Discussion and Conclusion
This study provides evidence of decreased CBF and increased FW within the WMH penumbra region. Our findings with CBF support results from previous studies suggesting that PASL-MR can detect decreased perfusion in layers closer to the WMH 12,13. Importantly, our findings also reveal that extracellular water, as reflected by FW, was found to be particularly sensitive to subtle changes around lesions. Both FW and CBF measures appear to provide complementary information to better understand the aging-associated mechanisms of WM degeneration leading to the development of WMH.Acknowledgements
This work is supported by NIH grant 4R00NS102884-03. The authors would like to thank the Alzheimer’s Disease Research Center clinicians and staff for their support in acquiring the MRI data and the patient volunteers for their participation.References
1. Yoshita, M., E. Fletcher, D. Harvey, M. Ortega, O. Martinez, D. M. Mungas, B. R. Reed, and C. S. DeCarli. “Extent and Distribution of White Matter Hyperintensities in Normal Aging, MCI, and AD.” Neurology 67, no. 12 (December 26, 2006): 2192–98. https://doi.org/10.1212/01.wnl.0000249119.95747.1f.
2. Debette, S., and H. S. Markus. “The Clinical Importance of White Matter Hyperintensities on Brain Magnetic Resonance Imaging: Systematic Review and Meta-Analysis.” BMJ 341, no. jul26 1 (July 26, 2010): c3666–c3666. https://doi.org/10.1136/bmj.c3666.
3. Alber, Jessica, Suvarna Alladi, Hee‐Joon Bae, David A. Barton, Laurel A. Beckett, Joanne M. Bell, Sara E. Berman, et al. “White Matter Hyperintensities in Vascular Contributions to Cognitive Impairment and Dementia (VCID): Knowledge Gaps and Opportunities.” Alzheimer’s & Dementia: Translational Research & Clinical Interventions 5, no. 1 (January 2019): 107–17. https://doi.org/10.1016/j.trci.2019.02.001.
4. Maillard, Pauline, Evan Fletcher, Baljeet Singh, Oliver Martinez, David K. Johnson, John M. Olichney, Sarah T. Farias, and Charles DeCarli. “Cerebral White Matter Free Water: A Sensitive Biomarker of Cognition and Function.” Neurology 92, no. 19 (May 7, 2019): e2221–31.
5. Maillard, Pauline, Gary F. Mitchell, Jayandra J. Himali, Alexa Beiser, Evan Fletcher, Connie W. Tsao, Matthew P. Pase, et al. “Aortic Stiffness, Increased White Matter Free Water, and Altered Microstructural Integrity: A Continuum of Injury.” Stroke 48, no. 6 (June 2017): 1567–73.
6. Chappell, M.A., A.R. Groves, B. Whitcher, and M.W. Woolrich. “Variational Bayesian Inference for a Nonlinear Forward Model.” IEEE Transactions on Signal Processing 57, no. 1 (January 2009): 223–36.
7. Jenkinson, Mark, Christian F. Beckmann, Timothy E.J. Behrens, Mark W. Woolrich, and Stephen M. Smith. “FSL.” NeuroImage 62, no. 2 (August 2012): 782–90.
8. Pasternak, Ofer, Nir Sochen, Yaniv Gur, Nathan Intrator, and Yaniv Assaf. “Free Water Elimination and Mapping from Diffusion MRI.” Magnetic Resonance in Medicine 62, no. 3 (September 2009): 717–30.
9. DeCarli, Charles, Evan Fletcher, Vincent Ramey, Danielle Harvey, and William J. Jagust. “Anatomical Mapping of White Matter Hyperintensities (WMH): Exploring the Relationships Between Periventricular WMH, Deep WMH, and Total WMH Burden.” Stroke 36, no. 1 (January 2005): 50–55.
10. Dempster, A. P., N. M. Laird, and D. B. Rubin. “Maximum Likelihood from Incomplete Data Via the EM Algorithm.” Journal of the Royal Statistical Society: Series B (Methodological) 39, no. 1 (September 1977): 1–22.
11. Bates, Douglas, Martin Mächler, Ben Bolker, and Steve Walker. “Fitting Linear Mixed-Effects Models Using Lme4.” Journal of Statistical Software 67, no. 1 (2015). https://doi.org/10.18637/jss.v067.i01.
12. Promjunyakul, N., D. Lahna, J.A. Kaye, H.H. Dodge, D. Erten-Lyons, W.D. Rooney, and L.C. Silbert. “Characterizing the White Matter Hyperintensity Penumbra with Cerebral Blood Flow Measures.” NeuroImage: Clinical 8 (2015): 224–29.
13. Bastos-Leite, A.J., J.P.A. Kuijer, S.A.R.B. Rombouts, E. Sanz-Arigita, E.C. van Straaten, A.A. Gouw, W.M. van der Flier, P. Scheltens, and F. Barkhof. “Cerebral Blood Flow by Using Pulsed Arterial Spin-Labeling in Elderly Subjects with White Matter Hyperintensities.” American Journal of Neuroradiology 29, no. 7 (August 2008): 1296–1301.
Figures
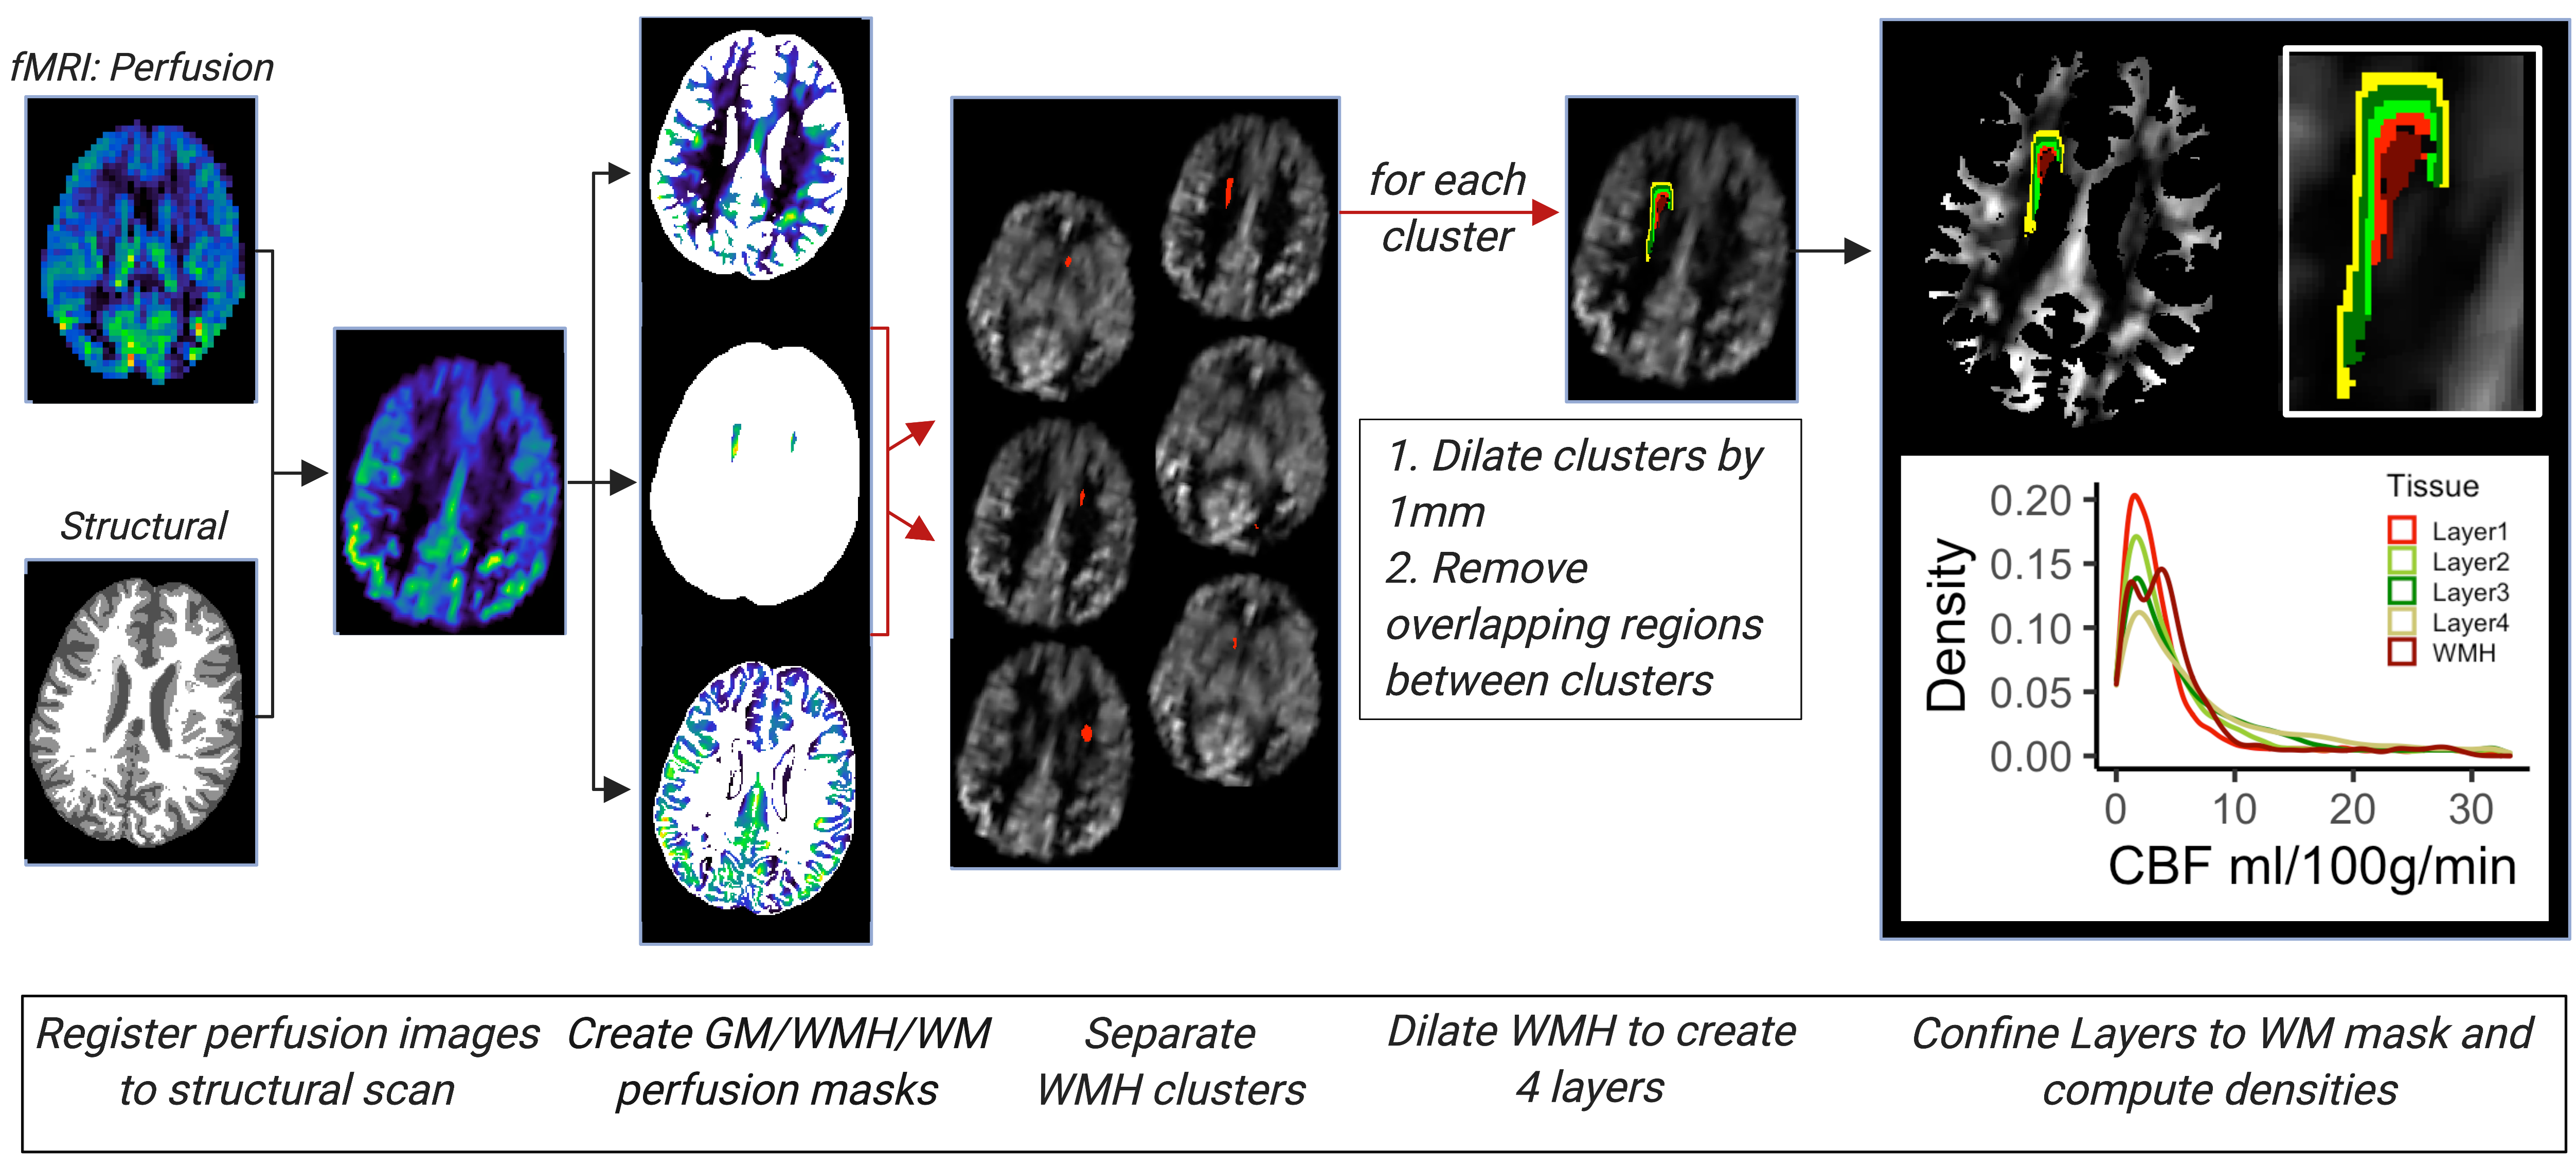
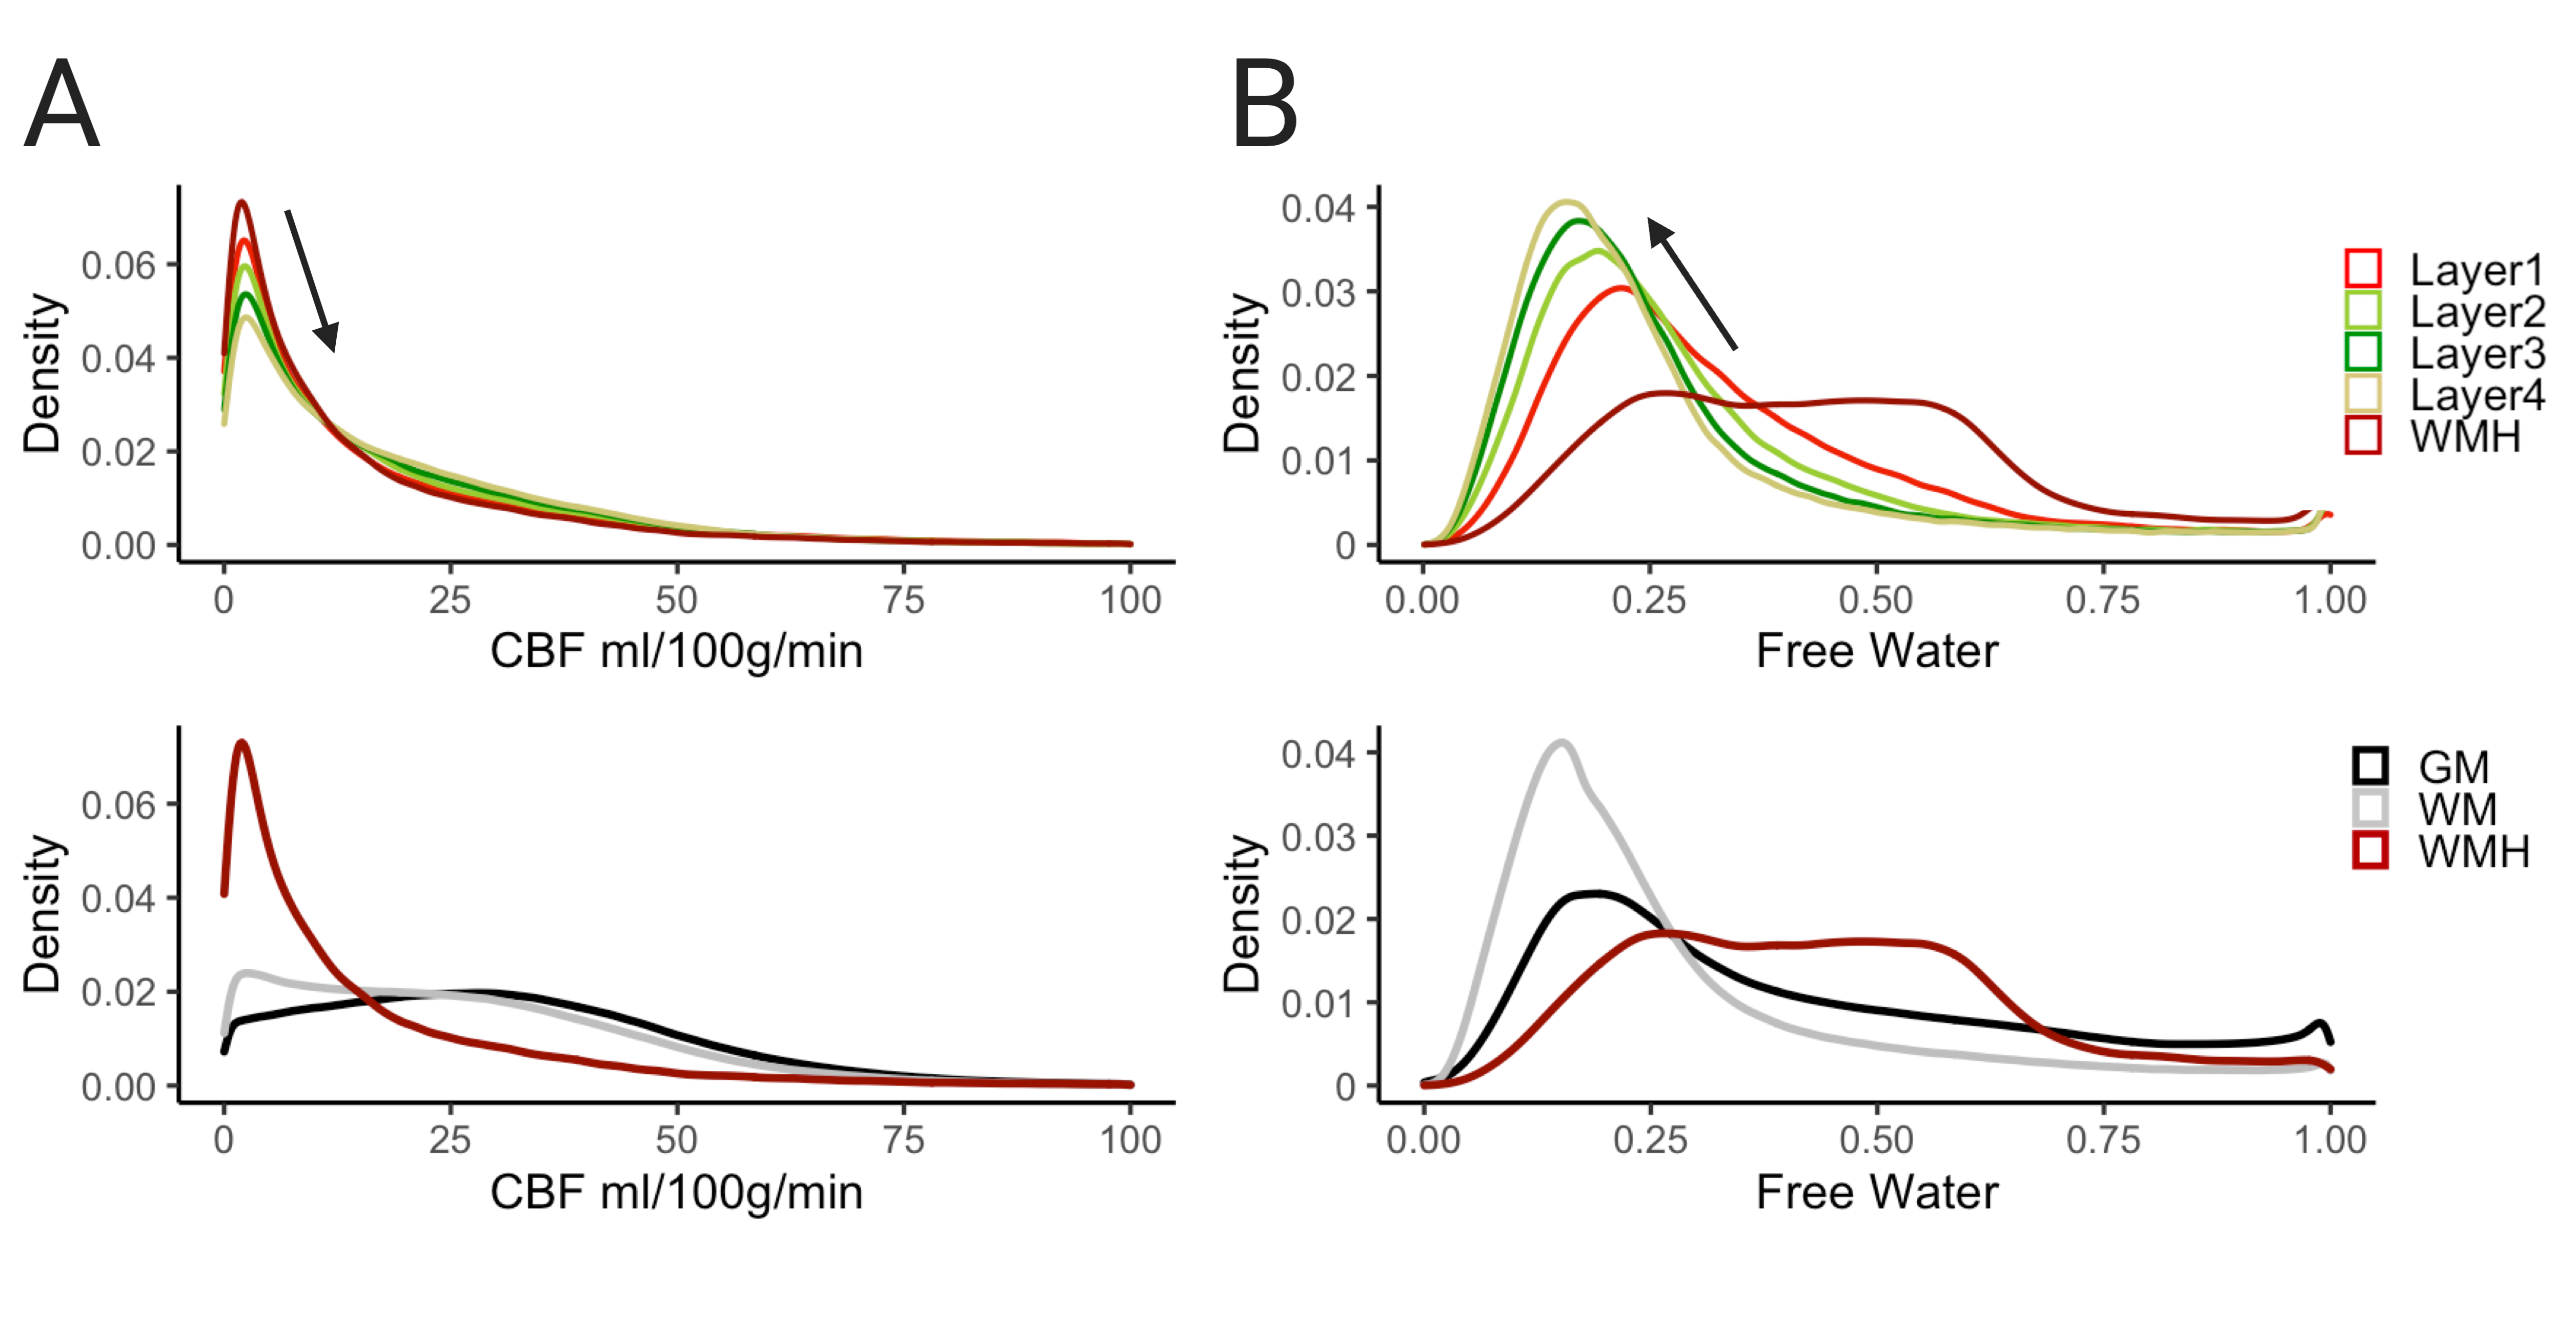
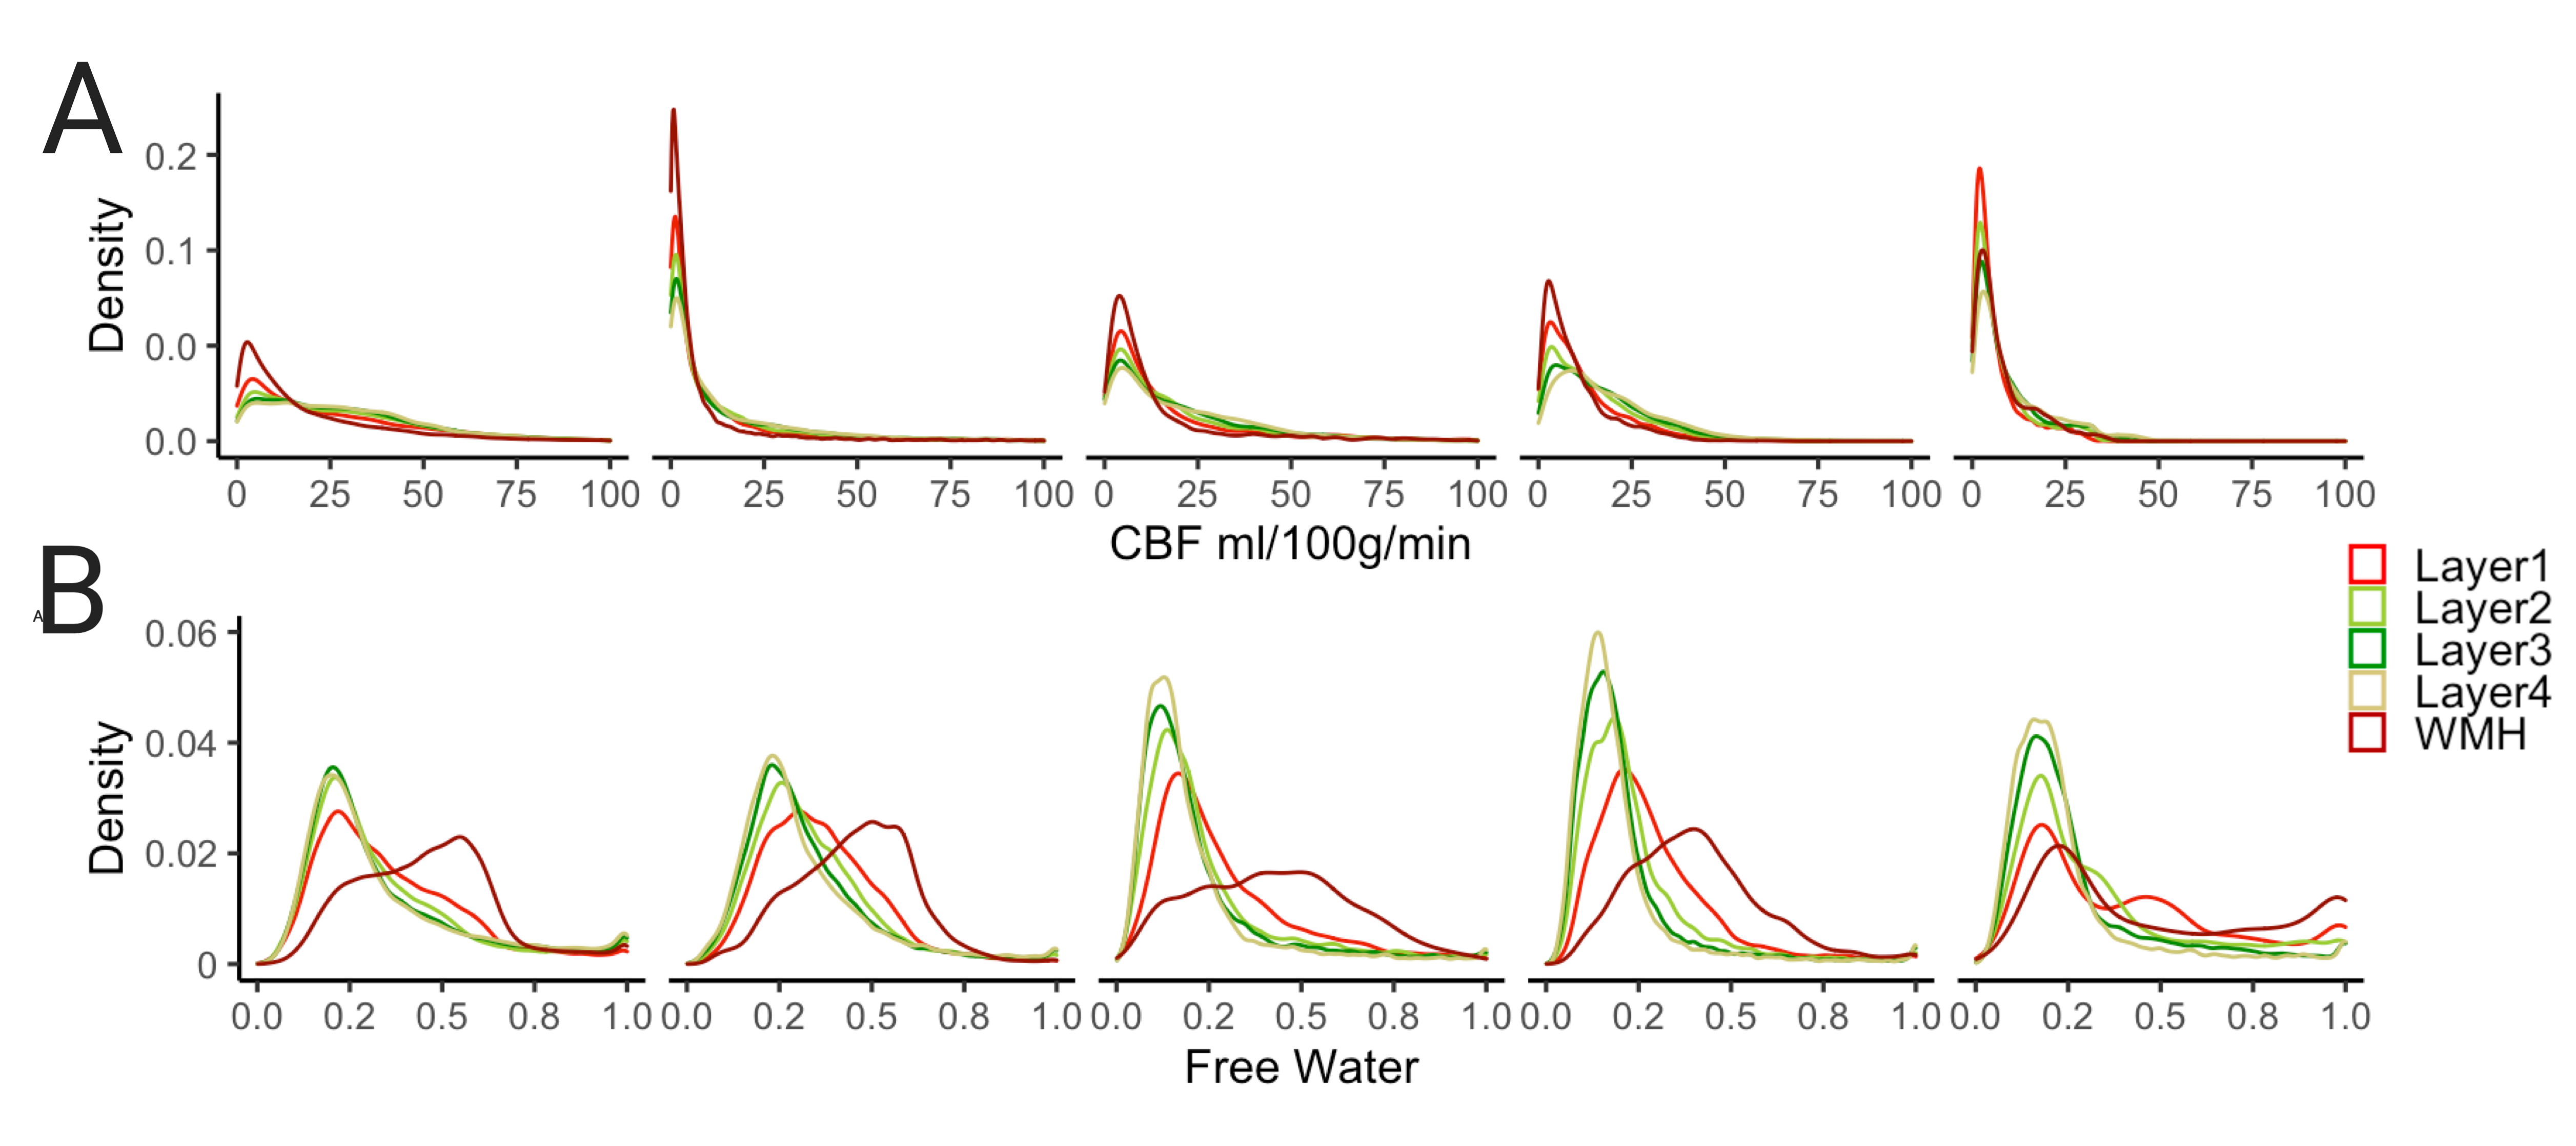
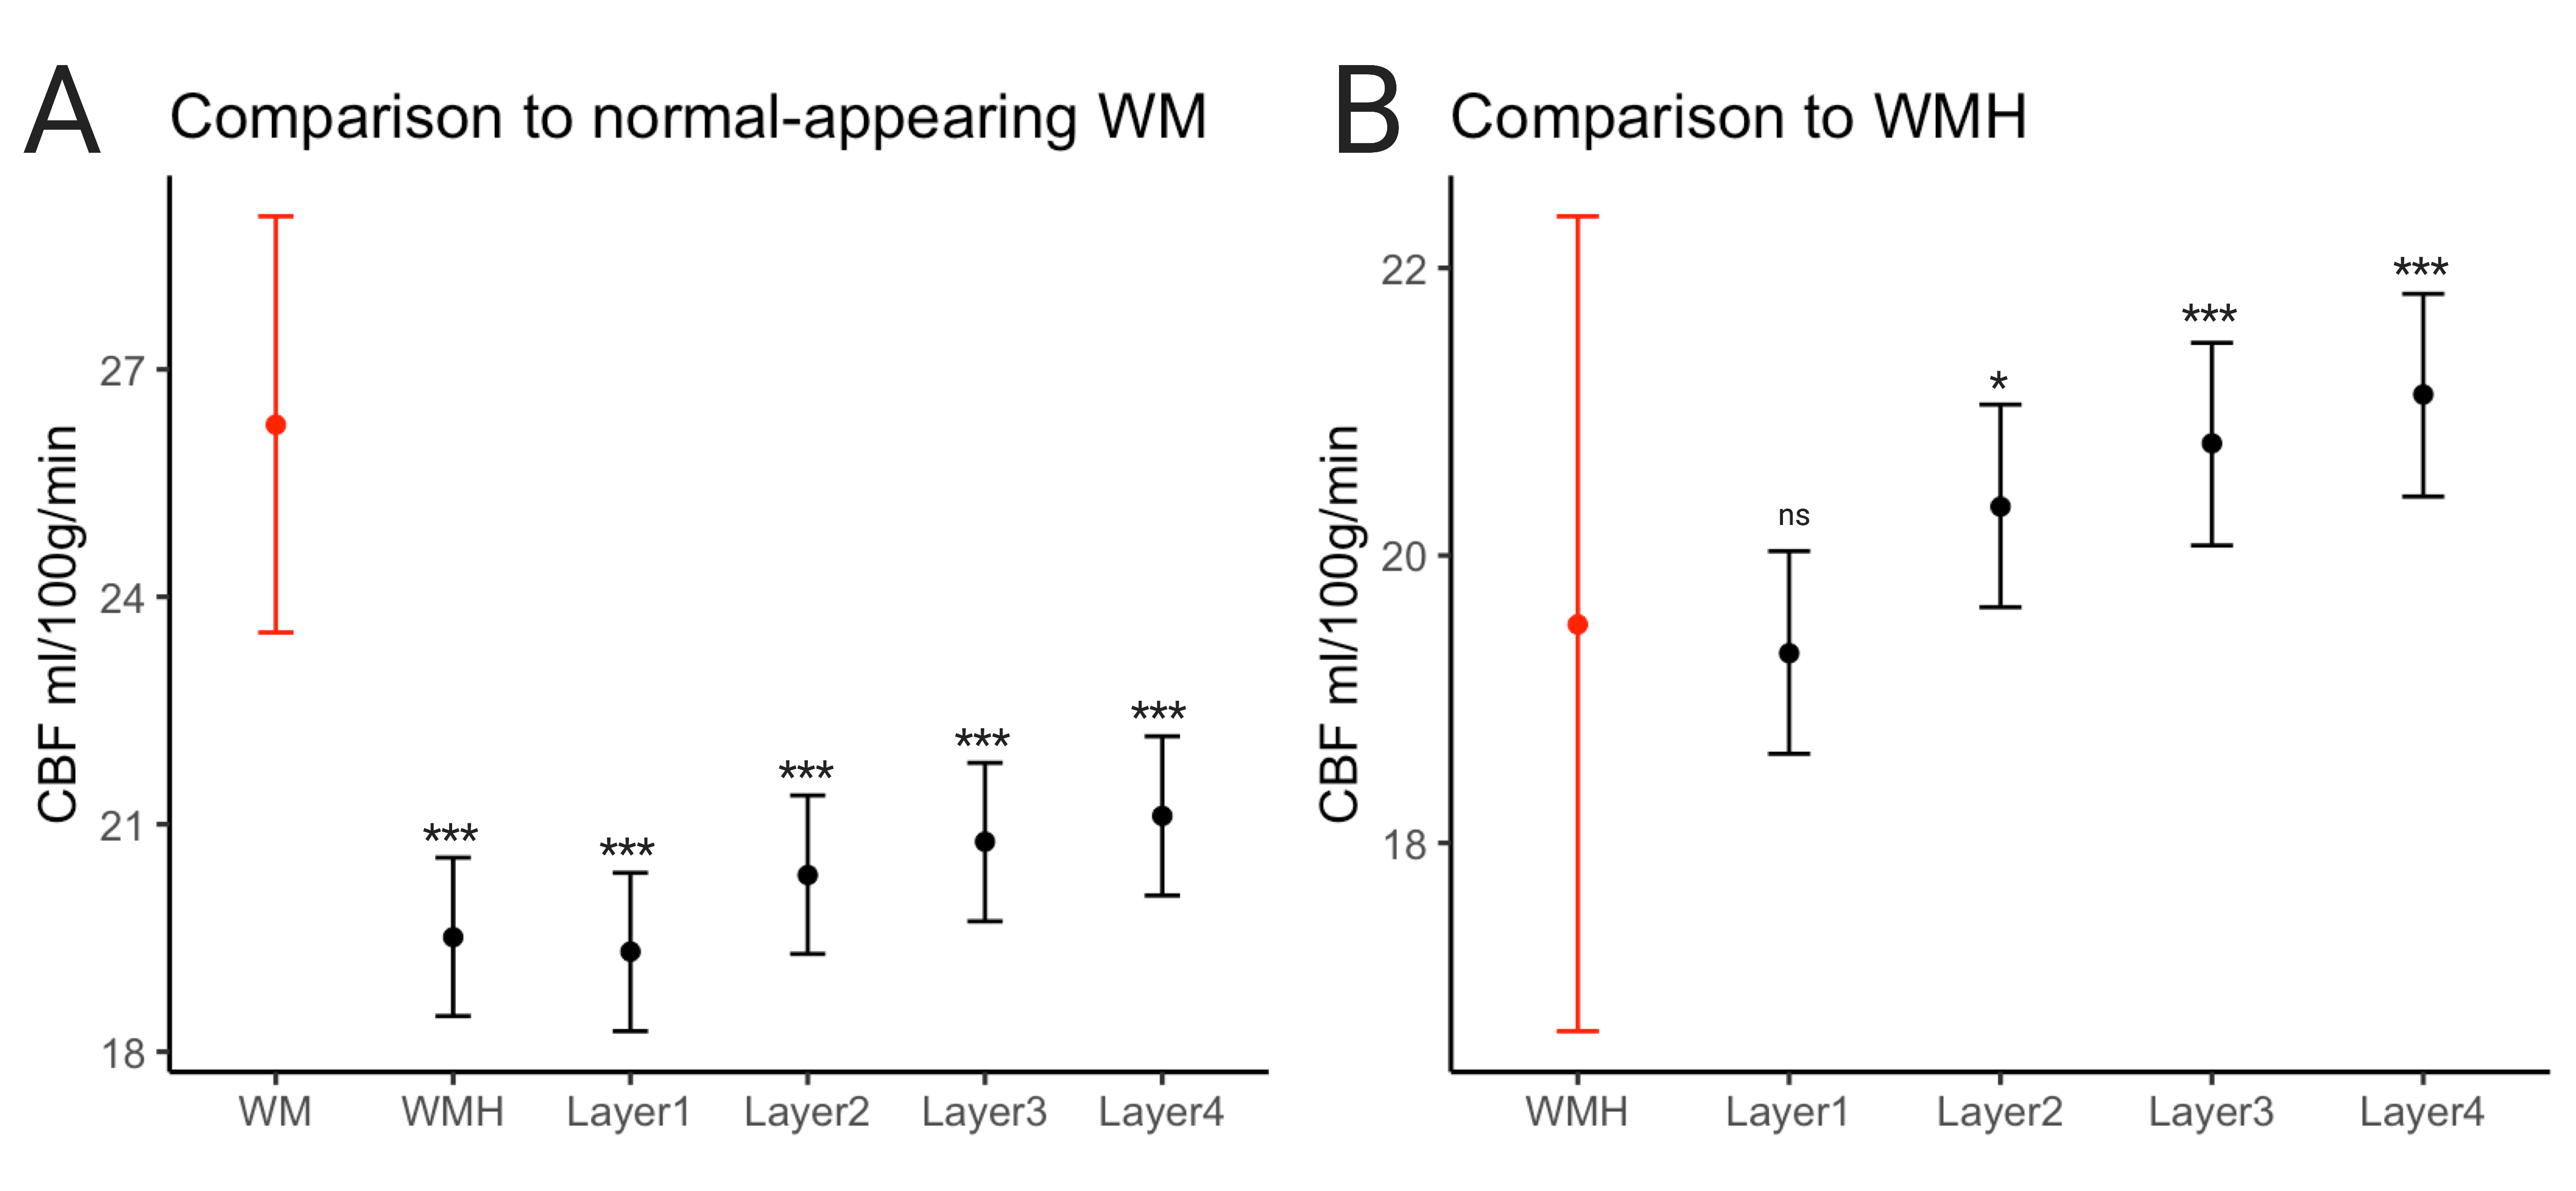
Figure 4. Results of linear mixed model comparing the mean CBF values of (A) WMHs and layers 1-4 to normal-appearing white matter, indicated in red and (B) layers 1-4 to WMHs, indicated in red.
***p<0.001, *p<0.01
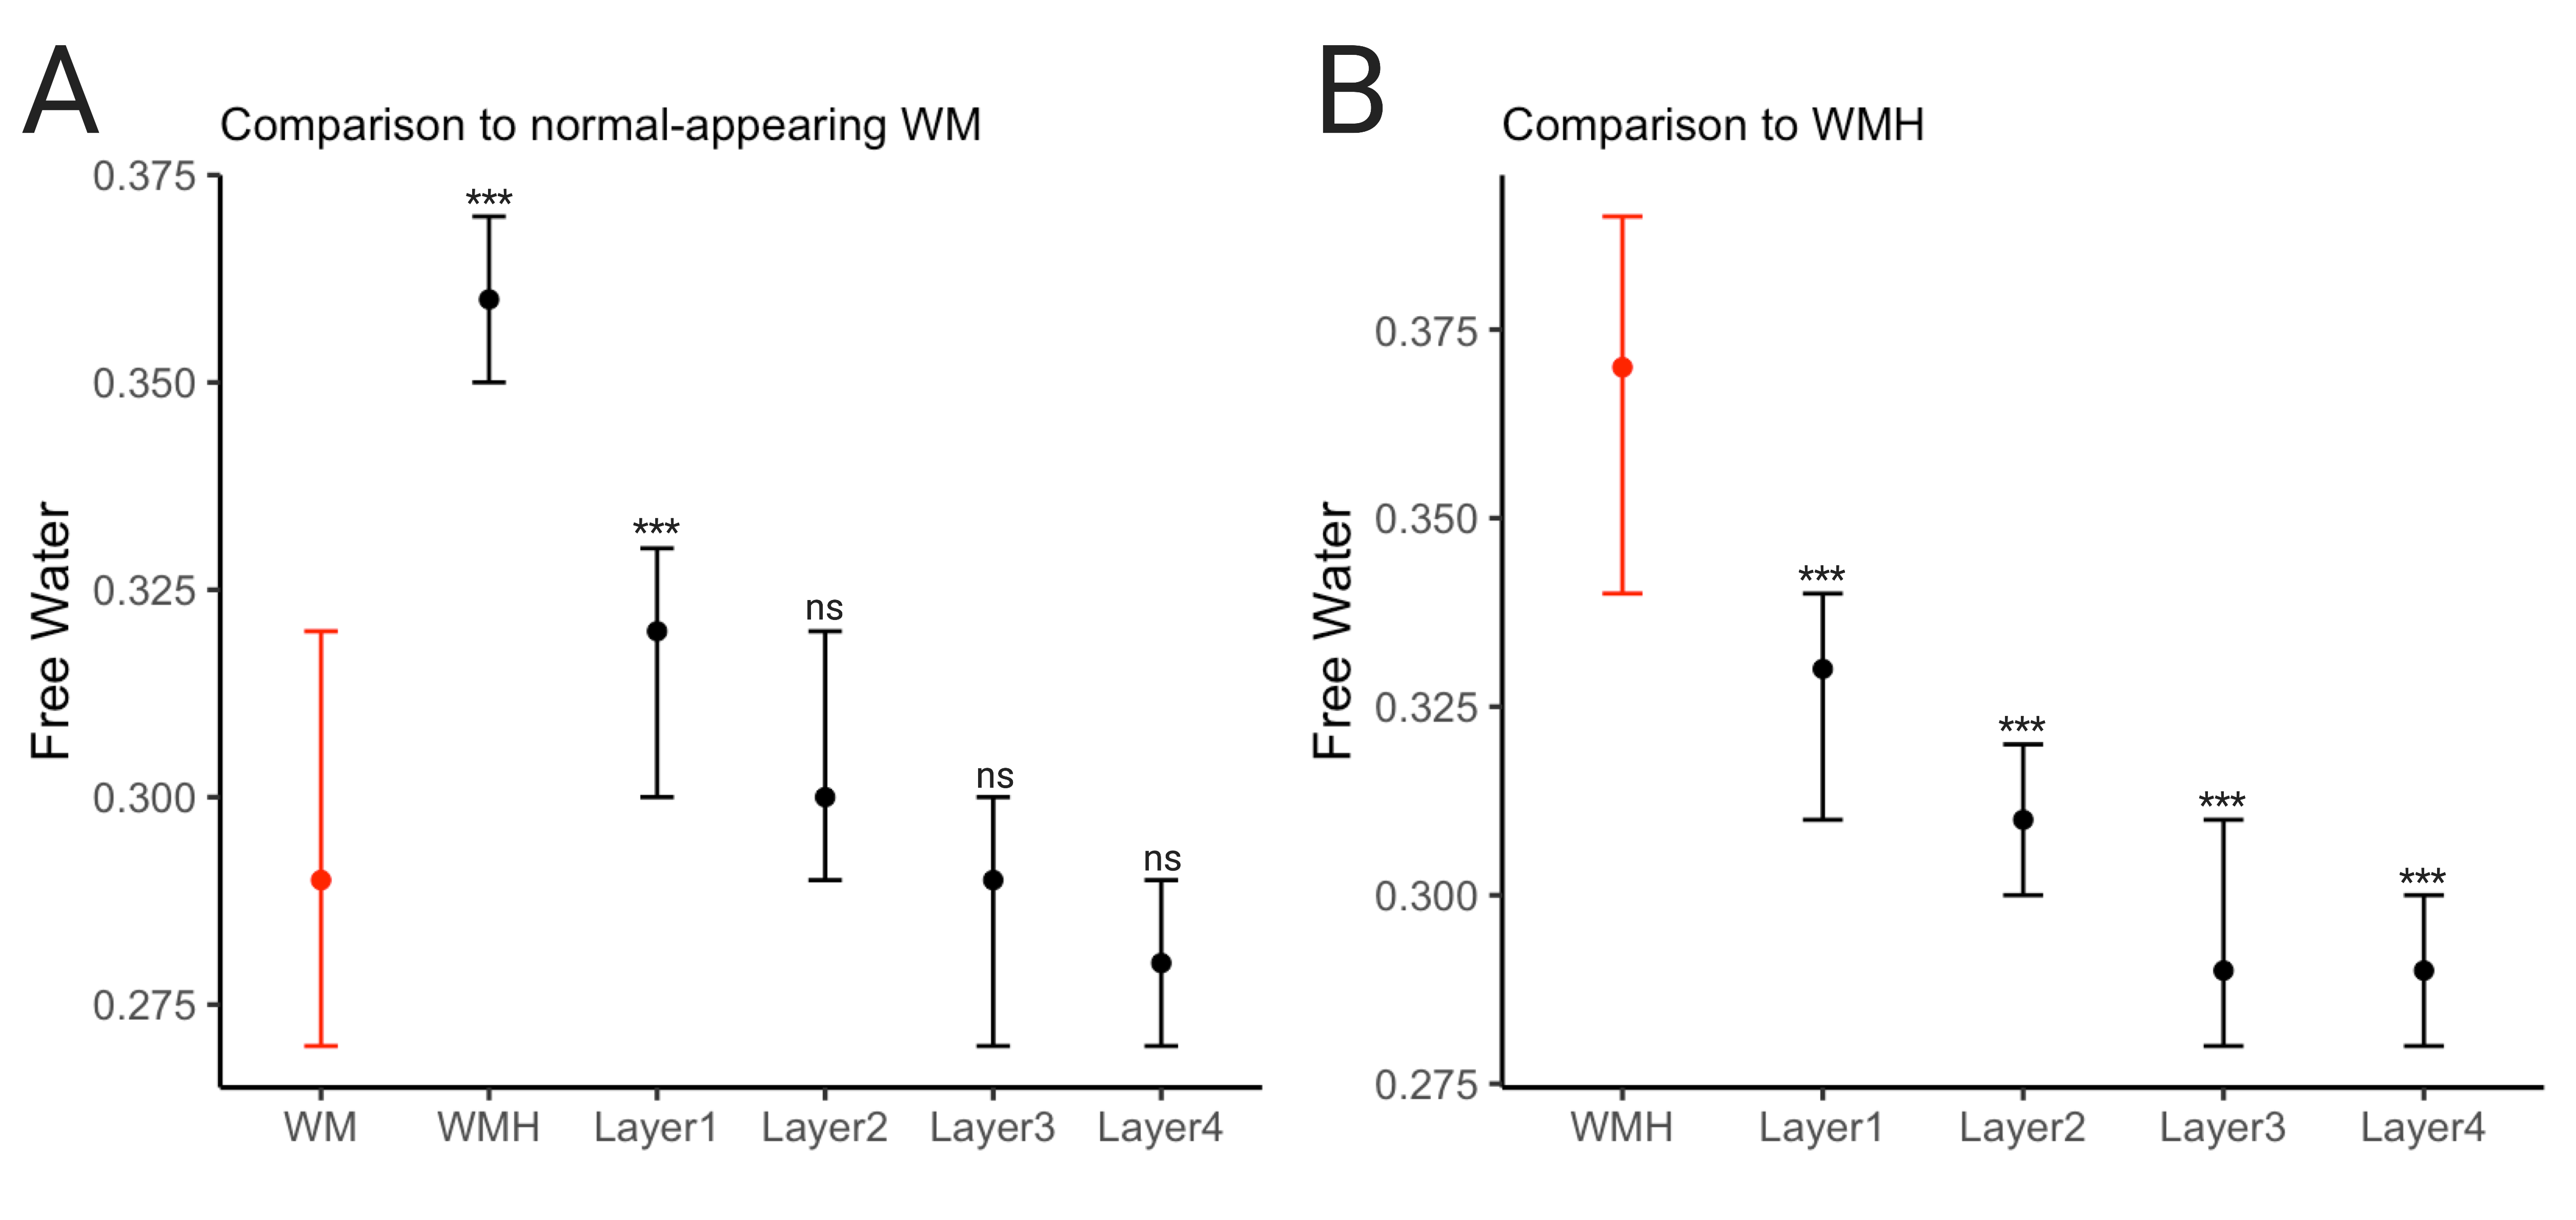
Figure 5. Results of linear mixed model comparing the mean FW values of (A) WMH and layers 1-4 to normal-appearing white matter, indicated in red (B) layers 1-4 to WMH, indicated in red
***p<0.001