2368
Diffusion and perfusion characteristics of brain white matter prone to hyperintensities: a four-year longitudinal study
Shruti Agarwal1, Jay J. Pillai1,2, and Hanzhang Lu3,4
1Division of Neuroradiology, Russell H. Morgan Department of Radiology and Radiological Science, Johns Hopkins University School of Medicine, Baltimore, MD, United States, 2Department of Neurosurgery, Johns Hopkins University School of Medicine, Baltimore, MD, United States, 3Division of MR Research, Russell H. Morgan Department of Radiology and Radiological Science, Johns Hopkins University School of Medicine, Baltimore, MD, United States, 4F. M. Kirby Research Center for Functional Brain Imaging, Kennedy Krieger Institute, Baltimore, MD, United States
1Division of Neuroradiology, Russell H. Morgan Department of Radiology and Radiological Science, Johns Hopkins University School of Medicine, Baltimore, MD, United States, 2Department of Neurosurgery, Johns Hopkins University School of Medicine, Baltimore, MD, United States, 3Division of MR Research, Russell H. Morgan Department of Radiology and Radiological Science, Johns Hopkins University School of Medicine, Baltimore, MD, United States, 4F. M. Kirby Research Center for Functional Brain Imaging, Kennedy Krieger Institute, Baltimore, MD, United States
Synopsis
White matter hyperintensities (WMH) are white matter brain lesions found as areas of increased signals on T2-weighted and FLAIR MRI scans. A large majority of elderly individuals have a certain degree of WMH which may be associated with cognitive decline, decline in physical function and a higher risk of stroke and death. To date, neurobiological mechanisms underlying and predictive of WMH is not fully characterized. In this study, we aim to use a longitudinal design to elucidate hallmarks of brain tissue at baseline that will predict a “conversion” from normal-appearing WM (NAWM) to WMH over a four-year period.
Purpose
White matter hyperintensities (WMH)1,2 are white matter brain lesions found as areas of increased signals on T2-weighted and FLAIR MRI scans. Age is a major risk factor for WMH. A large majority of elderly individuals have a certain degree of WMH which may be associated with cognitive decline3, decline in physical function4 and a higher risk of stroke and death5,6,7. To date, neurobiological mechanisms underlying and predictive of WMH is not fully characterized. In this study, we aim to use a longitudinal design to elucidate hallmarks of brain tissue at baseline that will predict a “conversion” from normal-appearing WM (NAWM) to WMH over a four-year period.Methods
65 elderly subjects aged 55-88 (mean 71.2±9.5 years, 22 males, 43 females) who were cognitively normal at both baseline and follow-up were recruited from the Dallas Lifespan Brain Study (DLBS)8 and received a research MRI scan. These subjects returned to complete a follow-up MRI at an interval of 3.9 years (±0.5 years)9. MRI Scanning was performed on a 3T Philips MRI scanner. At baseline, T1-MPRAGE, FLAIR, Pseudo-Continuous-Arterial-Spin-Labeling (PCASL), DTI sequences were performed on each subject. At follow-up, T1-MPRAGE and FLAIR were repeated on each subject. SPM12 was used to co-register all images in baseline and follow-up scans to FLAIR images of baseline, so that all images are in the same space. A CBF map was obtained from the PCASL data and the voxel-wise CBF values were normalized to the whole-brain value to account for global fluctuations in CBF due to breathing, caffeine, etc.10. DTI analysis was performed using FSL subroutines11 to correct for eddy current distortions and to reconstruct diffusion tensors, including FA and MD images. Delineation of ROIs corresponding to “Newly Grown WMH”, “Old WMH”, and “Healthy WM”: WMH regions were automatically segmented on FLAIR images from baseline and follow-up data and named as WMHmask1 and WMHmask2 respectively (Figure 1A). The intersection of WMHMask1 & WMHMask2 formed a preliminary “Old WMH” ROI. The subtraction of WMHMask1 from WMHMask2 [(WMHMask2-WMHMask1)>0] was referred as “Newly Grown WMH” (see Figure 1B). To delineate a healthy tissue mask, T1-weighted MPRAGE image was segmented to obtain a WM probability map and only voxels with a WM probability of 50% or greater were used to create White Matter Mask (WMmask). The region within WMmask but outside of both WMHMask1 and WMHMask2 formed a preliminary “Healthy WM” mask. Importantly, diffusion and perfusion properties of brain WM are known to vary across regions. Therefore, to ensure that we compare voxels relatively adjacent to each other, we employed the following procedure to further refine the “Old WMH” and “Health WM” ROIs. Specifically, for each voxel (cg) in the “Newly Grown WMH” mask (Figure 2), we searched in its 3x3x3 neighborhood to identify a voxel (cd) which resides in the preliminary “Old WMH” mask and has minimum distance from cg. This voxel was included in the final “Old WMH” mask. Similarly, we identified a healthy voxel (ch) in 3x3x3 neighborhood of each cd. With this procedure, we obtained three final masks, each with an identical number of voxels.These masks were applied to the diffusion and perfusion maps as well as T1 image to obtain ROI values for each parameter.
Results
Changes in WMH over four years: Qualitative severity of the WMH was assessed by Fazekas score12. Fazekas scores during baseline and follow-up were 3.23±1.73 and 3.46±1.76 (N=65), respectively, showing a significant increase (p<0.001) over four years. WMH quantitative volume13 was 7.4±9.4ml and 12.4±13.6 ml at baseline and follow-up, respectively, again revealing a significance increase (p<0.001).Diffusion and perfusion properties of WMH tissues: Comparing the three ROIs, specifically “Newly Grown WMH”, “Old WMH”, and “Healthy WM”, at baseline, “Old WMH” revealed a significantly lower (p<0.001) CBF (0.423±0.076 relative to whole-brain CBF) compared to “Newly Grown WMH” (0.443±0.075), which was in turn lower (p<0.001) than “Healthy WM” (0.482±0.078). Similar differences were observed for FA, MD, and T1 signal intensity (Figure 3).
Figure 4 displays the relative values of diffusion, perfusion, and T1 signal intensities among the three tissue types. The bars are displayed such that the “Healthy WM” is on the left-end, the “Old WMH” is displayed on the right-end, with the “Newly Grown WMH” displayed proportionally along the bar. It can be seen that the characteristics of the “Newly Grown WMH” are closer to the healthy tissue in all structural/anatomical parameters, but their CBF resembles more to the “Old WMH” tissues.
Conclusion
Our findings show that areas of NAWM that develop WMH over time have reduced CBF at baseline and these abnormalities progress faster than structural properties such as diffusion or T1. CBF may provide an early marker for progression of age-related white matter disease.Acknowledgements
No acknowledgement found.References
- Hachinski VC, Potter P, Merskey H. Leuko-araiosis. Arch Neurol. 1987;44(1):21-3.
- O’Sullivan M. Leukoaraiosis. Practical Neurology. 2008;8(1):26-38.
- de Groot JC, de Leeuw FE, Oudkerk M, van Gijn J, Hofman A, Jolles J, et al. Cerebral white matter lesions and cognitive function: the Rotterdam Scan Study. Ann Neurol. 2000;47(2):145-51.
- Camicioli R, Verghese J. Physical activity, white matter hyperintensities, and motor function: bringing out the reserves. Neurology. 2015;84(13):1288-9.
- Helenius J, Tatlisumak T. Treatment of leukoaraiosis: a futuristic view. Curr Drug Targets. 2007;8(7):839-45.
- Debette S, Markus HS. The clinical importance of white matter hyperintensities on brain magnetic resonance imaging: systematic review and meta-analysis. BMJ. 2010;341:c3666.
- Xiong YY, Mok V. Age-related white matter changes. J Aging Res. 2011;2011:617927.
- Kennedy KM, Rodrigue KM, Bischof GN, Hebrank AC, Reuter-Lorenz PA, Park DC. Age trajectories of functional activation under conditions of low and high processing demands: an adult lifespan fMRI study of the aging brain. Neuroimage. 2015;104:21-34.
- Peng SL, Chen X, Li Y, Rodrigue KM, Park DC, Lu H. Age-related changes in cerebrovascular reactivity and their relationship to cognition: A four-year longitudinal study. Neuroimage. 2018;174:257-62.
- Li Y, Liu P, Li Y, Fan H, Su P, Peng SL, et al. ASL-MRICloud: An online tool for the processing of ASL MRI data. NMR Biomed. 2019;32(2):e4051.
- Jenkinson M, Beckmann CF, Behrens TE, Woolrich MW, Smith SM. Fsl. Neuroimage. 2012;62(2):782-90.
- Fazekas F, Chawluk JB, Alavi A, Hurtig HI, Zimmerman RA. MR signal abnormalities at 1.5 T in Alzheimer's dementia and normal aging. AJR Am J Roentgenol. 1987;149(2):351-6.
- Wu D, Albert M, Soldan A, Pettigrew C, Oishi K, Tomogane Y, et al. Multi-atlas based detection and localization (MADL) for location-dependent quantification of white matter hyperintensities. Neuroimage Clin. 2019;22:101772.
Figures
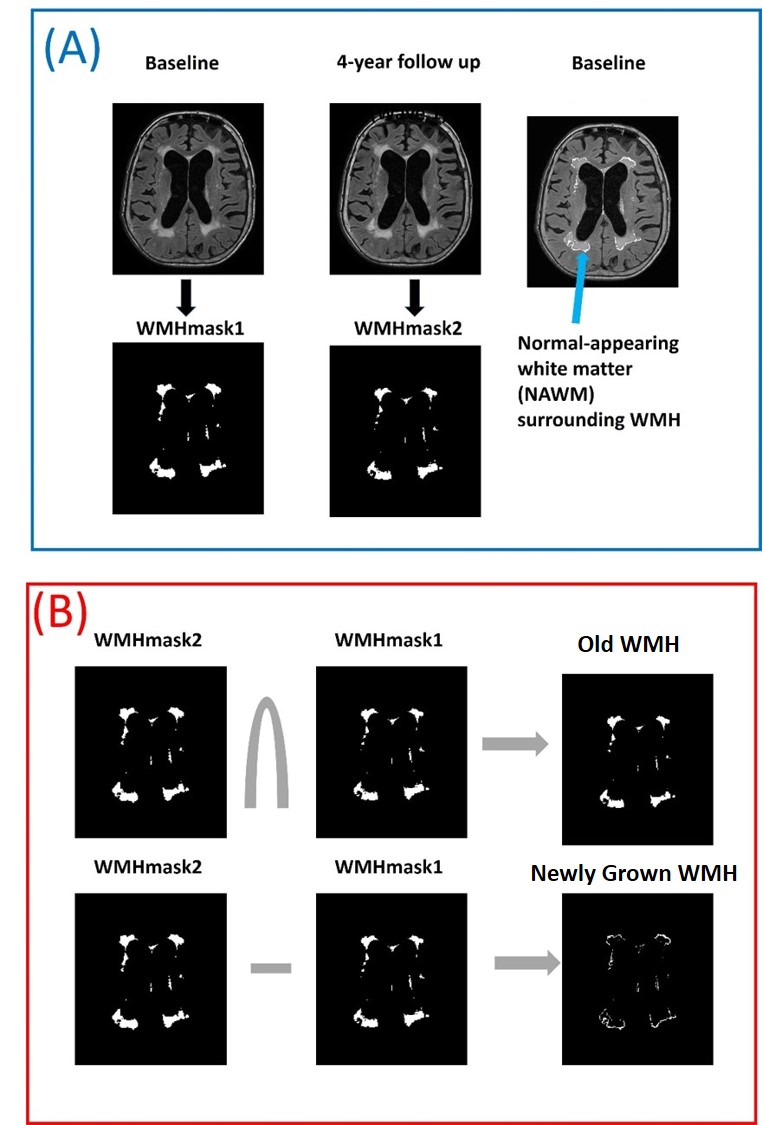
Figure
1: (A): White
matter hyperintense (WMH) regions are automatically segmented on FLAIR images
from baseline and follow-up and named as WMHmask1
and WMHmask2. Blue arrow shows the normal appearing white matter (NAWM) that
progressed to WMH in 4-year follow up. (B):
The intersection of WMHMask1 & WMHMask2 is referred as “Old WMH” at
baseline and the subtraction of WMHMask1 from WMHMask2 [(WMHMask2-WMHMask1)>0]
is referred as “Newly Grown WMH” at 4-year follow up (which was NAWM at
baseline).
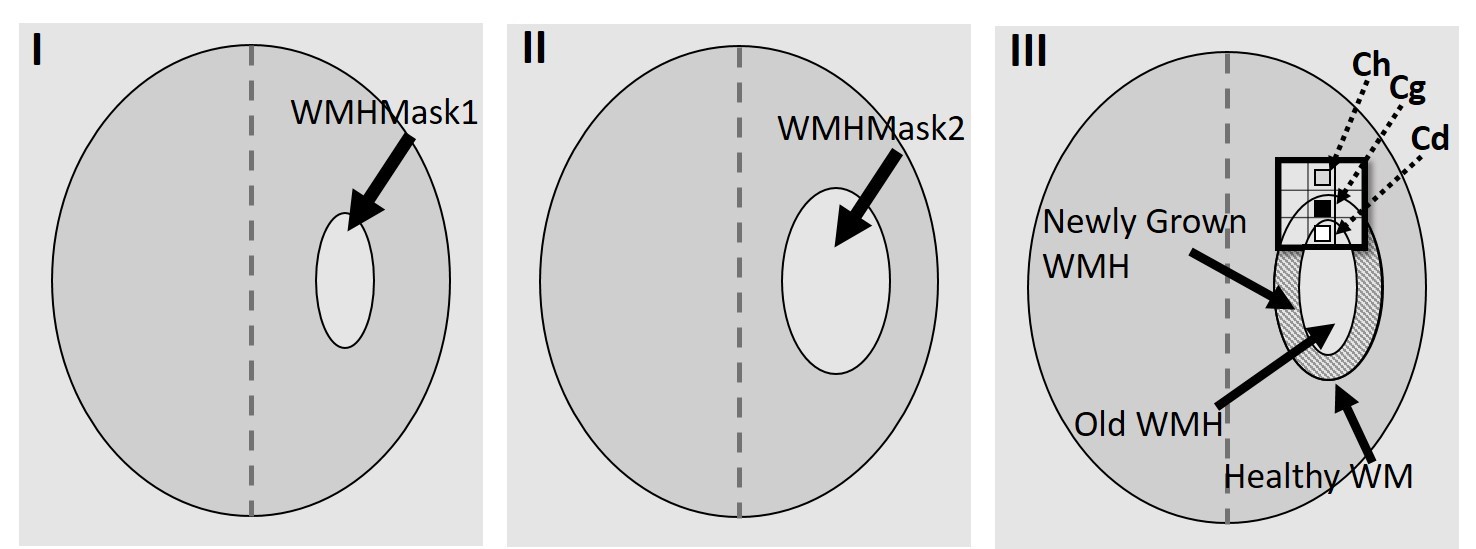
Figure
2: Schematic
diagram illustrating the selection of voxels (cd, cg, ch)
which is a subset of “Old WMH”, “Newly Grown WMH” and “Healthy WM” regions.
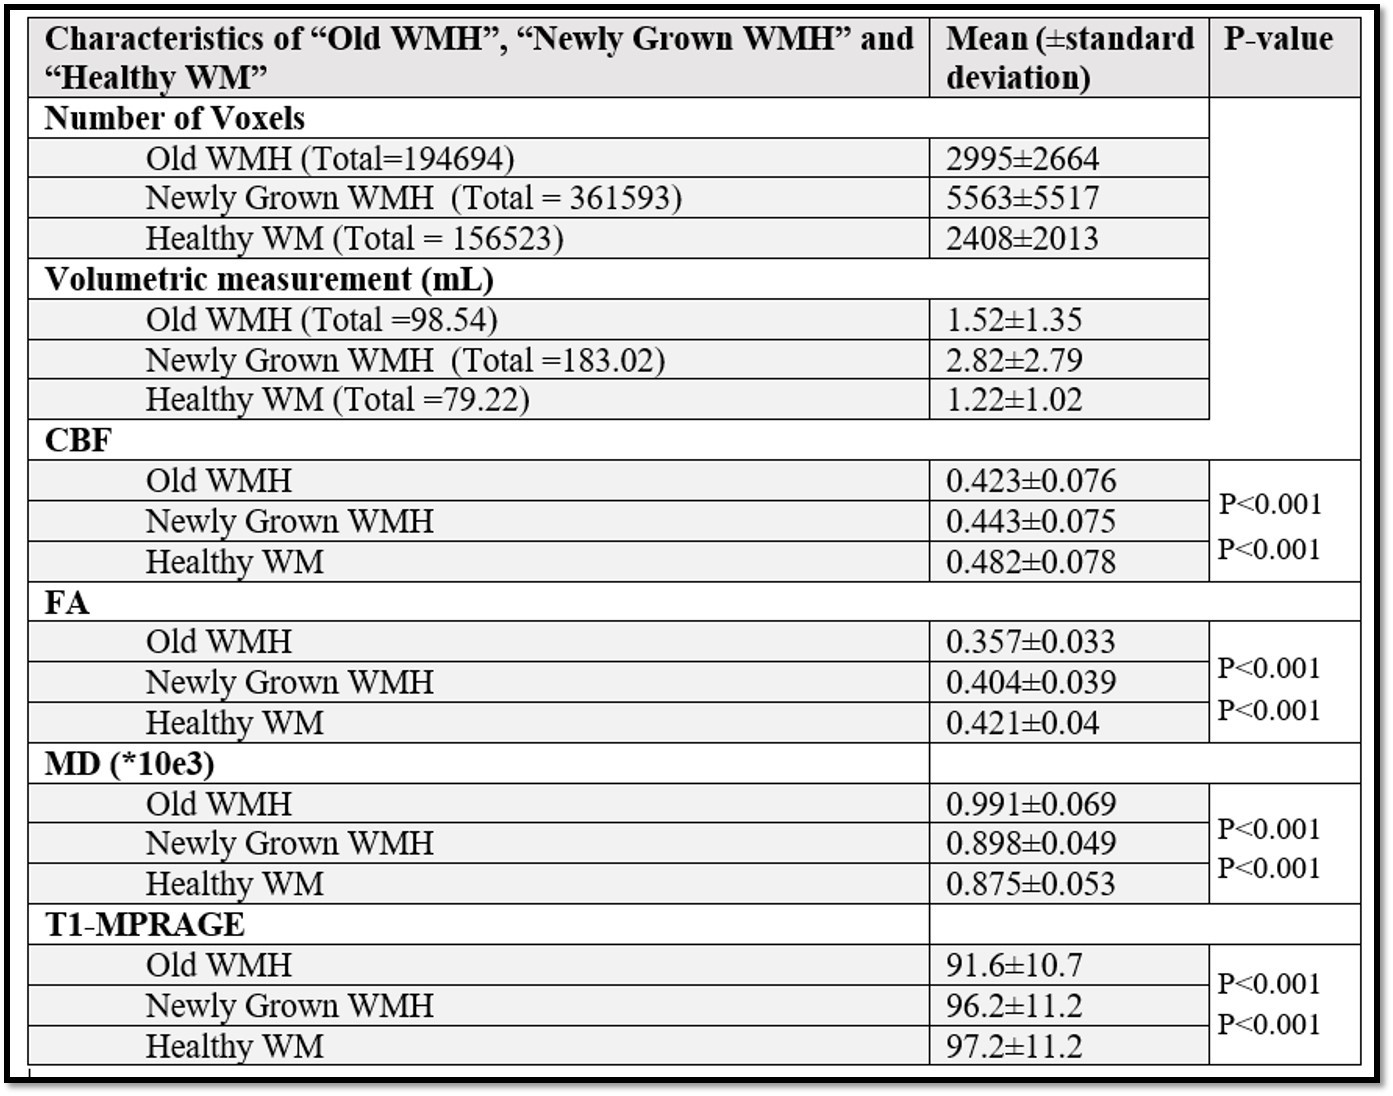
Figure
3: For each
subject, MRI parameters was obtained from “Old WMH”, “Newly Grown WMH” and
“Healthy WM” regions. To avoid duplication, MRI parameters of a voxel in “Old
WMH” region is considered only once (even if that voxel is paired multiple
times with different newly grown voxel in “Newly Grown WMH” region). Same was
applicable to the voxels in “Healthy WM” region. The mean ± SD (standard deviation) for CBF,
FA, MD and T1 signal intensity in each ROI across the population is summarized. Also, P-value between “Old
WMH” & “Newly Grown WMH” and “Newly Grown WMH” & “Healthy WM” is
provided.
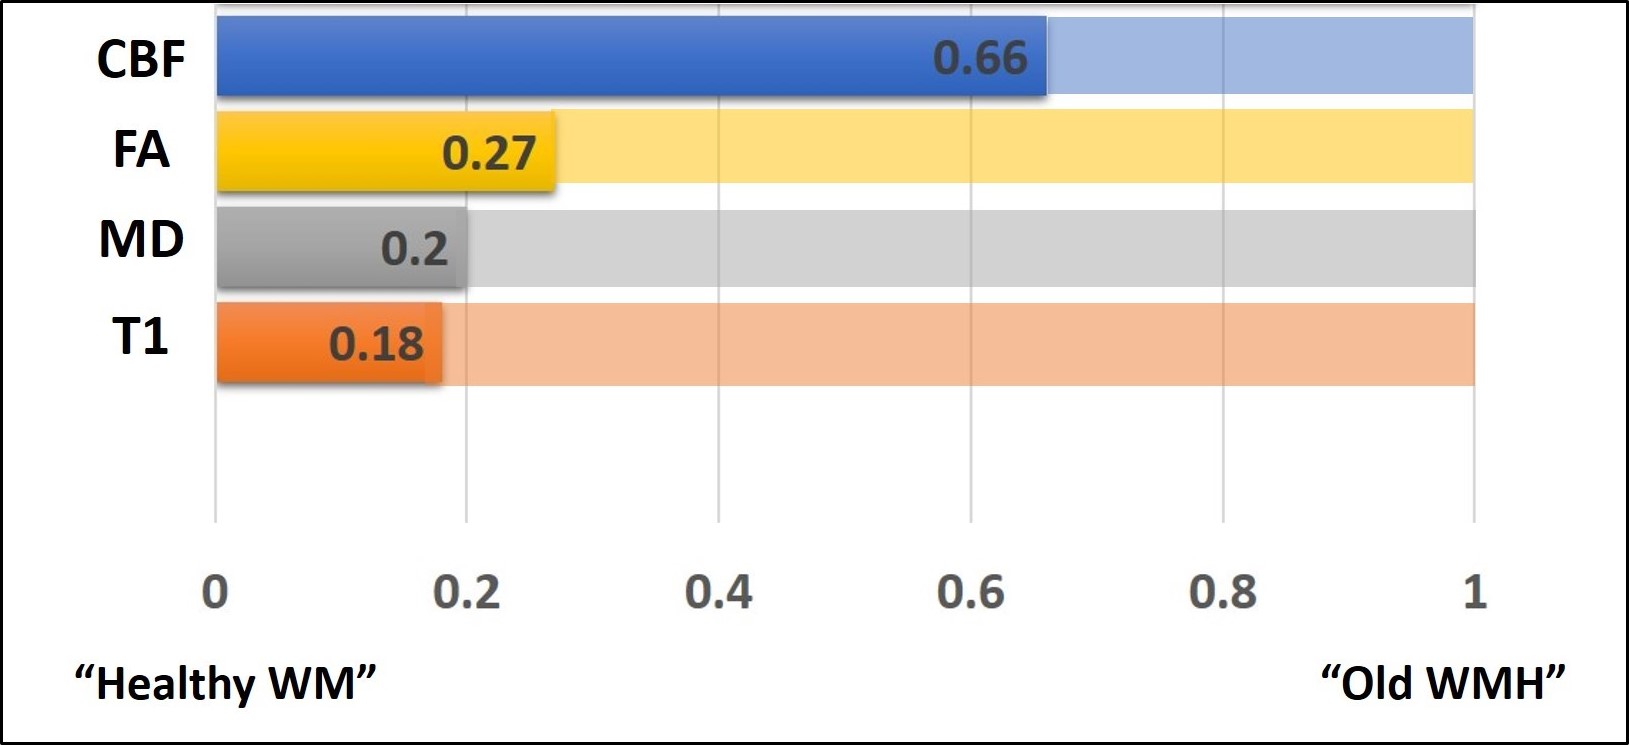
Figure 4: The relative values of diffusion,
perfusion, and T1 signal intensities among the three tissue types is displayed.
The bars are displayed such that the “Healthy WM” is on the left-end, the “Old
WMH” is displayed on the right-end, with the “Newly Grown WMH” displayed
proportionally along the bar. It can be seen that the characteristics of the
“Newly Grown WMH” are closer to the healthy tissue in all structural/anatomical
parameters, but their CBF resembles more to the “Old WMH” tissues.