2361
High resolution imaging of choroid plexus blood flow with multi-delay pseudo-continuous arterial spin labeling1Laboratory of FMRI Technology (LOFT), Mark & Mary Stevens Neuroimaging and Informatics Institute, Keck School of Medicine, University of Southern California, Los Angeles, CA, United States, 2Fetal and Neonatal Institute, Division of Neonatology, Children's Hospital Los Angeles, Department of Pediatrics, Keck School of Medicine, University of Southern California, Los Angeles, CA, United States, 3Department of Neurological Surgery, Keck School of Medicine, University of Southern California, Los Angeles, CA, United States, 4Department of Neurology, Keck School of Medicine, University of Southern California, Los Angeles, CA, United States, 5USC Neurorestoration Center, Keck School of Medicine, University of Southern California, Los Angeles, CA, United States, 6Department of Psychiatry, Keck School of Medicine, University of Southern California, Los Angeles, CA, United States
Synopsis
In this study we developed an arterial spin labeling (ASL) sequence with high spatial/temporal resolution and utilized a post-processing denoising method to measure dynamic choroid plexus (CP) perfusion signal. Quantified CP blood flow was evaluated in heathy subjects and one normal pressure hydrocephalus (NPH) patient and compared with water exchange rate across the blood-brain barrier (BBB). Our preliminary results show that CP blood flow may be altered in NPH and has a potential relation with water exchange rate across the BBB.
Background
The choroid plexus (CP) is located in the ventricles of the brain and is responsible for cerebrospinal fluid (CSF) production and regulation. Recent studies suggest that CSF serves as a drainage pathway for the brain metabolic wastes and toxins as part of the glymphatic system [1], and study of CP blood flow could provide insights into brain clearance mechanisms and related pathology such as Alzheimer’s disease. Arterial spin labeling (ASL) has been proposed to measure CP blood flow non-invasively [2]. In this study we developed an ASL sequence with higher spatial/temporal resolution and utilized a post-processing denoising method to enhance dynamic CP ASL signal. Quantified CP blood flow was evaluated in heathy subjects and one normal pressure hydrocephalus (NPH) patient and compared with water exchange rate (kw) across the blood-brain barrier (BBB).Methods
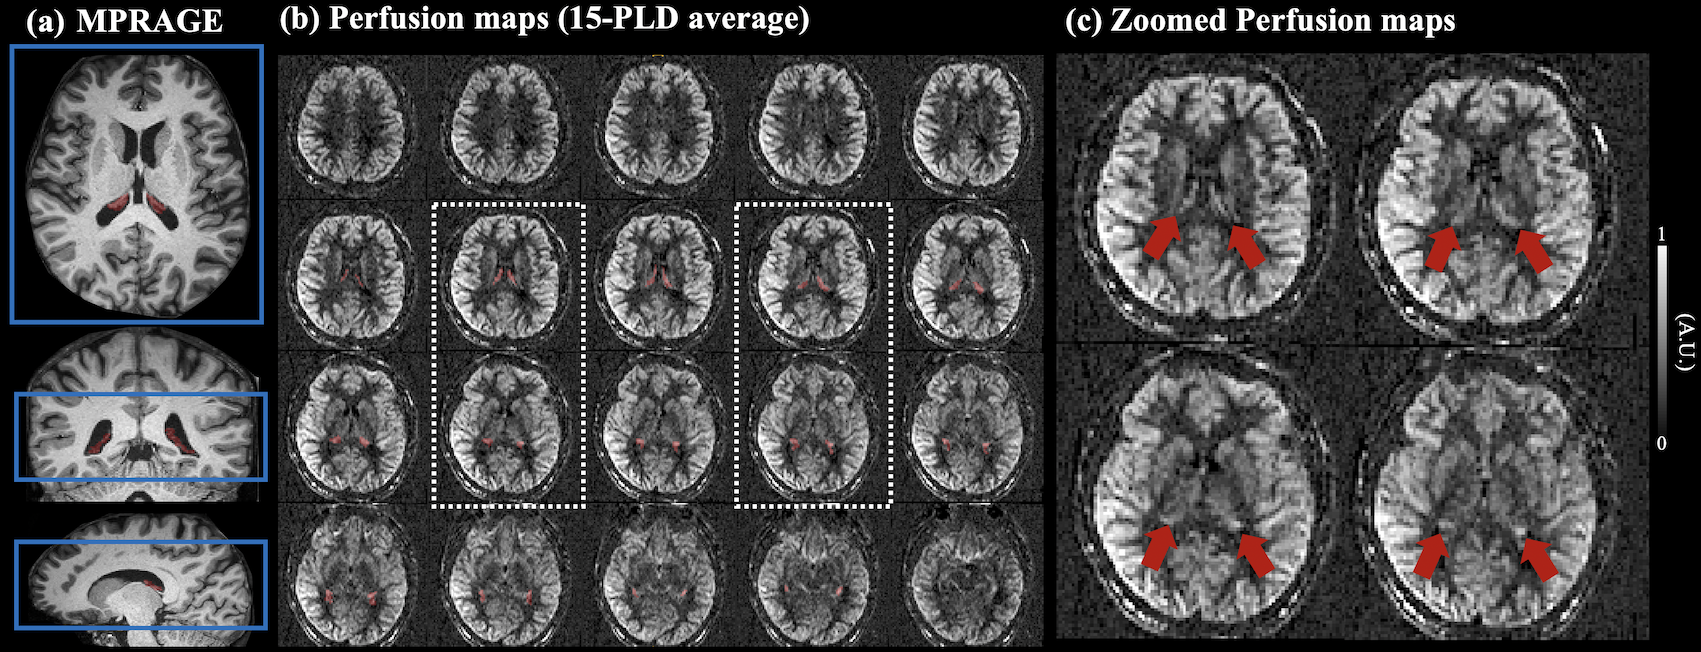
High resolution perfusion images were acquired by pseudo-continuous arterial spin labeling (pCASL) with three-dimensional (3D) gradient and spin-echo (GRASE) readout. Four healthy subjects (3 male, age=26.3±7.1 years) and one NPH patient (Female, age=85 years) underwent MRI on a Siemens 3T Prisma system (Erlangen, Germany) using a 32-channel head coil. Imaging parameters were: FOV=192mm, matrix size=96×96, 24 slices (10% oversampling) covering the third ventricle and two lateral ventricles, resolution= isotropic 2 mm3, 4 segments, TE=29ms, TR=4060ms, label duration (LD)=1500ms. One M0 image and one pair of label and control image was acquired at fifteen post-labeling delays (PLDs) from 500 ms to 2740 ms with an interval of 160 ms. Total acquisition time was 8min40sec. Regions of CP were manually segmented from T1 weighted MPRAGE images (isotropic 1 mm3) using ITK-SNAP [3], and volume of CP was calculated based on the segmentation. Positions of the GRASE volume and choroid plexus mask are shown in Fig.1(a).Control and label volumes at multiple PLDs were co-registered to M0 image and subtracted to generate dynamic perfusion images. A novel denoising algorithm termed k-space weighted image average (KWIA) was utilized to improve the SNR (2-fold increase) of dynamic perfusion signals through weighted average of high frequency k-space signal between adjacent time frames, while preserving spatiotemporal resolutions [4]. Blood flow, arterial transit time (ATT) and longitudinal relaxation time (T1,t) in gray matter (GM) and CP were quantified by fitting dynamic perfusion signals (ΔM) in each ROI to the following ASL model [2]:
$$\Delta M=2\cdot \alpha \cdot (M_0/\lambda)\cdot CBF \cdot T_{1,t} \cdot e^{-ATT/T_{1,t}}\cdot(e^{-max(PLD-ATT,0)/T_{1,t}}-e^{-max(PLD+LD-ATT,0)/T_{1,t}})......(1)$$
where α is labeling efficiency (0.8), λ is blood-brain partition coefficient (0.9ml/g), T1,a (1.6 secs) is longitudinal relaxation time of arterial blood.
A diffusion-prepared (DP) pCASL sequence (3.5×3.5×8mm3, 10 mins) was used to acquire kw map [5]. Whole brain average kw was calculated and compared with GM/CP blood flow and volume of CP.
Results and discussion
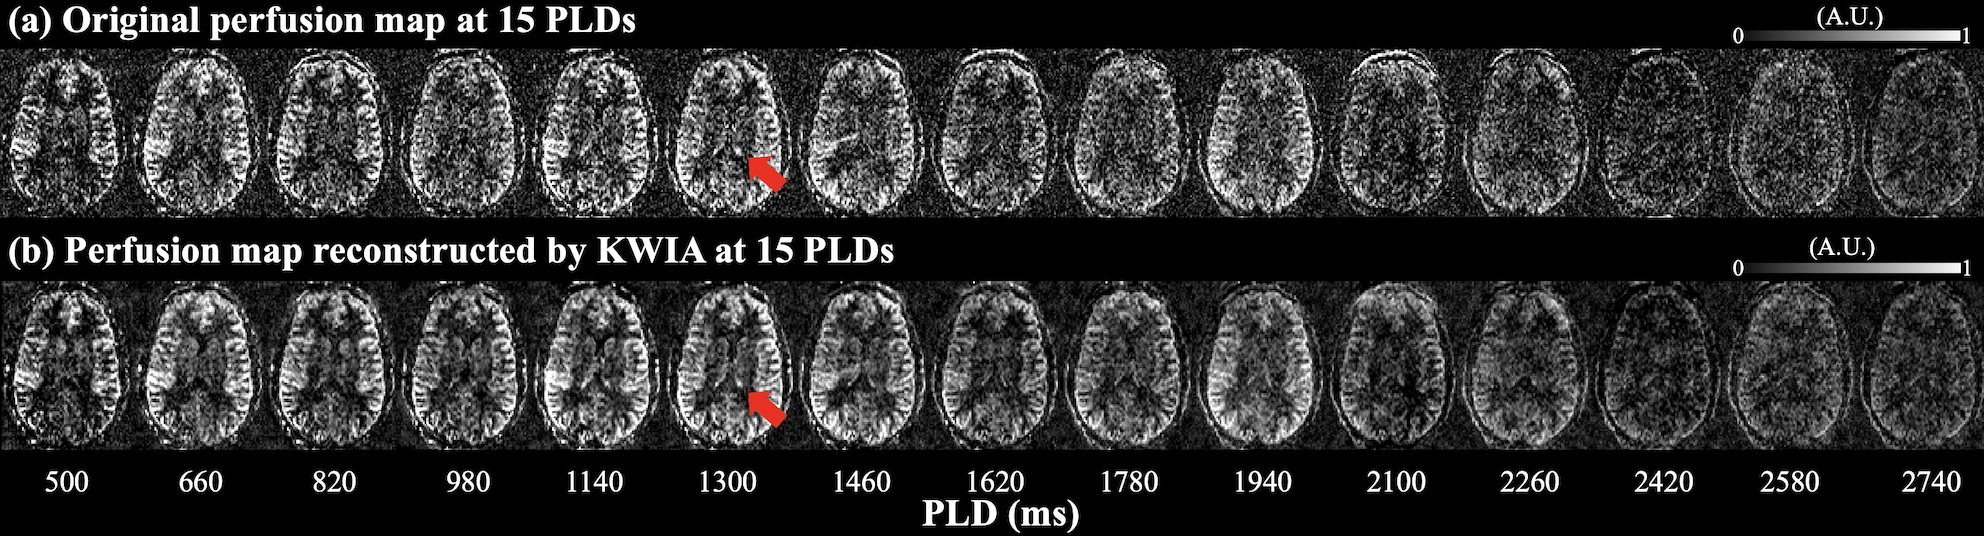
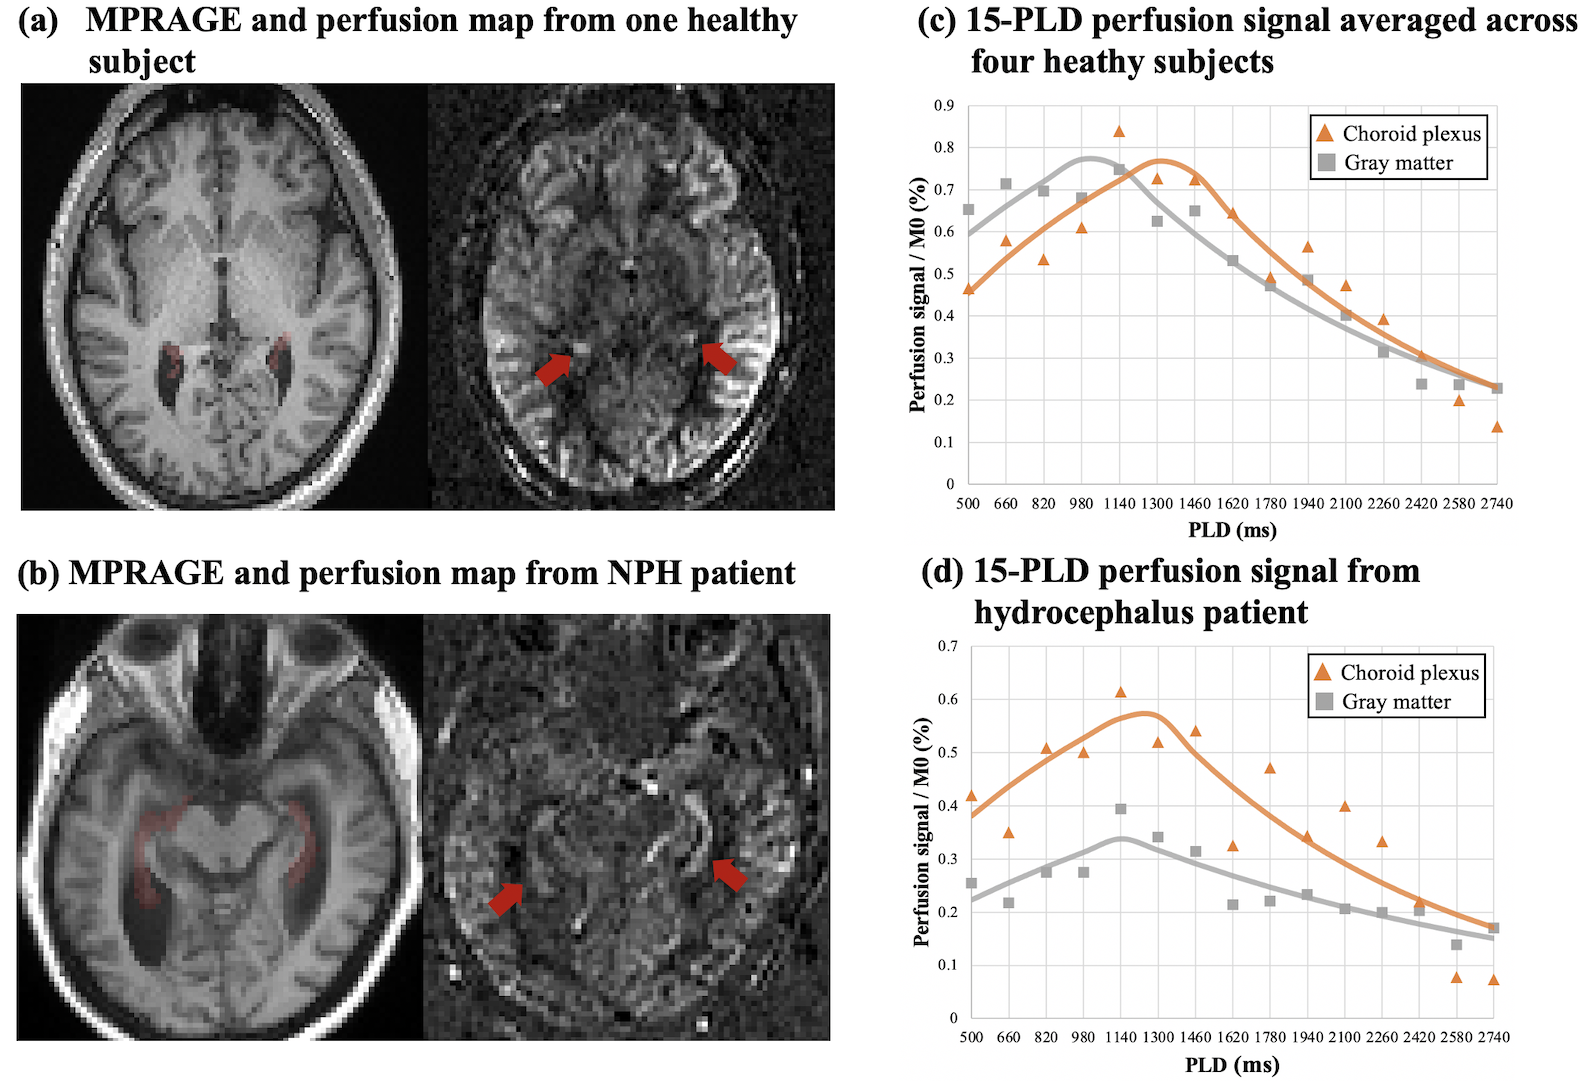
Figure 1 (b) shows center twenty slices of perfusion images averaged from fifteen PLDs, overlaid with CP mask. Figure 2 (c) shows four zoomed slices with regions of CP indicated by red arrows. Strong CP blood flow signal can be observed and matched well with the mask segmented from structural images. Figure 2 shows a center slice of dynamic perfusion images at fifteen PLDs obtained through direct subtraction (a) and KWIA filtering (b). High quality dynamic perfusion images were obtained with only one pair of label/control at each PLD. KWIA filtering further enhanced SNR without compromising the spatial/temporal resolution, and dynamic perfusion change in CP can be easily observed (red arrows).Figure 3 (a) and (b) show structural image and perfusion map from one healthy subject and the NPH patient. Enlarged ventricle as well as CP hyperplasia can be observed in the NPH patient. Volume of CP was 2.8±0.7 cm3 in healthy subjects and 3.96 cm3 in the NPH patient. Figure 3(c) and (d) show scatter plot of average perfusion signal and fitted curves in GM and CP averaged across four healthy subjects and in the NPH patient respectively.
Blood flow in GM and CP were comparable (57.8 versus 56.8 ml/100g/min) in heathy subjects, and markedly reduced (38.2 versus 28.8 ml/100g/min) in the NPH patient, as summarized in Table 1. However, CP flow was 32.6% higher than that of GM in the NPH patient, suggesting that relatively high CP blood flow might be associated with CSF overproduction in NPH.
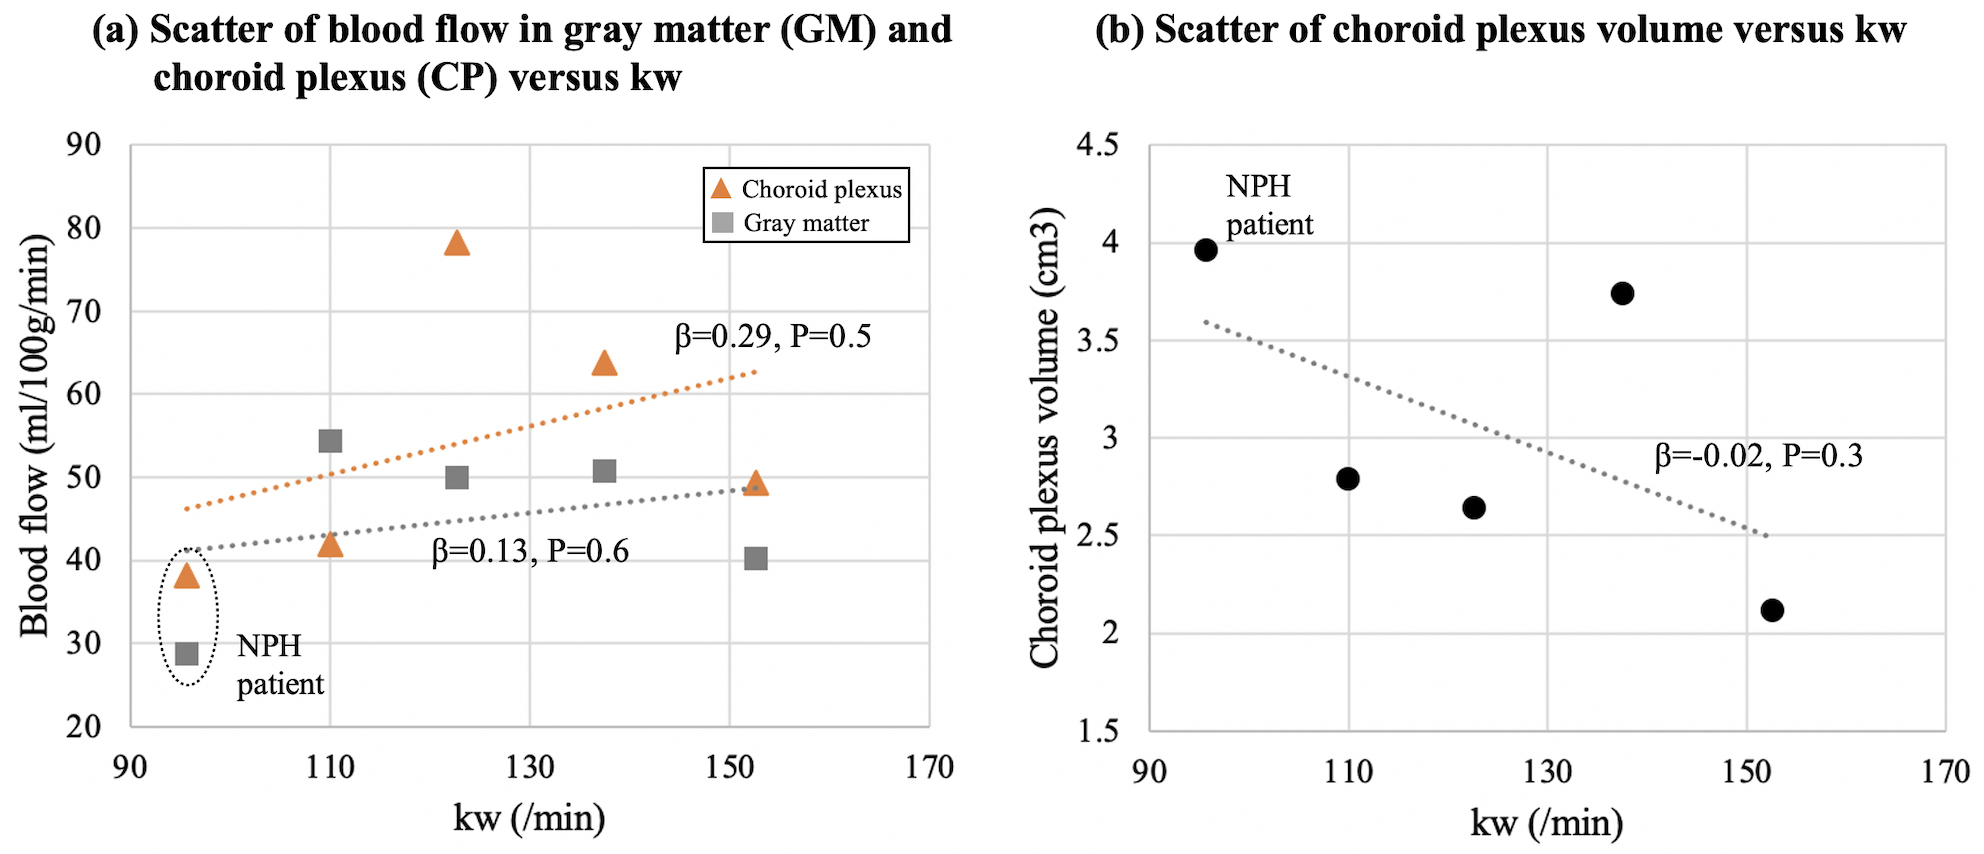
Figure 4 (a) and (b) show the scatter plot of GM/CP blood flow and CP volume versus kw. We found a more positive association/trend between CP blood flow and kw, and a negative trend between CP volume and kw, which indicate water exchange across BBB may be associated with CSF regulation and glymphatic function.
Conclusion
We proposed a high-resolution multi-delay pCASL sequence and KWIA denoising algorithm to reliably measure dynamic blood flow signal in CP. Our preliminary results show that CP blood flow may be altered in NPH and has a potential relation with water exchange rate across the BBB.Acknowledgements
This work was supported by National Institute of Health (NIH) grant UH3-NS100614, R01-NS114382 and R01-EB028297.References
[1] Jessen, Nadia Aalling, et al. "The glymphatic system: a beginner’s guide." Neurochemical research 40.12 (2015): 2583-2599.
[2] Zhao, Li, et al. "Non-invasive measurement of choroid plexus apparent blood flow with arterial spin labeling." Fluids and Barriers of the CNS 17.1 (2020): 1-11.
[3] Yushkevich, Paul A., et al. "User-guided 3D active contour segmentation of anatomical structures: significantly improved efficiency and reliability." Neuroimage 31.3 (2006): 1116-1128.
[4] Zhao, Chenyang, et al. "Low Dose CT Perfusion With K-Space Weighted Image Average (KWIA)." IEEE transactions on medical imaging (2020) ;39:3879-3890.
[5] Shao, Xingfeng, et al. "Mapping water exchange across the blood–brain barrier using 3D diffusion‐prepared arterial spin labeled perfusion MRI." Magnetic resonance in medicine 81.5 (2019): 3065-3079.
Figures