2360
Assessment of cerebral white matter hemodynamics across the adult lifespan1Athinoula A. Martinos Center for Biomedical Imaging, Massachusetts General Hospital, Charlestown, MA, United States, 2Radiology, Harvard Medical School, Boston, MA, United States, 3Center for Magnetic Resonance Research, University of Minnesota, Minneapolis, MN, United States, 4Psychology, Harvard University, Cambridge, MA, United States
Synopsis
Arterial spin labeling (ASL) approaches for measuring perfusion are challenging in white matter due in part to longer blood arrival times. We implemented a cross-correlation-based processing approach on multi-delay ASL data acquired in Human Connectome Project-Aging (HCP-A) to quantify white matter arterial transit time (ATT) and used these ATT values to analytically compute white matter CBF. Using this approach, we found that white matter CBF decreases (ρ=0.39) and white matter ATT elongates (ρ=0.42) with increasing age (p<0.001). We also found that CBF and ATT values are spatially heterogeneous, with periventricular white matter exhibiting the lowest CBF and longest ATT.
Introduction
Arterial spin labeling (ASL) is routinely used to study cerebral blood flow (CBF) in gray matter. However, measuring white matter hemodynamics with ASL is more challenging, due in part to longer arterial transit times (ATT) that contribute to low signal-to-noise ratios. Moreover, acquisition parameters, including post-labeling delay (PLD), are often optimized for gray matter, and conventional processing may not be well-positioned to quantify white matter ATT in these cases. The purpose of this study was (i) to implement a robust cross-correlation-based approach for quantifying white matter ATTs from multi-PLD ASL and (ii) to assess how white matter CBF and ATT change in a large cohort of typically aging adults.Methods
Participants. 3T MRI data (Siemens) were acquired as part of the Human Connectome Project-Aging (HCP-A)1-3, and participants (MGH local sample; n=234) provided informed, written consent for this study.Data acquisition. MR images were acquired using a 32-channel coil. ASL data were acquired4 using a labeling duration (τ)=1500 ms and PLDs=200, 700, 1200, 1700, and 2200 ms. Signal readout was performed using 2D EPI with TR/TE=3580/19 ms, multi-band factor=6, and resolution=2.5x2.5x2.5 mm3. Equilibrium magnetization (M0) images for normalization and a pair of spin-echo EPI images for distortion correction were also acquired. T1-weighted imaging was performed for co-registration and tissue segmentation using multi-echo MPRAGE and with the following parameters: TR/TI= 2500/1000 ms; spatial resolution = 0.8x0.8x0.8 mm3; echoes=4.
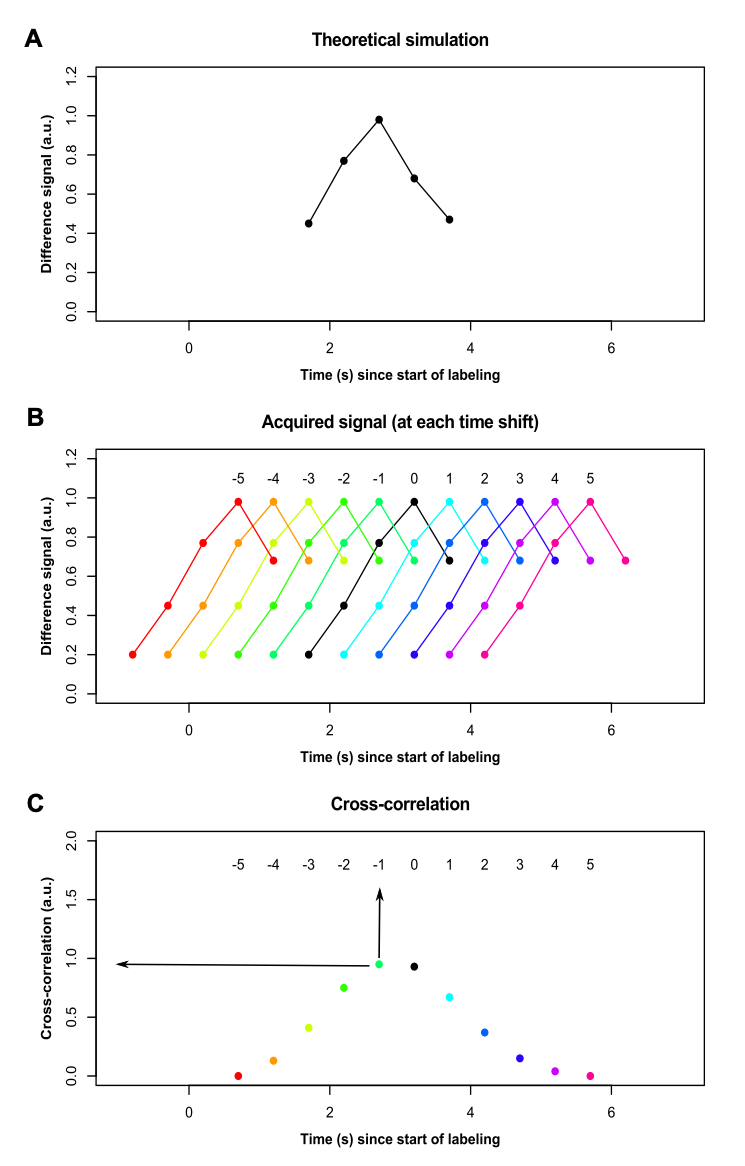
Data processing. ASL data were corrected for distortion (TopUp; FSL) and for motion (using in-house motion correction routines). ATT values were calculated through a normalized cross-correlation analysis of the acquired signal with a time course obtained through simulation of the flow-modified Bloch equation5 with known ATT=1.2s (Figure 1A). Acquired signal time courses in each voxel were shifted in time (Figure 1B), and the time shift at which the maximum correlation between acquired and simulated signal was recorded (Figure 1C). Voxels with shift=0 were assigned ATT=1.2s. Voxels with positive time shifts were assigned shorter ATTs according to the magnitude of the shift: ATT=0.7s (shift=+1) and ATT=0.2s (time shift=+2). Voxels with negative time shifts were assigned longer ATTs: ATT=1.7s (shift=-1), ATT=2.2s (shift=-2), ATT=2.7s (shift=-3), and ATT=3.2s (shift=-4). Voxels with the remaining shift indices were assigned ATT=3.7s. CBF values were calculated at each PLD using a two-compartment model6, and final CBF maps were derived as the average of the CBF values at each PLD where PLD+τ>ATT.
Hemodynamic physiology. Mean CBF and ATT were computed using whole gray and white matter tissue masks (generated with FreeSurfer) and also subregions including cortical and subcortical gray matter and juxtacortical and periventricular white matter. Continuous variables were compared using Wilcoxon rank-sum (for unpaired comparisons) or signed-rank tests (for paired comparisons). Associations were assessed using Spearman’s correlation. Statistical tests were performed at a 0.05 significance level.
Results
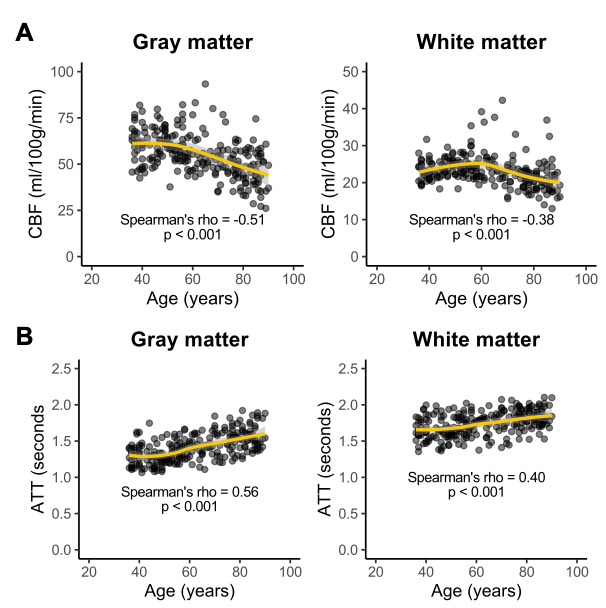
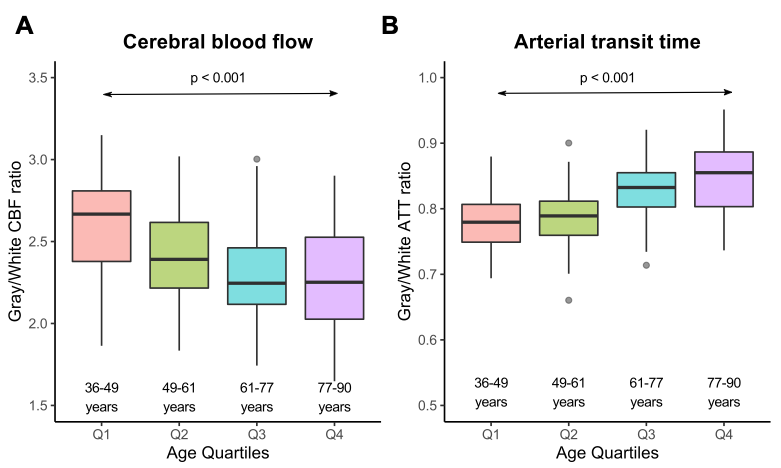
Changes with aging. CBF was inversely associated with age, and older age correlated with lower CBF in both gray (ρ=-0.51; p<0.001) and white (ρ=-0.38; p<0.001) matter (Figure 2A). However, white matter CBF increased into late middle-age, while gray matter CBF plateaued in this period, prior to a steady decrease. ATT was directly associated with age, and older age correlated with longer ATT in both gray (ρ=0.56; p<0.001) and white (ρ=0.40; p<0.001) matter (Figure 2B).Differences between gray and white matter. CBF in gray matter was higher than CBF in white matter in participants across all ages (Figure 3A), while ATT was longer in white matter than in gray matter across all ages (Figure 3B). The ratio of gray-to-white matter CBF decreased with age (p<0.001), with the youngest subjects exhibiting the highest ratio (ratio=2.67) and the oldest subjects exhibiting the lowest ratio (ratio=2.25). The ratio of gray-to-white matter ATT increased with age (p<0.001), with the youngest subjects exhibiting the lowest ratio (ratio=0.78) and the oldest subjects exhibiting the lowest ratio (ratio=0.85).
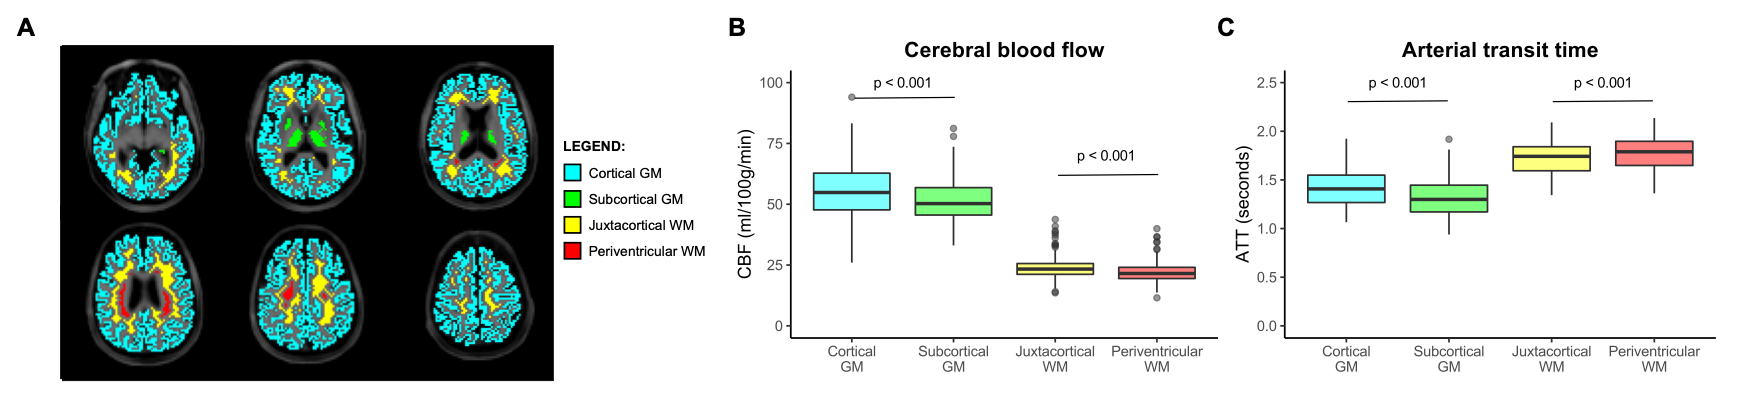
Tissue subtypes. Cortical gray matter exhibited a higher CBF and longer ATTs compared to subcortical gray matter (p<0.001; Figure 4B). Periventricular white matter exhibited a lower CBF and longer ATTs compared to juxtacortical white matter (p<0.001; Figure 4C).
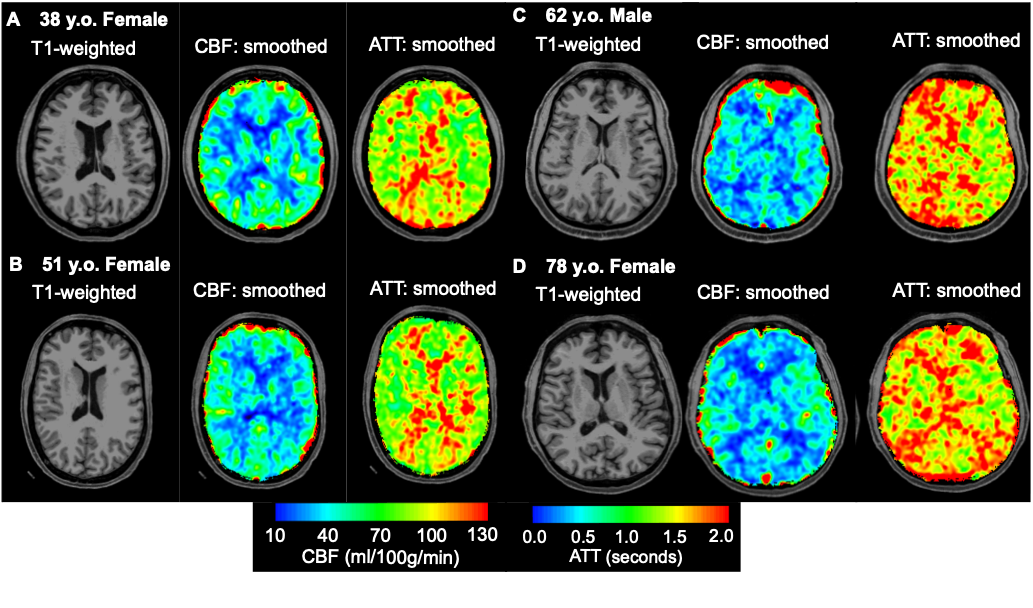
Representative examples showing that group-level differences in CBF and ATT across different age groups can also be visualized at the individual level are shown in Figure 5.
Discussion
Decreasing gray matter CBF with increasing age has been previously reported with ASL, and our gray matter CBF values are in good agreement with prior reports in middle-aged to older adults7,8. However, fewer studies using ASL-MRI have reported on changes in white matter CBF with aging. Here, we have shown that white matter CBF also significantly decreases with increasing age but with distinct patterns compared to gray matter. We have also shown that white matter ATTs elongate with increasing age and that white matter ATT is consistently higher than in gray matter. These findings may be relevant for identifying mechanisms that contribute to increased risk for hemodynamic compromise in older adults and also for guiding the choice of PLD in single-delay ASL experiments in older populations. Finally, we observed that periventricular white matter exhibits the lowest CBF and longest ATTs, which could indicate the vulnerability of this region to ischemic damage9.Acknowledgements
This study was supported by the National Institutes of Health (U01AG052564) and by the American Heart Association (19CDA34790002).References
1. Bookheimer SY, Salat DH, Terpstra M, Ances BM, Barch DM, Buckner RL, et al. The lifespan human connectome project in aging: An overview. Neuroimage. 2019;185:335-348
2. Harms MP, Somerville LH, Ances BM, Andersson J, Barch DM, Bastiani M, et al. Extending the human connectome project across ages: Imaging protocols for the lifespan development and aging projects. Neuroimage. 2018;183:972-984
3. Somerville LH, Bookheimer SY, Buckner RL, Burgess GC, Curtiss SW, Dapretto M, et al. The lifespan human connectome project in development: A large-scale study of brain connectivity development in 5-21 year olds. Neuroimage. 2018;183:456-468
4. Li X, Wang D, Moeller S, Wang D, Chappell M, Yacoub E, et al. Pushing the limits of asl imaging for the lifespan human connectome projects. International Society for Magnetic Resonance Imaging. 2018
5. Juttukonda MR, Jordan LC, Gindville MC, Davis LT, Watchmaker JM, Pruthi S, et al. Cerebral hemodynamics and pseudo-continuous arterial spin labeling considerations in adults with sickle cell anemia. NMR Biomed. 2017;30
6. Fan AP, Guo J, Khalighi MM, Gulaka PK, Shen B, Park JH, et al. Long-delay arterial spin labeling provides more accurate cerebral blood flow measurements in moyamoya patients: A simultaneous positron emission tomography/mri study. Stroke. 2017;48:2441-2449
7. Parkes LM, Rashid W, Chard DT, Tofts PS. Normal cerebral perfusion measurements using arterial spin labeling: Reproducibility, stability, and age and gender effects. Magn Reson Med. 2004;51:736-743
8. Biagi L, Abbruzzese A, Bianchi MC, Alsop DC, Del Guerra A, Tosetti M. Age dependence of cerebral perfusion assessed by magnetic resonance continuous arterial spin labeling. J Magn Reson Imaging. 2007;25:696-702
9. De Reuck J. The human periventricular arterial blood supply and the anatomy of cerebral infarctions. Eur Neurol. 1971;5:321-334
Figures