2359
An investigation of the change in water diffusivity along the perivascular space in hypertensive patients1Department of Radiology, Juntendo University School of Medicine, Bunkyo-ku, Japan, 2Department of Innovative Biomedical Visualization, Graduate School of Medicine, Nagoya University, Nagoya, Japan, 3Department of Diagnostic Radiology and Radiation Oncology, Graduate School of Medicine, Chiba University, Chiba, Japan, 4Sportology Center, Juntendo University School of Medicine, Bunkyo-ku, Japan, 5Department of Metabolism & Endocrinology, Juntendo University School of Medicine, Bunkyo-ku, Japan, 6Department of Radiology, Nagoya University Graduate School of Medicine, Nagoya, Japan
Synopsis
We used the analysis along the perivascular space (ALPS) index, which has been suggested as a noninvasive method to measure water diffusivity along the perivascular space in vivo. We assessed the change in water diffusivity in living patients with hypertension for the first time.
Introduction
The glymphatic system is a waste drainage system in the brain, which involves the movement of the cerebrospinal fluid along the perivascular space1-3. It is presumed that obstruction of the glymphatic system can occur with various pathological conditions, including Alzheimer’s disease, hydrocephalus, and diabetes in human beings4-6. Concerning the change of glymphatic function in hypertensive condition, Mortensen et al. demonstrated the suppression of the glymphatic system in spontaneously hypertensive rats7. However, the alteration of glymphatic function by disease is poorly certified due to difficulties in quantification. Taoka et al. advocated that the analysis along the perivascular space (ALPS) index was a noninvasive method, which could measure the change in water diffusivity along the perivascular space in vivo4. Our purpose was to investigate the change in water diffusivity along the perivascular space in hypertensive patients.Methods
The Bunkyo Health study enrolled 126 citizens with or without hypertension (HT) (right-handed, 50 males and 76 females, mean age ± SD: 72.16 ± 5.17 years) (Fig.1). Diffusion-weighted imaging (DWI) was acquired on a 3T MR scanner (Magnetom Prisma, Siemens Healthcare, Erlangen, Germany). Echo planar imaging consisting of b value (1000 s/mm²) along 64 isotropic diffusion gradients was acquired in the anterior–posterior phase-encoding direction. DWI data were analyzed with FSL version 6.0. Diffusivity maps in the direction of the x-axis (= right-left) (Dx), y-axis (= anterior -posterior) (Dy), and z-axis (= inferior-superior) (Dz) were calculated5. The Dx corresponds to the direction of the deep white matter vessels in the periventricular white matter. The glymphatic system is present along these deep white matter vessels. Therefore, the Dx is assumed to reflect the water diffusivity along the glymphatic system in part. The fractional anisotropy (FA) map of all individuals was converted into FMRIB space using both linear and nonlinear transformations. The subject with the smallest degree of warping was selected. Using this subject’s color-coded FA map at the level of the left lateral ventricle body, we placed a 5-mm-diameter spherical region of interest (ROI) in the projection and association areas (Fig.2). In the projection area, the dominant fibers run in the direction of the z-axis, and both the x- and y-axes are perpendicular to the dominant fibers. In the association area, the dominant fibers run in the direction of the y-axis, and both the x- and z-axes are perpendicular to the dominant fibers. The ROI was replicated on the diffusivity maps of all individuals in FMRIB space. We measured the x-, y- and z-axes diffusivity within the ROI. Then, the ALPS index was calculated for each case. This index is a ratio of the mean of the x-axis diffusivity in the projection area (Dxproj) and the x-axis diffusivity in the association area (Dxassoc) to the mean of the y-axis diffusivity in the projection area (Dyproj) and the z-axis diffusivity in the association area (Dzaccoc) as follows: ALPS index = mean (Dxproj, Dxassoc) / mean (Dyproj, Dzassoc)4. The statistical analysis was performed using SPSS version 27.0, and the ALPS indices in the control and HT groups were compared using an unpaired t-test. In addition, we estimated the correlations between the ALPS indices and the values of the maximum, minimum, and average blood and pulse pressures. A p value < 0.05 was considered significant.Result
The ALPS index in HT group was significantly lower than that in the control group (Fig.3). We also investigated the negative correlations between the ALPS indices and the values of the maximum, minimum, and average blood and pulse pressures (Fig.4).Discussion
In this study, the ALPS index was decreased in hypertensive patients. Taoka et al. defined that a decrease in the ALPS index represented a relative decrease of the water diffusivity along the perivascular space4. The glymphatic system is present along the deep white matter vessels, so a decrease of the water diffusivity along the perivascular space may reflect an obstruction of the glymphatic system. Concerning the change of glymphatic function in hypertensive condition, a previous study investigated the suppression of the glymphatic system in spontaneously hypertensive rats using dynamic contrast-enhanced MRI7. In addition, the values for the maximum, minimum, and average blood and pulse pressures were negatively correlated with the ALPS index in this study. A high value for the average blood pressure is caused by arteriosclerosis in the peripheral arteries. A high value for the pulse pressure indicates arteriosclerosis of the central arteries. Therefore, a decrease in the ALPS index could reflect aggravation of the hemodynamics caused by arteriosclerosis.Conclusion
We evaluated the change in water diffusivity along the perivascular space in living patients with hypertension for the first time.Acknowledgements
This work is supported by the Strategic Research Foundation at Private Universities (S1411006) and KAKENHI (18H03184) from the Ministry of Education, Culture, Sports, Science and Technology of Japan.References
- Iliff JJ, Wang M, Liao Y, et al. A paravascular pathway facilitates CSF flow through the brain parenchyma and the clearance of interstitial solutes, including amyloid beta. Sci Transl Med. 2012;4(147):147ra111.
- Jessen NA, Munk AS, Lundgaard I, Nedergaard M. The Glymphatic System: A Beginner's Guide. Neurochem Res. 2015;40(12):2583-2599.
- Iliff JJ, Lee H, Yu M, et al. Brain-wide pathway for waste clearance captured by contrast-enhanced MRI. J Clin Invest. 2013;123(3):1299-1309.
- Taoka T, Masutani Y, Kawai H, et al. Evaluation of glymphatic system activity with the diffusion MR technique: diffusion tensor image analysis along the perivascular space (DTI-ALPS) in Alzheimer's disease cases. Jpn J Radiol. 2017;35(4):172-178.
- Yokota H, Vijayasarathi A, Cekic M, et al. Diagnostic Performance of Glymphatic System Evaluation Using Diffusion Tensor Imaging in Idiopathic Normal Pressure Hydrocephalus and Mimickers. Curr Gerontol Geriatr Res. 2019;2019:5675014.
- Yang G, Deng N, Liu Y, Gu Y, Yao X. Evaluation of Glymphatic System Using Diffusion MR Technique in T2DM Cases. Front Hum Neurosci. 2020;14:300.
- Mortensen KN, Sanggaard S, Mestre H, et al. Impaired Glymphatic Transport in Spontaneously Hypertensive Rats. J Neurosci. 2019;39(32):6365-6377.
Figures
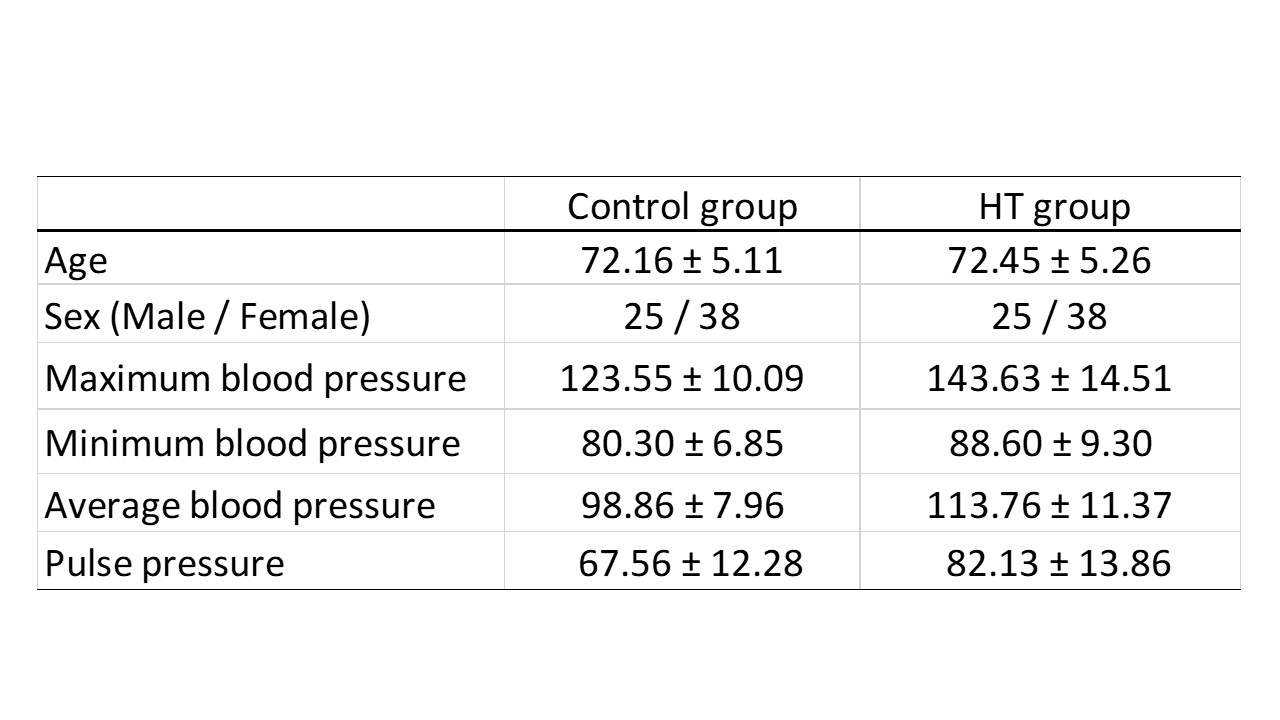
Fig.1. Demographic characteristics of the participants
Data are presented as mean ± standard deviation.
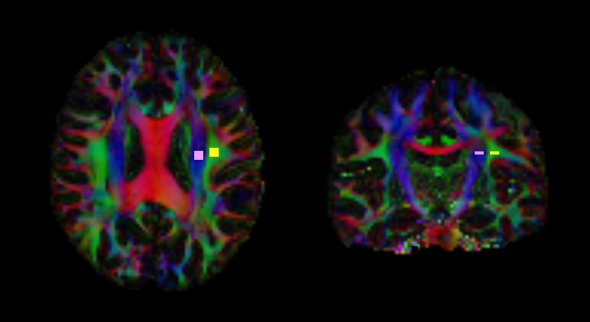
Fig.2. Region of interest (ROI) placement for the manual-based ALPS index
A 5-mm-diameter spherical ROI was placed in the projection and association areas.
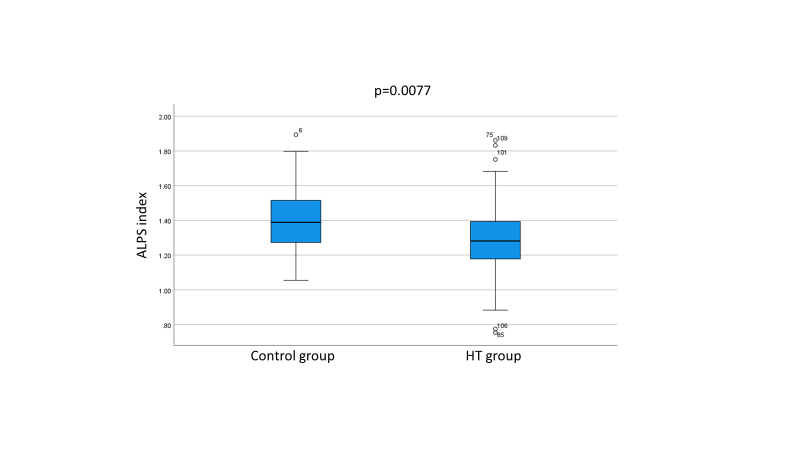
Fig.3. The Box plot of the ALPS index
The ALPS index in the HT group was significantly lower than that in the control group (p value < 0.05).
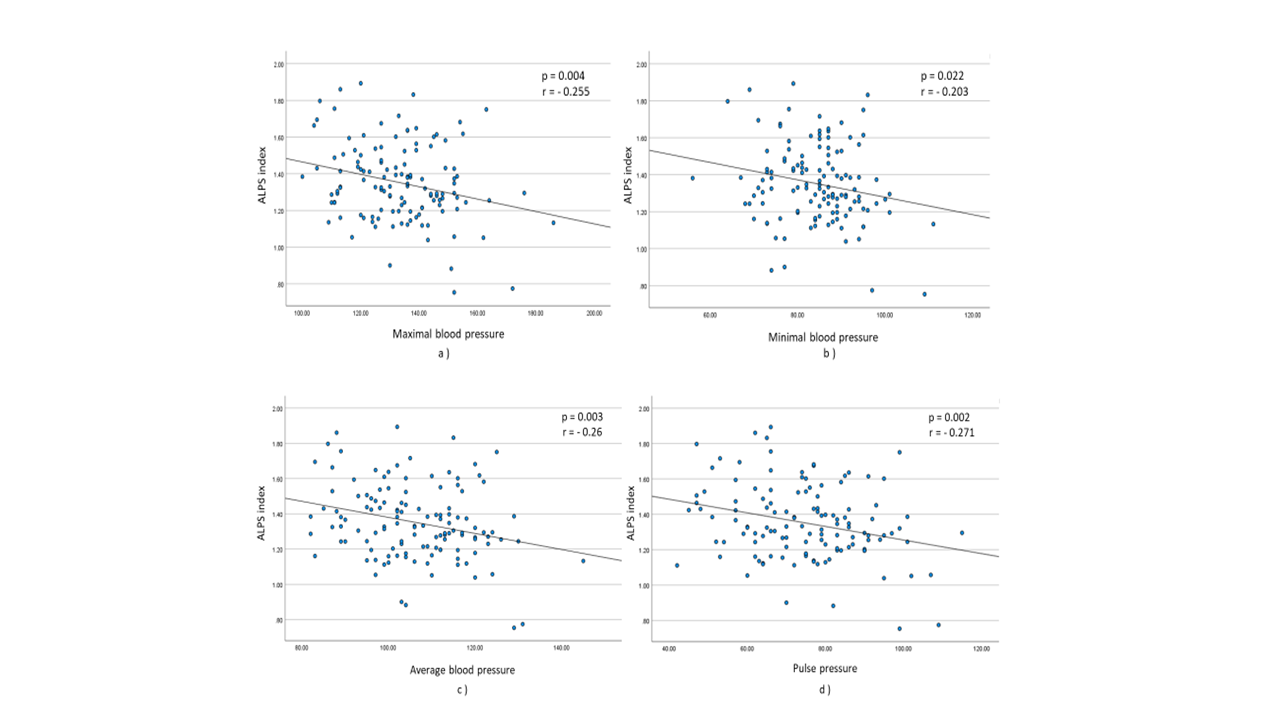
Fig.4. Scatter plots show
a) the correlation between the ALPS index and the value of the maximum blood pressure
b) the correlation between the ALPS index and the value of the minimum blood pressure
c) the correlation between the ALPS index and the value of the average blood pressure
d) the correlation between the ALPS index and the value of the pulse pressure.