2357
Multimodal MRI/MRS evaluation of treatment response in a patient-derived xenograft model of Ewing sarcoma
Puneet Bagga1, Jeffrey Steinberg2, Walter Akers2, Matthew Scoggins1, Zoltan Patay1, Beth McCarville1, Burkhard Hoeckendorf3, Khaled Khairy3, Michael Dyer3, and Beth Stewart3
1Department of Diagnostic Imaging, St Jude Children's Research Hospital, Memphis, TN, United States, 2Center for In Vivo Imaging and Therapeutics (CIVIT), St Jude Children's Research Hospital, Memphis, TN, United States, 3Department of Developmental Neurobiology, St Jude Children's Research Hospital, Memphis, TN, United States
1Department of Diagnostic Imaging, St Jude Children's Research Hospital, Memphis, TN, United States, 2Center for In Vivo Imaging and Therapeutics (CIVIT), St Jude Children's Research Hospital, Memphis, TN, United States, 3Department of Developmental Neurobiology, St Jude Children's Research Hospital, Memphis, TN, United States
Synopsis
A recent development in multi-modality treatment with poly ADP-ribose polymerase inhibitors (PARPi’s) combined with DNA damaging agents (temozolomide), is increasingly recognized as an important approach for curing or prolonging survival in patients with recurrent Ewing sarcoma (EWS). In this study, we employed multimodal quantitative imaging methods to predict treatment response in EWS. We used T2-weighted MRI, diffusion-weighted MRI, and 1H MRS in a patient derived xenograft model of EWS. We envisage that multi-parametric MR indices will be able to evaluate the treatment response and predict treatment response in the tumors.
Intorduction
Ewing sarcoma (EWS) is a tumor of the bone and surrounding soft tissue that is most prevalent in adolescents and young adults1. For newly diagnosed EWS patients and patients with recurrent disease, imaging is essential for decision-making regarding the timing of surgery and radiation and to evaluate treatment response2,3. Unfortunately, it has been particularly challenging in this patient population to establish imaging measures of tumor response using conventional MRI, CT, or radiography in order to distinguish patients that will have progressive or recurrent disease from those with more favorable responses4-6. One reason for this is that the extracellular osseous component of EWS tumors often does not change in size on imaging even though tumor cells may have died. Previously, we reported that the combination of PARPi’s (TAL) with DNA damaging agents (IRN/TMZ) was highly effective against EWS in patient-derived xenograft (PDX) models and patients7,8. In this exploratory study, we performed quantitative MRI and 1H MR spectroscopy to 1) assess intratumoral treatment-related changes in a PDX model of EWS, 2) find predictive biomarkers of the treatment response in the PDX model, and 3) combine multi-modal quantitative MRI to predict response in EWS. The MRI findings were also correlated with in vivo bioluminescence imaging. The tumor cells are luciferase labeled to aid in quantifying the tumor burden using bioluminescence.Material and Methods
EWS orthotopic xenografts were created by injecting ES-8-luciferase and EW-8-luciferase labeled cells into the bone marrow of recipient CD-1 nude mice via intra-femoral injection. We used two groups of mice in this study 1) placebo and 2) TAL+IRN+TMZ.Bioluminescence studies
Mice were given intraperitoneal injections of Firefly D-luciferin (Perkin Elmer, Waltham, MA, 3 mg/mouse). Bioluminescence images were taken five minutes later using the IVIS Spectrum imaging system (Perkin Elmer). Anesthesia was administered throughout image acquisition (isoflurane 1.5% in O2 delivered at 1 L/min). Region of interest (ROI) encompassing the largest tumor at maximal bioluminescence signal was generated by using a custom script. Briefly, the pixels that have a higher value than 5*standard deviation + mean signal intensity are flagged, and a circle is drawn around the centroid of any larger region identified thereby. The ROIs were used to determine the average radiance (photons/s/cm2/sr) for all xenografts. Mice were enrolled in the study when measured signals reached average radiance values of 1x10⁷ or higher.
MRI/MRS studies
For MRI/MRS scans, the mice identified with optical imaging experiments to be carrying tumors underwent anatomical scans (T2-weighted MRI), Diffusion-weighted imaging (DWI), and proton MR spectroscopy (1H MRS) scans. T2-weighted MRI was performed with the following parameters: TR/TE = 3750/41 ms, FOV = 25x25 mm2, matrix size=256x256, slice thickness=0.7 mm. Multi-b-value DWI was performed with 2-grade B values using a spin-echo sequence (0, 1000 s/mm2, TR=3500 ms, TE=30 ms, FOV = 26x30 mm2, slice thickness=1 mm, slices=5). 1H MRS was performed with the following parameters: PRESS, TR/TE=3000/11 ms, voxel size = 4.5x4.0x4.5 mm3, SW = 2900 Hz.
Results and Discussion
Figure 1 shows the longitudinally acquired bioluminescence signal, representing the tumor burden of a mouse from both the treatment and control groups. The left panel depicts a longitudinal reduction of the tumor size, demonstrating efficacy, in a TAL+IRN+TMZ treated mouse, while the right panel shows a noteworthy increase in tumor volume of the untreated mouse. Figure 2A shows T2-weighted MRI images and ADC maps of the same mice confirming the findings with optical imaging experiments. ADC values in the tumors of untreated mice were found to decrease over the duration of observation, while those of the treated group showed a gradual elevation until the 21st day where the tumor ROI ADC values matched the surrounding healthy tissue (Figure 2C). Lastly, in vivo 1H MRS showed a clearly distinct pattern of spectral evolution with and without treatment in the same mice (Figure 3). While in the treated group the total choline (tCho) and macromolecular lipid (-CH2- @1.3 ppm and -CH3 @0.9 ppm) peaks9 were found to reduce gradually, the untreated group showed an opposite pattern of increase in the macromolecular/tCho peak amplitude. Interestingly, the tCho peak in the untreated group was found to increase until Day 7 before becoming undetectable. We hypothesize that this is due to the higher signal from lipid -CH2- and -CH3 peaks. Further quantification with water referencing is being currently performed to evaluate the level of each metabolite/macromolecule during the course of tumor progression/treatment response. In conclusion, in this ongoing study, we are effectively applying multi-modal MR to study and hopefully predict the treatment response in the PDX model of EWS.Acknowledgements
No acknowledgement found.References
- Smith, M. A., Altekruse, S. F., Adamson, P. C., Reaman, G. H. & Seibel, N. L. Declining childhood and adolescent cancer mortality. Cancer 120, 2497-2506, doi:10.1002/cncr.28748 (2014).
- Murphey, M. D. et al. From the radiologic pathology archives: ewing sarcoma family of tumors: radiologic-pathologic correlation. Radiographics : a review publication of the Radiological Society of North America, Inc 33, 803-831, doi:10.1148/rg.333135005 (2013).
- Biswas, B. & Bakhshi, S. Management of Ewing sarcoma family of tumors: Current scenario and unmet need. World journal of orthopedics 7, 527-538, doi:10.5312/wjo.v7.i9.527 (2016).
- Kransdorf, M. J. & Smith, S. E. Lesions of unknown histogenesis: Langerhans cell histiocytosis and Ewing sarcoma. Seminars in musculoskeletal radiology 4, 113-125, doi:10.1055/s-2000-6859 (2000).
- O'Keeffe, F., Lorigan, J. G. & Wallace, S. Radiological features of extraskeletal Ewing sarcoma. The British journal of radiology 63, 456-460, doi:10.1259/0007-1285-63-750-456 (1990).
- van der Woude, H. J., Bloem, J. L. & Hogendoorn, P. C. Preoperative evaluation and monitoring chemotherapy in patients with high-grade osteogenic and Ewing's sarcoma: review of current imaging modalities. Skeletal radiology 27, 57-71, doi:10.1007/s002560050339 (1998).
- Stewart, E. et al. Targeting the DNA repair pathway in Ewing sarcoma. Cell Rep 9, 829-841, doi:10.1016/j.celrep.2014.09.028 (2014).
- Federico, S. M. et al. A phase I trial of talazoparib and irinotecan with and without temozolomide in children and young adults with recurrent or refractory solid malignancies. European journal of cancer (Oxford, England : 1990) 137, 204-213, doi:10.1016/j.ejca.2020.06.014 (2020).
- Delikatny EJ et al., MR-visible lipids and the tumor microenvironment. NMR in Biomedicine, (2011).
Figures
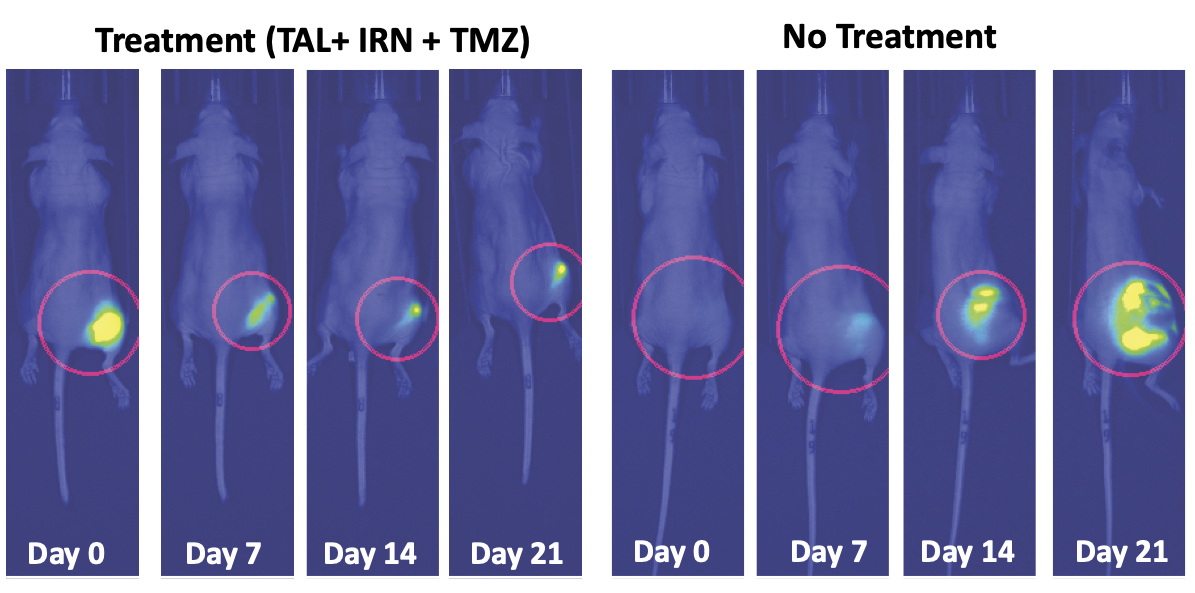
Figure 1. Bioluminescence images in the representative TAL + IRN + TMZ treated and placebo (no treatment) mice showing gradually reducing tumor luciferase activity and hence the tumor size in the treatment group
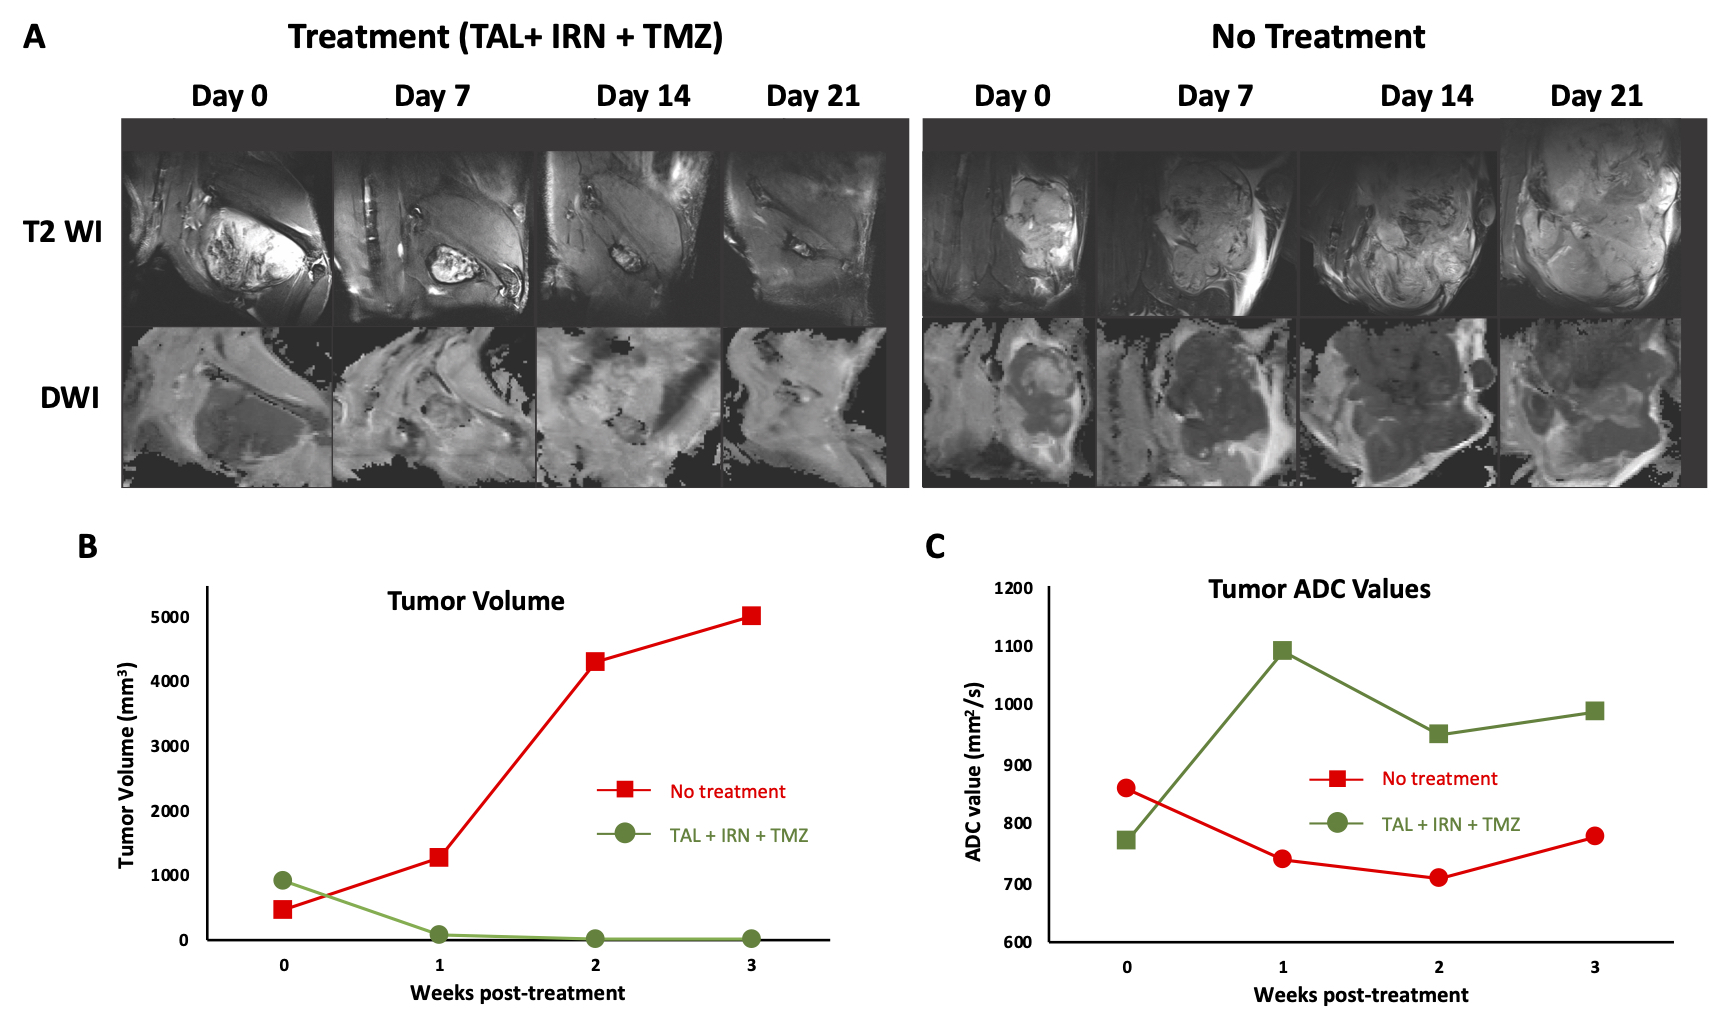
Figure 2. A) T2- and Diffusion-weighted images in the representative TAL + IRN + TMZ treated and untreated mice. Anatomical images indicate the increase in tumor size of the untreated mouse while the tumor is barely visible in the treatment group. B) Measured tumor volume from the multi-slice T2-weighted MRI, and C) measured tumor ROI ADC values in both groups.
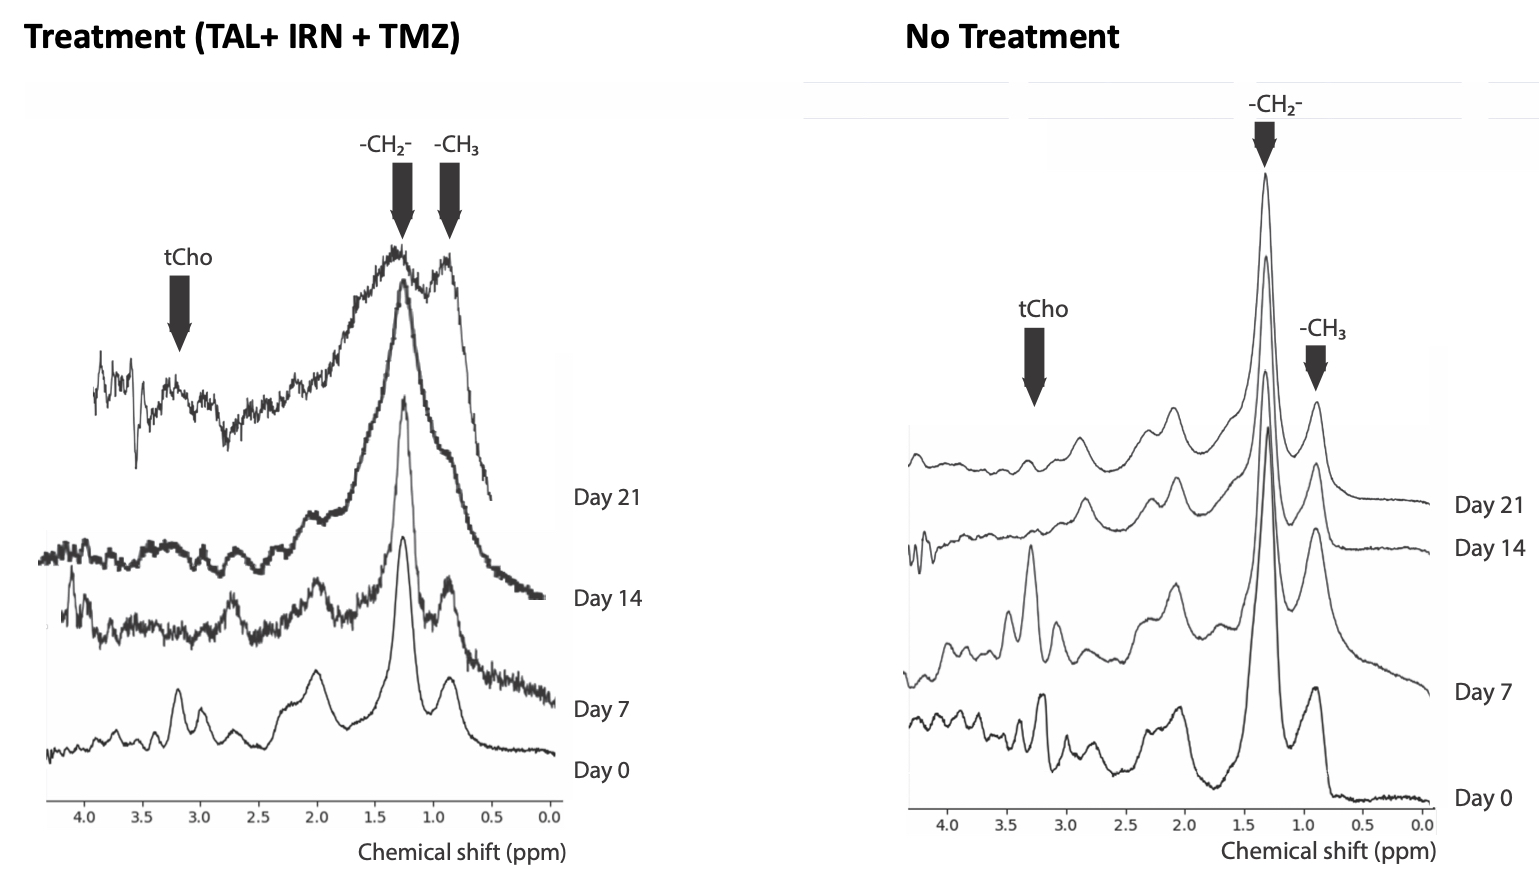
Figure 3. Longitudinal 1H MR spectra from a representative TAL+IRN+TMZ treated mouse and an untreated mouse showing distinct macromolecule peak patterns in the two groups.